11email: tszeifer@eso.org 22institutetext: Astronomisches Institut Potsdam, An der Sternwarte 16, 14482 Potsdam, Germany 33institutetext: European Southern Observatory, Karl-Schwarzschild-Str. 2, 85748 Garching, Germany 44institutetext: INAF-Osservatorio Astronomico di Palermo, Piazza del Parlamento 1, 90134 Palermo, Italy 55institutetext: Department of Theoretical Physics and Astrophysics, Masaryk University, Brno, Czech Republic
The nature of the recent extreme outburst of the Herbig Be/FU Ori binary Z CMa††thanks: Based on observations made with ESO Telescopes at the Paranal Observatories under programme IDs: 074.C-0442, 081.C-0410, and 282.C-5041.
Abstract
Context. Z CMa is a binary system which consists of two young stars: A Herbig AeBe component “Z CMa NW” embedded in a dust cocoon and a less massive component “Z CMa SE”, which is classified as a FU Orionis type star. Associated to the binary system is a giant parsec size jet. Past spectropolarimetric observations showed that the position angle of the linear optical polarization is perpendicular to the jet axis, indicating that the visual light escapes the cocoon via cavities aligned with the jet axis and is then scattered back into the line of sight of the observer. Recently, the system showed the largest outburst reported during the almost 90 years of available observations.
Aims. We present new spectrophotometric and spectropolarimetric data obtained in 2008 during the recent outburst phase.
Methods. The data obtained in the visual spectral range at medium spectral resolution were used to study the geometry of the system from the linear polarization spectra and its magnetic field from the circular polarization spectra.
Results. During the recent outburst we detect that the Z CMa system is polarized by 2.6% in the continuum and emission line spectrum, with a position angle still perpendicular to the jet. From the high level of polarization we conclude that the outburst is associated with the dust embedded Herbig AeBe NW component. The deep absorption components of the Balmer lines in the velocity frame extending from zero velocity reaching a wind velocity of 700 km s-1, together with the absence of a red-shifted broad emission at similar velocities, indicate a bi-polar wind. We do not detect a significant mean longitudinal magnetic field during the outburst, but the data obtained in 2004 indicates the possible presence of a rather strong magnetic field of the order of 1 kG. However, we critically review the applied method of magnetic field measurements in the presence of a strong stellar wind. The main result of our studies is that the bolometric luminosity of Z CMa remained surprisingly constant during the recent “outburst”. We conclude that either the geometry of the cavity through which the light escapes from the cocoon has opened a new path, or that the screen of dust, which reflects the light toward the observer became more efficient causing the observed increase of the visual brightness by about 25.
Key Words.:
Stars: individual: Z CMa — Stars: pre-main sequence, winds, outflows, magnetic fields, variable: general, binaries: close1 Introduction
Z CMa (HD 51370) is a young visual binary system consisting of a 12 M⊙ Herbig AeBe star and a 3 M⊙ FU Ori companion at an age of 0.3 Myr (e.g. Alonso-Albi et al. Alonso2009 (2009)). Both components are surrounded by active accreting disks. Associated with the binary system is a giant parsec size jet (Poetzel et al. Poetzel1989 (1989)). First evidence for the binarity was an elongation of the K-band image of this star toward the northwest (Leinert & Haas Leinert1987 (1987) and Koresko et al. Koresko1989 (1989)). The binary was resolved by Koresko et al. (Koresko1991 (1991)) with near-IR speckle interferometry. The angular separation of the binary was only 01 with a position angle of 120∘. At that time the south-eastern (Z CMa SE) component was dominant in the visual spectral range and near-infrared and bands, while the north-western component was found brighter at 2.2 m and longer wavelengths. Thiébaut et al. (Thiebaut1995 (1995)) resolved the binary system with speckle interferometry at 730 nm and 656 nm. From the data obtained in the quiescent state in 1989.84 the authors deduced = 1300 , = 13 and =10000 K for the Z CMa SE FU Ori component and = 2400 , = 1690 , and K for the near infrared Z CMa NW component. The authors attributed the excess flux associated with Z CMa NW at optical wavelengths to scattered light, arguing that photons originating from the hidden central source are scattered back into the line of sight. Scattering of the photons is assumed to take place along the walls of a cavity (usually ascribed to a strong bipolar outflow) evacuated within the envelope. Radio observations in 2005 and 2006 in the cm and mm range suggest that we see Z CMa NW at an inclination of 30∘ (Alonso-Albi et al. Alonso2009 (2009)). This means that we do not observe the inner walls of the bipolar cavity within the dusty envelope, where the photons are scattered.
The scattered light scenario is well consistent with optical spectropolarimetric observations of Whitney et al. (Whitney1993 (1993)), who detected in 1991–1992 a significant linear polarization of 1% to 2% in the continuum and up to 6% in the strong emission lines. The different polarization of continuum and lines have led Whitney et al. (Whitney1993 (1993)) to suggest that the emission lines have their origin in the Z CMa NW component. At that time the NW component contributed about 20% of the flux of the whole system at visible wavelength. The Z CMa SE component is assumed to be unpolarized, the NW component is assumed to show 6% linear polarization and the composite spectrum of the binary would then depend on the flux ratio at the respective wavelength. The position angle of the polarization of 150∘ in November 1991 and 154∘ in March 1992 was roughly perpendicular to the 3.6 parsec scale jet of Z CMa at a position angle of 60∘, discussed by Poetzel et al. (Poetzel1989 (1989)). The same authors reported several velocity components in the jet of which the fastest knots reaches a velocity of about km s-1. This position angle of polarization indicates that the light from the Z CMa NW component primarily escapes from the envelope by scattering off the walls of a jet-blown cavity. A smaller scale jet with a similar position angle was recently discovered in X-rays by Stelzer et al. (Stelzer2009 (2009)).
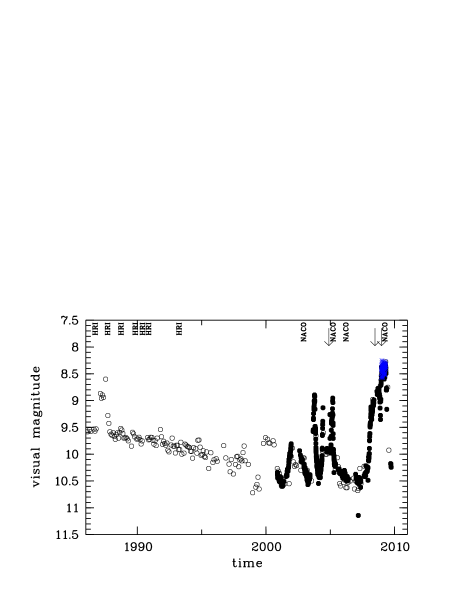
According to photometric and visual observations available from various archives, Z CMa exhibited recently the largest outburst reported during the almost 90 years of available observations. The light-curves presented in Fig. 1 were extracted from the archives of the “All Sky Automated Survey” (ASAS) rejecting the data points with quality flags C and D (Pojmanski Pojmanski2002 (2002)). More data over a larger time span were retrieved from the AAVSO data base. For the later visual estimates the data points taken for a given month were averaged after clipping data points beyond a 2 threshold. Irregular variability was observed in the thirties of the last century. Later Z CMa steadily increased its brightness, reaching a phase of constant brightness until about 1973. Since then the star was fading from almost 9m in 1973 to 105 in 2007. Superimposed to the fading lightcurve we can identify in Fig. 1 several more recent outbursts, the most prominent ones were observed in 1987 and 2000 with a duration similar to that of eruptions of EX Lupi-type (EXors) young stars. Between 2002 and 2006 the light-curve appeared very irregular. A gradual increase of the visual brightness started at the end of 2007, reaching the highest brightness between November 2008 and May 2009. This bright phase has now ended, with the latest observations reporting a visual brightness fainter than 10m after a very rapid decline.
In this letter we present new optical spectropolarimetric observations of linear and circular polarization in the Z CMa system, obtained during the recent outburst, and discuss the cause for this outburst.
2 Results and Discussion
2.1 Spectroscopy and Linear Polarization
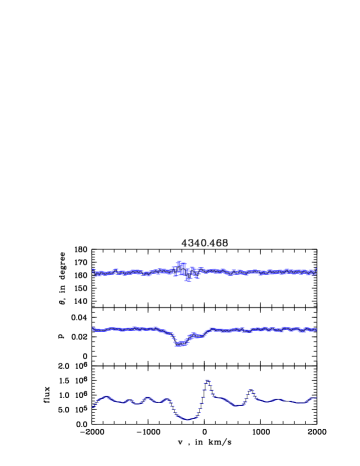
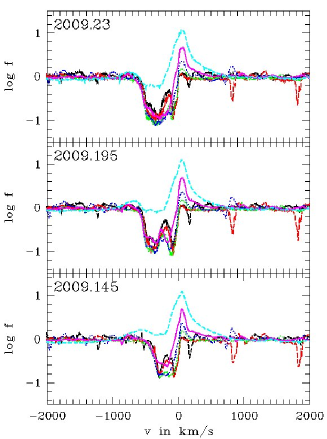
The spectropolarimetric data sets provide very important insights into the nature of the at visual wavelengths unresolved binary star. We found significant changes of the line shapes in the linearly polarized light with respect to the data published by Whitney et al. (Whitney1993 (1993)). In our data obtained during the extreme outburst, we see a flat polarization spectrum with an average polarization P=2.6% 0.1% at 4350Å at a position angle of 160. This polarization angle is roughly perpendicular to the parsec scale jet associated with Z CMa, and similar to observations presented by Whitney et al. (Whitney1993 (1993)) who measured in November 1991 P = 2.0%, P.A = 150 and four months later P = 1.4%, P.A = 154. However, in the deep absorption troughs of the Balmer lines and other strong wind absorption lines, we detect depolarization signatures (see Fig. 3). These line components caused by the accelerated wind show a composite spectrum: We observe a broad blue trough typically associated with an accelerated wind, visible to about 600 km s-1, with less deep absorption up to about 800 km s-1. As is shown in more detail in Fig. 4, this is not mirrored by emission on the red side of the lines as would be expected for spherical symmetric winds. The trough is rather deep, indicating that a large fraction of the stellar disk is obscured by the wind acceleration zone. Superimposed to the wind feature is a very narrow emission component of 50 to 60 km s-1 half width, which can be seen as well for faint low excitation lines like of Fe ii and similar species. In contrast to the observations of Whitney et al. (Whitney1993 (1993)), we find that the narrow emission lines show the same degree (2.6%) and position angle of polarization as the continuum. These observations can be understood within the above mentioned model that the visible light can only escape via cavities from the dust cocoon, most likely aligned with the bi-polar jet and a changing flux ratio between the two stars: In our recent observations the continuum radiation as well as the emission components are dominated by the NW component, while only in the deep absorption troughs the unpolarized SE component is still contributing. Whitney et al. (Whitney1993 (1993)) observed the binary in a different state, when the unpolarized SE component dominated the flux in the near-UV and visual. The strongest emission lines primarily emitted by the NW-component reached up to a polarization of about 6%. This high value must be seen as the degree of polarization of the NW-component at all wavelength and accordingly the polarization of the NW-component was higher at that time than what we see now in the visual and near-UV continuum. The change of the degree of polarization of the NW component from 6% at a low state to 2.6% at the brightest state, together with the brightening of the target indicates that the geometry of the cavity through which the light escapes from the cocoon has opened a new path, or that the screen of dust, which reflects the light toward the observer, became more efficient, causing an increase in the visual brightness by about 25. In the strongest Balmer lines the absorption trough presents a double plateau with the deepest depolarization starting at the terminal wind velocity of about 600 km s-1 and ending at about 200 km s-1. At red-shifted wavelengths the NW component dominates the composite spectrum. It is possible to explain the double plateau on the blue-shifted side, if the spectrum of the SE component is that of a fast rotator with hydrogen absorption lines such that the contribution of the SE component to the composite spectrum is smaller from 200 to 0 km s-1 at wavelengths. Other line species which show depolarization signals in the blue-shifted parts of line profiles are calcium lines in which the depolarization signal can only be seen at km s-1 and the Fe ii-lines, which do not present the deep absorption troughs in the flux spectrum, but show a double absorption feature in the linear polarization with an absorption at the velocity of the fast wind and another absorption at the system velocity. For the later we can not conclude if the depolarization has an intrinsic origin in the NW component, or if the presumed young FU Ori star contributes unpolarized line emission to the composite spectrum.
We note that the depth and the width of the absorption at the blue-shifted side of the Balmer lines, in absence of a broad 600 km s-1 red-shifted emission, indicates a bipolar geometry of the wind. If no such broad red emission is observed, then it can be argued that either there is no gas streaming out except out of the polar region, or that the recombination radiation in the line is not visible through the cavities, but blocked by the disk or cocoon. For the H line we find however a broad emission component beyond the velocity of the wind absorption feature. The H absorption trough is not as deep as for other Balmer lines. This broad component is caused by electron scattering as is often seen in luminous hot stars and therefore not related to high velocity outflows.
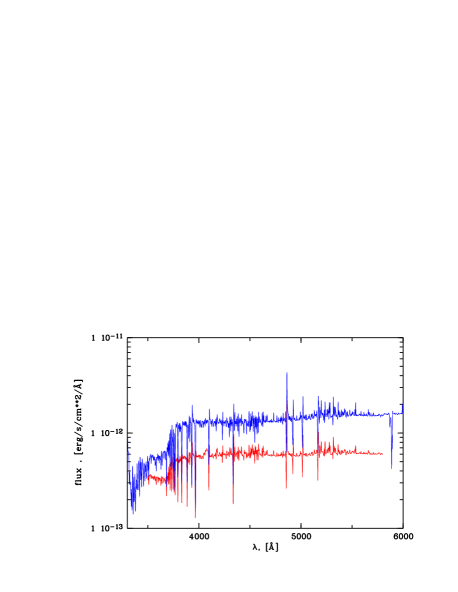
The spectral slope as indicated in Fig. 2 appears redder during the recent outburst, which contradicts an increase of temperature as source of the luminosity change as proposed by van den Ancker et al. (vandenAncker2004 (2004)). Similarly, the very insignificant change of the depth of the Balmer jump would argue against a dramatic change of stellar parameters.
6
2.2 Circular Polarization
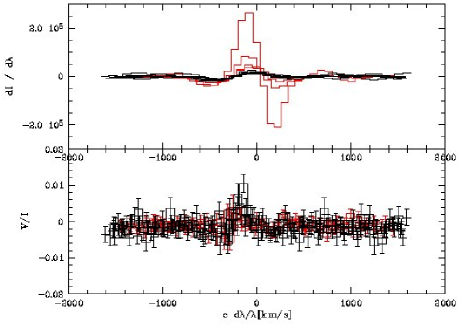
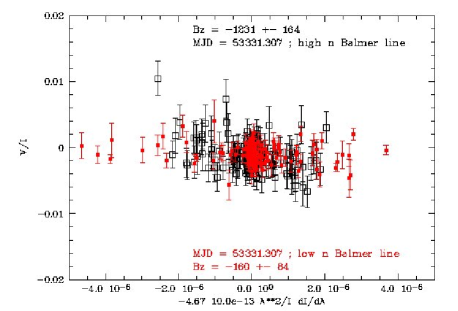
The analysis of circular polarization measurements obtained during the outburst reveals no significant detection. In the data obtained in May 2008 we detect a weak signal of circular polarization in the trough of all Balmer lines, which however does not match in wavelength the unpolarized line profile. However, while reviewing the archive data already published by Wade et al. (Wade2007 (2007)) we do detect a clear circular polarization signal in particular at the blue shifted side of the high-n Balmer lines. For the low excitation lines from H to H we measure G, while from the higher excitation Balmer lines a very significant field of G (see Figs. 5 and 6) was obtained. Still, these results have to be taken with some caution. To properly interpret the circular polarization signal, it is necessary to consider the composite nature of the binary system spectrum, the superimposed effects of the stellar wind, and the variability of the target. The B-field diagnostics as applied above correlates the s-shaped profile in with the s-shaped profile of the spectral gradient dd of the Voigt profiles. The B-field diagnostics may, for instance, be disturbed by the light of the companions, and, in particular, by the stellar wind features due to the spectral gradient dd along the x-axis of the diagnostic diagram (see Figs. 5 and 6). It should as well be considered that the target is variable on very short time scales, such that spectra may have changed between the respective exposures at .
It is as well unclear if these fields were detected in the dust embedded Herbig Ae star or in the SE companion. In the first case the strong field is only seen in the fainter Balmer lines, because the high opacity of the expanding wind at the blue shifted part of the strong lines would not allow light from the photosphere to escape from the NW component. Alternatively, without any indication of the contribution of the respective two stars to the UV and visible spectra, one can as well explain the data if the magnetic field was detected in the SE component. This component may have dominated the spectra of 2004 in the wavelength range of the Balmer lines where we measure the Stokes V features, whereas later in May 2008, the contribution of Z CMa SE became insignificant on the blue-shifted side of the P Cygni line of Z CMa NW such that we detect a hint of circular polarization in the red-shifted part of the hydrogen lines only, but no S-shaped feature, which would lead to a magnetic field detection. Nor would the wind dominated spectral line gradients dd linearly correlate with . With the few available spectra it is not yet possible to reliably conclude on the origin of the features in the circular polarization spectrum.
2.3 Origin of the Outbursts
Despite of the different origin of the NIR Ks band flux from the surrounding dust cocoon and the optical flux with an origin from the pole of the star, we presume that a strongly changed optical/UV source would heat up the dust and the increase of the luminosity of the stellar core would be re-emitted by thermal radiation in the Ks-band and beyond. There is however no significant change of the Ks-band flux as far as we can tell from the K-band flux ratios given in Table 2 or from comparing the most recent report of infrared observations by Antoniucci et al. (Antoniucci2009 (2009)) of Ks at the peak of the lightcurve in March 2009, with Ks reported by Koresko et al. (Koresko1991 (1991)). Similarly there is no change in the X-ray properties reported by Stelzer et al. (Stelzer2009 (2009)) in respect to earlier measurement at a ‘quiescent’ phase. If the short-term optical brightening was an EXor-like accretion event, X-ray variability would have been expected. Our polarimetric data leads to a new interpretation in which the X-ray emission associated with the binary may be attributed to the lower-mass SE component which is not involved in the outburst.
The apparently insignificant change of the K-band thermal emission rather argues against the strongly increased luminosity of during short outbursts, as estimated by van den Ancker et al. (vandenAncker2004 (2004)) from the visual SEDs with respect to only estimated by Thiébaut et al. (Thiebaut1995 (1995)) from the SED including the thermal emission. It rather underlines our interpretation that the bolometric luminosity during the outbursts remains constant, but the amount of visible light transmitted through the envelope has changed. The derived high luminosity was primarily a consequence of the early spectral type estimated for the NW source from the He i and O i lines, which lead to very high bolometric and extinction corrections. We detect these lines with blue shifted broad absorption profiles and with P Cygni profiles respectively, both indicating an origin of the lines in the accelerated wind rather than in the photosphere of the NW component. The wind however, with indication of bipolarity and eventually with indications for a magnetic field, may well be excited by other sources rather than by the thermal radiation from the star. The short-term outbursts are nevertheless superimposed to long-term FU Ori like changes in the visual brightness, with a slow brightening by one magnitude until about 1970 and a subsequence fading by a similar amount. It is well possible that any of the binary components contributes to these changes.
3 Summary
We have shown that the NW component of Z CMa was undergoing a historically bright outburst in 2008/2009. Our polarimetric data supports a variable scattering geometry of the NW envelope as the cause for the optical outburst, rather than FU Ori or EXor events from the SE component. From the changes in the linear polarization spectra taken at the outburst phase we conclude that the scattering path in which the light of Z CMa NW escapes from the dust cocoon must have changed. The linear polarization from the now dominant NW component was found smaller than the 6% estimated at the fainter phase in 1991. We do not find changes in the K-band magnitude in contrast to the recent change of 25 in the visual. A significant fraction of the variability may be explained by the changed, more direct line of sight in which we now see the Z CMa NW: More light from the central source would reach the observer through a widened cavity, while the central source directly observed in the K-band did not significantly change in luminosity.
Acknowledgements.
We acknowledge with thanks the variable star observations from the AAVSO International Database contributed by observers worldwide and used in this research. This work profited greatly from data extracted from the ASAS data base. Based on observations made with the European Southern Observatory telescopes obtained from the ESO/ST-ECF Science Archive Facility.References
- (1) Antoniucci, S., Arkharov, A.A., Giannini, T., et al. 2009, ATel #2024
- (2) Appenzeller, I., Fricke, W., Fürtig, W., et al. 1998, Messenger, 94, 1
- (3) Alonso-Albi, T., Fuente, A., Bachiller, R., et al. 2009, A&A, 497, 117
- (4) Bagnulo, S., Szeifert, T., Wade, G.A., et al. 2002, A&A, 389, 191
- (5) Garcia, P.J.V., Thiébaut, E., Bacon, R. 1999, A&A, 346, 892
- (6) Koresko, C.D., Beckwith, S.V.W., Sargent, A.I. 1989, AJ, 98, 1394
- (7) Koresko, C.D., Beckwith, S.V.W., Ghez, A.M., et al. 1991, AJ, 102, 2073
- (8) Leinert, C., & Haas, M. 1987, A&A, 182, L47
- (9) Lenzen, R., Hartung, M., Brandner, W., et al. 2003, SPIE, 4841, 944
- (10) Millan-Gabet, R., & Monnier, J.D. 2002, ApJ, 580, L167
- (11) Poetzel, R., Mundt, R., Ray, T.P. 1989, A&A, 224, L13
- (12) Pojmanski, G. 2002, Acta Astronomica, 52, 397
- (13) Stelzer, B., Hubrig, S., Orlando, S., et al. 2009, A&A, 499, 529
- (14) Thiébaut, E., Bouvier, J., Blazit, A., et al. 1995, A&A, 303, 795
- (15) van den Ancker, M.E., Blondel, P.F.C., Tjin A Djie, H.R.E., et al. 2004, MNRAS, 349, 1516
- (16) Wade, G.A., Bagnulo, S., Drouin, D., et al. 2007, MNRAS, 376, 1145
- (17) Whitney, B.A., Clayton, G.C., Schulte-Ladbeck, R.E. 1993, ApJ, 417, 687
| Date | Instrument | range [Å] | Detector, grism |
|---|---|---|---|
| 2004/11/22 | FORS 1 | 3470 - 5870 | TEK, 600B |
| 2008/05/22 | FORS 1 | 3310 - 6200 | E2V, 600B |
| 2008/12/26 | FORS 1 | 3310 - 6200 | E2V, 600B |
| 2008/12/26 | FORS 1 | 3680 - 5120 | E2V, 1200B |
| 2009/02/23 | FEROS | 3570 - 9210 | Echelle |
| 2009/03/13 | FEROS | 3570 - 9210 | Echelle |
| 2009/03/26 | FEROS | 3570 - 9210 | Echelle |
| Year | Band | ffSE | PA [∘] | d [″] |
|---|---|---|---|---|
| 2002/12/05 | L | 49.57 0.15 | ||
| 2002/12/05 | J | 0.94 0.01 | 309.90 | 0.107 |
| 2002/12/05 | Ks | 3.97 0.01 | 311.9 | 0.102 |
| 2005/02/16 | Ks | 4.7 0.01 | 311.43 | 0.098 |
| 2005/02/16 | H | 2.79 0.01 | 310.98 | 0.114 |
| 2005/02/16 | NB2.17 | 4.34 0.05 | 314.74 | 0.104 |
| 2006/03/13 | NB2.12 | 3.63 0.01 | 311.93 | 0.101 |
| 2006/03/13 | NB2.17 | 3.42 0.01 | 312.43 | 0.101 |
Appendix A Observations and Data Reduction
The observational material discussed in this section includes FORS 1 spectropolarimetric data (Appenzeller et al. Appenzeller1998 (1998)) obtained in the framework of our programs carried out in May 2008 and in December 2008. Additionally, we used ESO archive data from 2004 obtained in circular spectropolarimetric mode. These data were used by Wade et al. (Wade2007 (2007)) to search for the presence of longitudinal magnetic fields in a larger number of Herbig AeBe stars. These older observations (see Table 1) were carried out with a slit width of 08 and grism 600B (). The flux spectra in the ordinary and extraordinary ray of the Wollaston prism were extracted for all position angle settings of the retarder waveplate. Since there were no available flux calibrators observed for this setup in the respective night, we used flux calibrators taken in normal spectroscopic mode without the Wollaston prism. The new spectropolarimetric data from 2008 were obtained with the same instrument, but now equipped with a higher UV response detector system with a smaller pixel size. During the December run we have used the higher dispersion grism 1200B in addition to the data with the 600B grism. In all our observations the slit width was set to 04 to optimize the resolution for the polarimetric measurements ( and , respectively). The spectrophotometric calibrators retrieved from the archive were observed without polarization optics on different nights. One source of uncertainty in the flux calibration is therefore the unclear spectral response of the wave retarder plates, for which we presume a high throughput over the full spectral range. However, significant slit losses are expected with this setup due to the narrow slit widths and the difficult acquisition of the target on the slit considering the extreme brightness of the target for 8 m-class telescopes. To remedy this difficulty related to the absolute calibration, we re-scaled the flux at 5500 Å to the monthly average of the AAVSO visual observations of 94 in November 2004 and 8.4 in December 2008. In Fig. 2 we present spectrophotometric fluxes for the Z CMa system in 2004 and 2008, respectively. Further, for the proper interpretation of the measured polarization angle, we corrected the result with the chromatic zero angle of the super-achromatic half wave retarder plate.111The data is available on the instrument web pages: http://www.eso.org/sci/facilities/paranal/instruments/fors/ . To perform linear polarization measurements, a Wollaston prism and a half-wave retarder plate rotated in 22.5∘ steps between 0 and 67.5∘ were used. For circular polarization measurements the quarter-wave retarder plate was used at the positions 45∘ and 45∘. Our FORS 1 data were supplemented by three high-resolution FEROS spectra (=48 000) obtained in February and March 2009 to study the behavior of hydrogen lines. The journal of spectroscopic observations is presented in Table 1.
To better understand the parameters of the resolved binary system we retrieved all available NACO adaptive optics near-infrared data (Lenzen et al. Lenzen2003 (2003)) from the ESO archive. As for the FORS 1 data sets, the target is rather bright for imaging mode observations with 8 m-class telescopes and accordingly the various data sets were taken with a mixed choice of neutral density and narrow band filters. As a consequence we cannot provide absolute photometry for NACO data with the required level of confidence, but only the flux ratio of the two components (see Table 2) and the astrometric parameters of the binary. In case of normal jittered observation sequences we have used the Eclipse data reduction package provided by ESO to NACO users. In other cases we had only two acquisition exposures or a few jitter positions.