Search for GeV gamma-ray emission from clusters of galaxies studied by TeV telescopes
Abstract
A cluster of galaxies is a huge system bounded by gravitation, and cosmic rays are thought to be confined in the system, thus it should contain much non-thermal components. Many theories predict significant gamma-ray emission that could be detectable by state-of-the-art gamma-ray telescopes. Some clusters have already been studied by using Fermi gamma-ray space telescope in the GeV band and Cherenkov telescopes in the TeV band, but most clusters are not studied in both energy bands. Here I present results on GeV gamma-ray emission from clusters of galaxies which have been given upper limits by Cherenkov telescopes using Fermi archival data.
I INTRODUCTION
A cluster of galaxies is a huge system bounded by gravitation, and is thought to be an ideal site for cosmic-ray acceleration, since cosmic-rays are confined in the system for a long time (see, e.g. Aharonian Aharonian2004 ). High-energy particles, accelerated at large-scale shockes associated with accretion and merger processes, or in other processes, interact with ambient matter and radiation fields to produce non-thermal emission from radio to gamma-ray energies.
Gamma-ray emission in clusters may come from several processes (see, e.g. review by Blasi et al. Blasi2007 ). Collision of hign-energy protons with intra-cluster medium produce gamma-ray emission via decay of neutral pions. High-energy electrons can upscatter ambient photons such as cosmic microwave background (CMB), infrared, starlight and other soft photon fields to gamma-ray energies. Gamma-ray production from inverse Compton scattering by secondary electrons generated when ultra-high-energy protons interact with CMB via process. Dark matter annihilation could also be a source of gamma-rays.
In the GeV band, association between clusters of galaxies and EGRET untidentified sources have been claimed by Totani & Kitayama Totani2000 , Colafrancesco Colafrancesco , Kawasaki & Totani Kawasaki2002 , and Scharf & Mukherjee Scharf2002 , but Reimer et al. Reimer2003 could not confirm the association and gave upper limits for 58 clusters. At TeV energies, there are several attempts to search for emission from nearby clusters, but so far only upper limits have been reported for the Perseus and Abell 2029 clusters with the Whipple telescope Perkins2006 , Perseus with MAGIC Aleksic2009 , Abell 496 and Abell 85 with H.E.S.S. Aharonian2008 , Coma with H.E.S.S. Aharonian2009 , Abell 3667 and Abell 4038 with CANGAROO-III Kiuchi2009 (see Table 1).
| Name | Position | Redshift | Upper Limit | Group & Reference |
|---|---|---|---|---|
| Perseus | 03h19m, | 0.018 | % Crab | Whipple |
| ( GeV, ) | Perkins et al. 2006 Perkins2006 | |||
| % Crab | MAGIC | |||
| ( GeV, point-like) | Aleksic et al. 2009 Aleksic2009 | |||
| Abell 2029 | 15h10m, | 0.077 | % Crab | Whipple |
| ( GeV, ) | Perkins et al. 2006 Perkins2006 | |||
| Abell 496 | 04h34m, | 0.033 | % Crab | H.E.S.S. |
| ( TeV, ) | Aharonian et al. 2009 Aharonian2008 | |||
| Abell 85 | 00h42m, | 0.055 | % Crab | H.E.S.S. |
| ( TeV, ) | Aharonian et al. 2009 Aharonian2008 | |||
| Coma | 12h59m, | 0.023 | % Crab | H.E.S.S. |
| ( TeV, ) | Aharonian et al. 2009 Aharonian2009 | |||
| Abell 3667 | 20h12m, | 0.055 | % Crab | CANGAROO-III |
| ( GeV, ) | Kiuchi et al. 2009 Kiuchi2009 | |||
| Abell 4038 | 23h47m, | 0.029 | % Crab | CANGAROO-III |
| ( GeV, ) | Kiuchi et al. 2009 Kiuchi2009 |
Recently, Bechtol et al. Bechtol2009 reported results on 15 clusteres which are top-ranked by Pfrommer Pfrommer2008 using the Fermi Gamma-ray Space Telescope, but most of these cluster samples do not overlap with clusters observed at TeV energies. Here I report on a search for gamma-ray emission in the GeV band with Fermi for clusters which are already observed by TeV telescopes as above, in order to increase multiwavelength coverage of emission from clusters for further discussion on their high-energy behavior.
II ANALYSIS
Fermi archival data were extracted from Fermi Science Support Center and analyzed using provided tools (Fermi Science Tools v.9.15.2). Energy ranges used in the present analysis are from 200 MeV to 10 GeV, and data periods are from 2008 August to 2009 September for all the analyzed targets listed in Table 1. Only ‘diffuse’ class events were used for analysis.
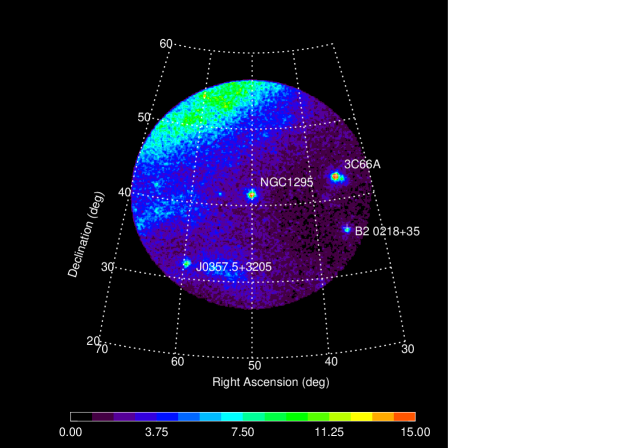
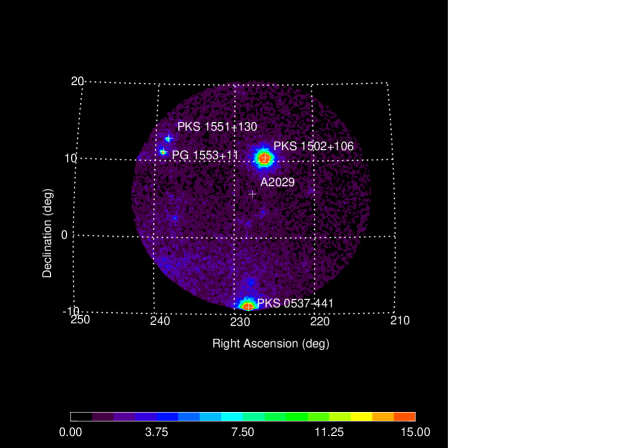
Figures 1 to 7 are count maps for each targets. Except Perseus, no significant emission was found in any of these objects. There is a point-like source in the Perseus cluster, which is identified as NGC 1275 and already reported in detail by Abdo et al. Abdo2009 .
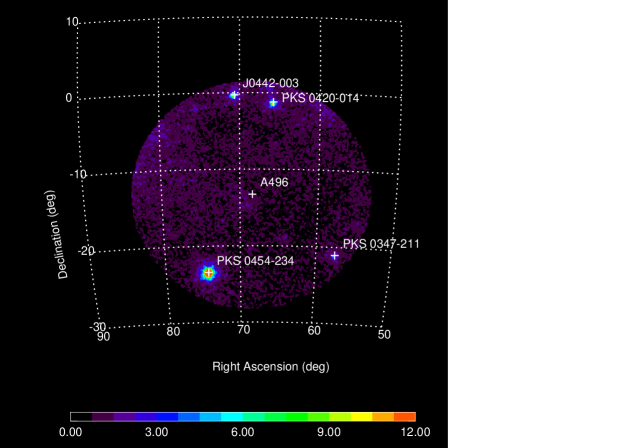
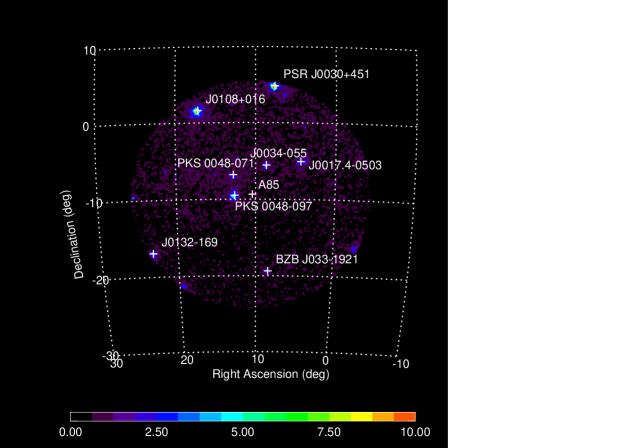
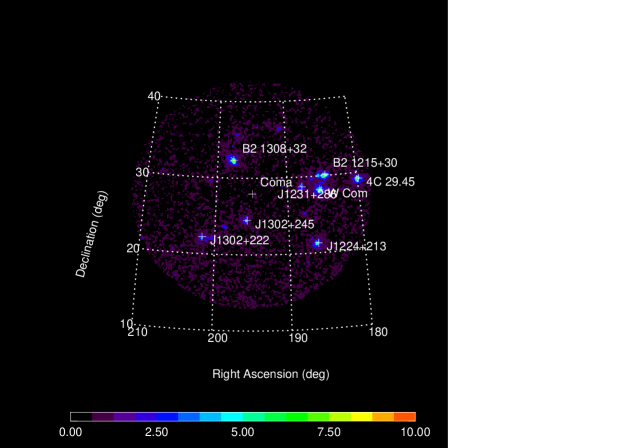
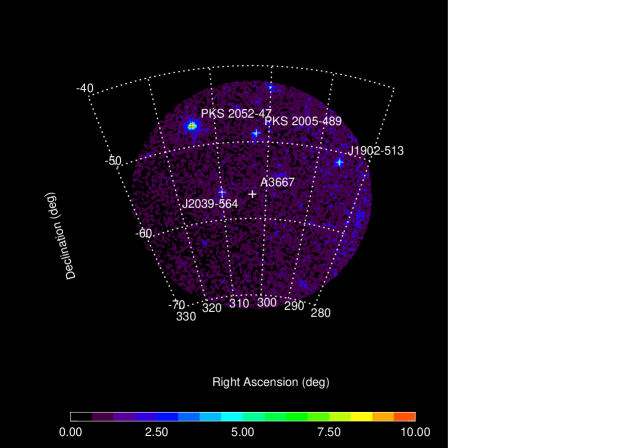
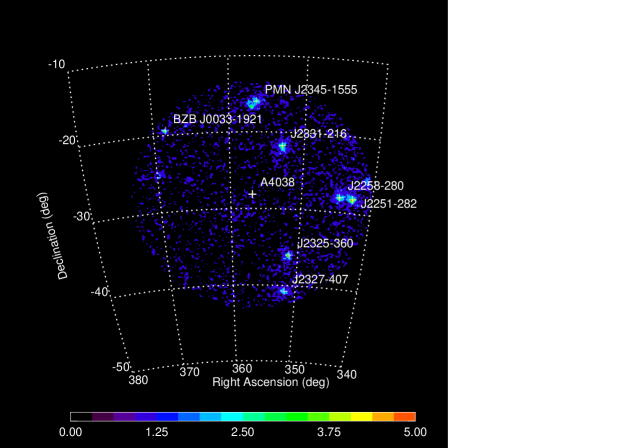
The upper limits on gamma-ray emission from each cluster have been calculated with a likelihood fitting program, gtlike, in unbinned mode, and assuming point-like sources at the center of each clusters using ‘PowerLaw2’ model so that the limits are not sensitive to the power-law indices. Sources listed in the Fermi Bright Gamma-ray Source list Abdo2009a and contained in the -radius field of view are modeled in the gtlike analysis. Prominent sources in the field, which are not listed in Ref. Abdo2009a but may affect the fitting procedure due to the point spread function, are identified by eye and also included in the analysis. The profile likelihood method was used to calculate 95% confidence level upper limits on gamma-ray flux by setting . Results are summarized in Table 2.
| Name | Upper Limit | Upper Limit | Bechtol et al. | Note |
| ( MeV) | ( MeV) | ( MeV) | ||
| Perseus | – | – | 20 | NGC 1275 (point source) |
| Abell 2029 | 4.8 | 1.3 | – | |
| Abell 496 | 1.2 | 0.61 | – | |
| Abell 85 | 0.12 | 0.062 | – | |
| Coma | 0.88 | 0.44 | 0.6 | |
| Abell 3667 | 0.23 | 0.095 | – | |
| Abell 4038 | 0.52 | 0.45 | – |
III DISCUSSION
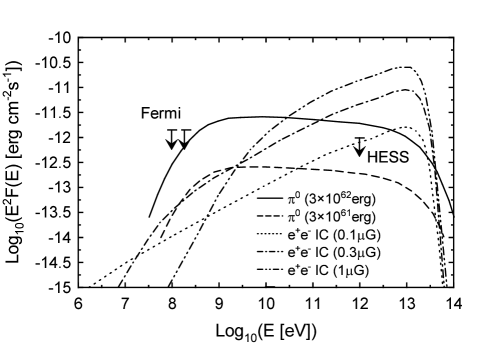
Since no significant emission was found from any of 7 clusters of galaxies (other than Perseus), we discuss restrictions on some emission models. Here we take the Coma cluster as an example. Figure 8 is a comparison of experimental limits on gamma-ray fluxes with some model predictions for the Coma cluster case. model curves are taken from Völk and Atoyan Voelk2000 and e+e- IC model curves are from Inoue, Sugiyama and Aharonian Inoue2005 . Upper limits based on GeV observations are just about to constrain model predictions, but do not restrict e+e- IC models within a plausible range of parameters. Although the TeV upper limit is a little more restrictive on the model, accumulation of Fermi data over a few years may reveal hadronic emission from the Coma cluster if the maximum energy of accelerated protons are lower than the assumed model or the spectrum is steeper.
Acknowledgements.
This work is supported by Ritsumeikan University Research Fund.References
- (1) F.A. Aharonian, “Very High Energy Cosmic Gamma Radiation”, Chapter 9 (World Scientific, Singapore, 2004)
- (2) P. Blasi, S. Gabici and G. Brunetti, IJMP A, 22, 681 (2007)
- (3) T. Totani and T. Kitayama, ApJ, 545, 572 (2000)
- (4) S. Colafrancesco, A&Ap, 396, 31 (2002)
- (5) W. Kawasaki and T. Totani, ApJ, 576, 679 (2002)
- (6) C.A. Scharf and R. Mukherjee, ApJ, 580, 154 (2002)
- (7) O. Reimer, M. Pohl, P. Sreekumar, and J.R. Mattox, ApJ 588, 155 (2003)
- (8) J.S. Perkins et al., ApJ, 644, 148 (2006)
- (9) J. Aleksic et al., preprint arXiv:0909.3267 (2009)
- (10) F. Aharonian et al., A&Ap, 495, 27 (2009)
- (11) F. Aharonian et al., A&Ap, 502, 437 (2009)
- (12) R. Kiuchi et al., ApJ, 704, 240 (2009)
- (13) K. Bechtol et al., Talk at “TeV Particle Astrophysics”, SLAC, Menlo Park, California, U.S.A., July 13-17, 2009
- (14) C. Pfrommer, MNRAS, 385, 1242 (2008)
- (15) A.A. Abdo et al., ApJ 699, 31 (2009)
- (16) A.A. Abdo et al., ApJS 183, 46 (2009)
- (17) H.J. Völk and A.M. Atoyan, ApJ, 541, 88 (2000)
- (18) S. Inoue, N. Sugiyama and F. Aharoninan, ApJ, 628, L9 (2005)