On the nature of the progenitors of three type II-P supernovae: 2004et, 2006my and 2006ov
Abstract
The pre-explosion observations of the type II-P supernovae 2006my, 2006ov and 2004et, are re-analysed. In the cases of supernovae 2006my and 2006ov we argue that the published candidate progenitors are not coincident with their respective supernova sites in pre-explosion Hubble Space Telescope observations. We therefore derive upper luminosity and mass limits for the unseen progenitors of both these supernovae, assuming they are red supergiants: 2006my (; M⊙) and 2006ov (; M⊙). In the case of supernova 2004et we show that the progenitor candidate, originally identified in Canada France Hawaii Telescope images, is still visible 3 years post-explosion in observations from the William Herschel Telescope. High-resolution Hubble Space Telescope and Gemini (North) adaptive optics late-time imagery reveal that this source is not a single yellow supergiant star, but rather is resolved into at least three distinct sources. We report the discovery of the unresolved progenitor as an excess of flux in pre-explosion Isaac Newton Telescope i’-band imaging. Accounting for the late-time contribution of the supernova using published optical spectra, we calculate the progenitor photometry as the difference between the pre- and post-explosion, ground-based observations. We find the progenitor was most likely a late K to late M-type supergiant of M⊙. In all cases we conclude that future, high-resolution observations of the supernova sites will be required to confirm these results.
keywords:
stars: evolution - supernovae: general - supernovae: individual: SN 2004et, SN 2006my, SN 2006ov1 Introduction
Type II-plateau (II-P) supernovae (SNe) have long been held to be the core-collapse induced explosions of red supergiant stars - evolved massive stars with cool (3000 K), expansive (103 R⊙) hydrogen (H) rich envelopes (for a detailed review see Smartt 2009). That the progenitors of such SNe should be H-rich follows from the observation of strong H lines in the spectra of these events, the definition of a type II SN (see for example, Filippenko 1997). For a star to undergo core-collapse it must be of sufficient initial mass in order to proceed to the ultimate stages of nuclear burning and thereby attain an iron core. Unable to counteract gravity through further nuclear fusion, the iron core contracts, but is supported against complete collapse by electron degeneracy pressure. When the core reaches the Chandrasekhar mass limit (1.4 M⊙), electron degeneracy pressure is overcome and the core rapidly collapses until neutron degeneracy pressure brings it to a halt, forming a neutron star. This collapse releases around 1053 erg of gravitational potential energy, which flows outwards from the collapsed core in the form of neutrinos. Roughly 1 percent of this neutrino flux (1051 erg) couples with the outer layers of the star, causing the supernova explosion. For a review of the core-collapse process see, for example, Bethe 1990. Theory tells us that the initial mass threshold for a star to produce a collapsing core is between 7-12 M⊙ (Heger et al. 2003; Eldridge & Tout 2004; Siess 2007; Poelarends et al. 2008).
Attempts to directly observe SN progenitors are hampered by a range of issues: the rarity of SN explosions (1 SN per galaxy per 100 years); the difficulty in resolving single stars in galaxies outside of our own; and the lack of deep, high-quality pre-explosion observations of SN sites. Not surprisingly few SNe overcome these problems, but in recent years the archive of the Hubble Space Telescope (HST) has gone some way to increase the numbers that do. The diffraction limited view of HST has made it possible to identify single massive stars in galaxies at distances of up to 20 Mpc.
For the last decade, several research groups around the world have been systematically searching for the progenitors of Core-Collapse SNe in archival imagery, for the most part in data from HST (e.g., Van Dyk et al. 2003a, c; Smartt et al. 2001, 2003; Li et al. 2005a, 2007; Prieto et al. 2008; Botticella et al. 2009). It was in archival HST and high quality Gemini telescope imagery that the first confirmed discovery of a red supergiant progenitor for a type II-P SN was made; that of SN 2003gd, with an estimated mass of 8 M⊙ (Smartt et al. 2004; Van Dyk et al. 2003b; Maund & Smartt 2009). This was followed by the detection of the red supergiant progenitor of SN 2005cs (Maund et al. 2005; Li et al. 2006; Eldridge et al. 2007), again in archival HST data. Several other SN II-P progenitor candidates have been reported in the literature: SN 1999ev (Maund & Smartt 2005; Van Dyk et al. 2003c), SN 2004A (Hendry et al. 2005), SN 2004et (Li et al. 2005a), SN 2006my and SN 2006ov (Li et al. 2007), SN 2008bk (Mattila et al. 2008), SN 2008cn (Elias-Rosa et al. 2009), and SN 2009kr (Fraser et al. 2010). All were identified in HST data, with the exception of the progenitor of SN 2008bk which was found in images from the VLT. More often than not, even where HST data were available, non-detections have been the norm. In these cases, qualified upper luminosity and mass limits have been set from the depth of the pre-explosion images, the main caveat being the assumption that the progenitor was a red supergiant (e.g. Smartt et al. 2003; Van Dyk et al. 2003c).
In an extensive paper (Smartt et al. 2009) we have attempted to place constraints on the progenitor population of type II-P SNe by examining the progenitor detections and detection limits of 20 such events in a homogeneous fashion. From a maximum likelihood analysis of these mass limits assuming a Salpeter initial mass function (IMF), we found minimum and maximum initial masses for the progenitors of type II-P SNe of M⊙ and M⊙. The minimum mass is in good agreement with that predicted by theory, but the maximum mass is lower than expected. Stars with main-sequence masses of up to M⊙ are expected to retain most of their H-rich envelope, becoming red supergiants and exploding as SNe II-P. In Smartt et al. (2009) we estimate that, if our 20 progenitors were actually sampled from a population with masses between 8.5 and 25M⊙, we should have detected 4 progenitors of between 17-25M⊙. That we detected none by chance has a probability of just 2 per cent. We have termed this 2.4 result the red supergiant problem and refer the reader to Smartt et al. (2009) for detailed discussion. For several of our sample of 20 objects in that paper we relied upon previously unpublished works by our group. In this paper we report our detailed analysis of the pre-explosion observations of three of these type II-P supernovae: SNe 2006my, 2006ov and 2004et.
SN 2006my was discovered by K. Itagaki (Nakano & Itagaki 2006) on 2006 Nov 8.82 UT (all times reported here are UT), located at , some 27 west and 22.5 south of the centre of its host galaxy NGC 4651. Stanishev & Nielsen (2006) spectroscopically classified SN 2006my as type II-P, similar to the class prototype SN 1999em (Elmhamdi et al. 2003; Hamuy et al. 2001; Leonard et al. 2002) at 1-2 months past maximum. Li et al. (2007) have since shown that its discovery was probably 3 months after explosion by comparing its light curve with that of SN 1999em, and its spectra with with those of SN 2004dj.
SN 2006ov was discovered by K. Itagaki (Nakano et al. 2006) on 2006 Nov 24.86 in M61 (NGC 4303), located at , which is 5.5 east and 51 north of its host galaxy centre. From a spectrum obtained on Nov 25.56, Blondin et al. (2006) classified SN 2006ov as a type II, similar to the type II-P SN 2005cs around 1 month post-explosion although somewhat reddened in comparison. However, they do not specify the degree of reddening. Through detailed analysis of the SN light curve and spectra, Li et al. (2007) show that SN 2006ov is not significantly reddened and was most probably discovered some 3 months post-explosion. Li et al. point out that by mistakenly comparing its classification spectrum with one of SN 2005cs at around 1 month post-explosion, Blondin et al. (2006) would have observed a much redder continuum for SN 2006ov and erroneously interpreted this as being due to extinction. Since type II-P SNe become progressively redder as they evolve, the older age at discovery could explain its colour.
SN 2004et was discovered by S. Moretti (Zwitter et al. 2004) on 2004 Sep 27, located at in the nearby spiral galaxy NGC 6946. Spectroscopic and photometric monitoring revealed the presence of H Balmer lines in its optical spectra and a plateau lasting 110 d in its early-time optical lightcurves, confirming it as a type II-P SN (Li et al. 2005a; Sahu et al. 2006; Misra et al. 2007; Maguire et al. 2010). Detection of the SN at X-ray and radio wavelengths (Argo et al. 2005; Misra et al. 2007; Martí-Vidal et al. 2007) suggested the presence of significant circumstellar material (CSM), most likely the slow, dense wind of the progenitor. Interaction of the fast-moving SN ejecta with this material would create a hot, shocked region producing radio synchrotron and X-ray emission (Chevalier et al. 2006). Furthermore, at about 3 years from the explosion the appearance of wide box shaped emission lines as well as rebrightening of the SN at mid-infrared wavelenths were interpreted as being due to the impact of the ejecta on the progenitor CSM (Kotak et al. 2009). Extinction towards SN 2004et was estimated by Zwitter et al. (2004), who measured the equivalent widths of the interstellar Na i D lines from a high resolution spectrum of SN 2004et taken shortly after discovery, and calculated a total reddening (host + Galactic) of E = 0.41, using the calibrations of Munari & Zwitter (1997). It is to this value that the authors of the above refereed publications defer.
Detections of candidate progenitors have been reported for all three of these type II-P events - SNe 2006my and 2006ov by Li et al. (2007) (hereafter Li07), and SN 2004et by Li et al. (2005a) (hereafter Li05). In 2 and 3 we argue that the candidate progenitors of SNe 2006my and 2006ov are not coincident with their respective SN sites. In 4, our analysis shows that candidate, yellow-supergiant progenitor for SN 2004et is still visible some 3 years post-explosion. This yellow source is actually a blend of several point sources, which are resolved in new HST and Gemini adaptive optics images. We also present previously unpublished observations from the Isaac Newton Telescope (INT), in which we identify a red supergiant progenitor.
2 The progenitor of SN 2006my
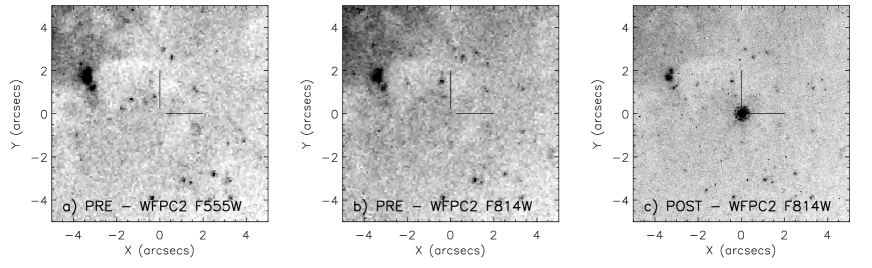
A candidate red supergiant progenitor for SN 2006my was detected by Li07 in pre-explosion HST Wide Field and Planetary Camera 2 (WFPC2) observations (program GO-5375, PI: Rubin) of its host galaxy, NGC4651. They located the SN position on the HST data through alignment with ground based observations of the SN from the Canada-France-Hawaii Telescope (CFHT). Thirteen sources common to both a CFHT+MegaCam -band SN image and the WFPC2 F814W observation were identified and their positions used to calculate a transformation between the respective coordinate frames. The SN position was measured in the CFHT frame and transformed to the coordinate system of the archival HST data, yielding (x,y) coodinates of (410.61, 158.81) on WF2 of WFPC2 with a positional error of 0.45 pixels (45 mas). This error was defined as the rms error of the transformation. Li07 identify a source within the error circle on the F814W image which they propose as the SN progenitor, characterising it as a single red supergiant star of main-sequence mass M⊙.
We have since obtained HST+WFPC2 observations of SN 2006my as part of our HST program GO-10803 (PI: Smartt). The higher resolution of these data allow a more accurate alignment with the pre-explosion data to be determined. The details of our analysis are reported below. During our work, we became aware of a similar analysis using our HST follow-up observations being performed contemporaneously by Leonard et al. (2008). Both groups agreed that our analyses should proceed independently, and we have both arrived at the same conclusions. Note that our basic result was originally published in Smartt et al. (2009), which references this paper in preparation.
2.1 Astrometry and Photometry
The pre- and post-explosion HST+WFPC2 observations of the site of SN 2006my were retrieved from the HST archive111http://archive.stsci.edu/hst/ at the Space Telescope Science Institute (STScI) via the on-the-fly recalibration (OTFR) pipeline (see Table 1). Each of the observations consisted of multiple exposures and these were co-added using the iraf stsdas task crrej in order to remove cosmic rays. The crrej task does not account for the significant geometric distortion suffered by WFPC2, which ranges from a few tenths of a pixel at the centre of each chip, to 2-3 pixels at the chip edges (Gilmozzi et al. 1995; Holtzman et al. 1995; Casertano & Wiggs 2001; Anderson & King 2003). We have chosen to follow this reduction procedure (rather than employ the Multidrizzle image reconstruction pipeline which corrects for geometric distortion (Fruchter & Hook 2002; Fruchter et al. 2009)) in order to remain consistent with the reduction performed by Li07. In this way we are able to quote measured positions that can be directly compared with those of Li07. However, we go on to apply the distortion corrections derived by Anderson & King (2003) and Kozhurina-Platais et al. (2003) before performing the alignment described in detail below. To correct for the effects of geometric distortion on point source photometry, the crrej combined images were also multiplied by a geometric correction image222f1k1552bu - http://www.stsci.edu/hst/observatory/cdbs/SIfileInfo/WFPC2/WFPC2PixCorr.
| Date | Telescope+Instrument | Filter | Exp. Time |
| (s) | |||
| Pre-explosion images | |||
| 1994 May 20 | HST+WFPC2 | F555W | 660 |
| 1994 May 20 | HST+WFPC2 | F814W | 660 |
| Post-explosion images | |||
| 2007 Apr 27 | HST+WFPC2 | F450W | 1400 |
| 2007 Apr 26 | HST+WFPC2 | F555W | 1200 |
| 2007 Apr 27 | HST+WFPC2 | F814W | 1200 |
It was noted that the pre-explosion F555W and F814W images were well aligned, hence a transformation between the pre- and post-F814W images only was used to determine the position of the SN on the pre-explosion frames. The pre-explosion SN site was imaged on the WF2 chip of WFPC2 (pixel scale = 0.1), while the SN was imaged on the PC chip (pixel scale = 0.0455) in our follow-up observations. Aided by the exquisite resolution of the HST data we identified 49 common point sources between the pre- and post-explosion F814W images. The pixel positions were first corrected for geometric distortion using the chip and wavelength dependent transformations detailed in Anderson & King (2003) and Kozhurina-Platais et al. (2003). Anderson & King (2003) reports that these transformations are accurate to 0.01 pixels in the WF chips and 0.02 pixels in the PC chip. The distortion corrected positions were subsequently used to derive a transformation between the ”distortion-free” pre- and post-explosion coordinate frames. The transformation (involving shifts, scales and rotations in x and y) was calculated using the iraf task geomap, and found to have a total (x and y rms combined) rms scatter of 0.19 WF pixels (19 mas)333Unless otherwise stated, all coordinate uncertainties quoted it this paper are total values (i.e. x and y uncertainties combined in quadrature)
To test the robustness of the fitted rms, we divided the 49 point sources into two lists, one of 24 and one of 25 sources, and calculated two independent transformations between the pre- and post-explosion frames, finding rms errors of 0.19 WF pixels for each fit. Our aim was to test each transformation with point sources not used in its derivation. The transformed positions of such objects are not affected by over-fitting that may have occurred in the geomap calculation, and as such can be used to derive an independent and robust estimate of the transformation rms.
To that end, we used the coordinate transformation derived from one list to map the post-explosion positions from the opposite list onto the pre-explosion coordinate frame. The fit rms was then calculated from the scatter of the mapped coordinates around the measured pre-explosion positions. In this way we measured independent, rms errors of 0.20 WF pixels for each of the transformations. These are consistent with the original rms values reported by geomap (0.19 WF pixels), confirming there was little or no over-fitting (not surprising given that we employed only linear terms in our geomap fit) and that the geometric distortion correction was successful. We adopt the slightly larger 0.20 WF pixel (20 mas) total rms for all of the above transformations. (Details of all the transformation rms values are recorded in Table 2.)
| 49 source transform | 24 source tranform | 25 source transform |
| = 0.124 | = 0.125 | = 0.116 |
| = 0.148 | = 0.146 | = 0.151 |
| = 0.193 | = 0.192 | = 0.190 |
| (residuals estimated from transformed positions | ||
| of fit-independent source coordinates) | ||
| = 0.134 | = 0.140 | |
| = 0.151 | = 0.145 | |
| = 0.202 | = 0.202 | |
| All values are in units of WF chip pixels (0.1 / pix) | ||
The position of SN 2006my in the post-explosion F814W frame was measured using the three centring algorithms of the daophot task phot - centroid, Gaussian and ofilter - and the PSF-fitting photometry package HSTphot444Positions measured by HSTphot differ from those of daophot by -0.5 in both x and y coordinates. All positions quoted in this paper are corrected to daophot values (version 1.1.7b) (Dolphin 2000b). The mean of the four measurements was adopted as the SN position, SN(x,y)post = (416.08, 448.54) 0.05 PC pixels (2.5 mas), estimated from the range of the four measurements. This uncertainty is consistent with the limiting astrometric uncertainty of HSTphot (Dolphin 2000b).
In order to map this SN position to the pre-explosion frame using our geomap transformations, we first had to correct for geometric distortion. This was performed, as for the alignment point sources, using the distortion corrections detailed in Anderson & King (2003) and Kozhurina-Platais et al. (2003) appropriate for the PC chip and the F814W filter. The distortion corrected position was calculated as SN(xo,yo)post = (416.13, 448.68).
This was subsequently transformed to the pre-explosion coordinate system using the 49 point source transformation, yielding a (distortion corrected) progenitor position of SN(xo,yo)pre = (410.25, 159.21) on WF2, with a total uncertainty of 0.20 WF pixels (20 mas). The transformation rms (20 mas) completely dominates over the contributions from the distortion correction (1 mas) (Anderson & King 2003) and the SN position measurement (2.5 mas). (We also applied the 24 and 25 source transformations to the SN position, finding transformed coordinates within 0.01 WF pix (1 mas) of our value of SN(xo,yo)pre above.)
To compare our pre-explosion SN site position with that of Li07, we had to apply a geometric distortion correction (WF2, F814W correction from Kozhurina-Platais et al. 2003) to the Li07 position, which was quoted for the distorted coordinate frame. The original Li07 SN site position (Li(x,y)pre = (410.61, 158.81) 0.45 WF pixels) becomes Li(xo,yo)pre = (410.62, 158.56). Comparing with our value of SN(xo,yo)pre = (410.25, 159.21) we find an offset of 0.750.49 WF pixels (7549 mas).
We remind the reader that the follow-up HST observations of SN 2006my were not available to Li07 at the time of their analysis, necessitating the use of ground-based CFHT data to perform the image alignment. The vast difference in resolution between HST and ground-based data makes it more difficult to identify common, isolated point sources that can be reliably used to align the images. This explains the larger Li07 transformation rms and the offset between our transformed positions. We therefore favour transformations performed using the HST follow-up data as being more accurate, both those presented in this paper and by Leonard et al. (2008). This is in keeping with the work of all groups involved in SN progenitor searches, including Li07, who aim to obtain the highest resolution follow-up data possible to perform differential astrometry for precisely the reasons we state above. We stress that, had the SN 2006my HST data been available, we are confident Li07 would have obtained a similar result.
Like Li07 we used the PSF-fitting photometry package HSTphot (version 1.1.7b) (Dolphin 2000b) to perform photometry on the pre-explosion images. This software package includes several pre-processing tasks, which mask bad pixels, cosmic rays and hot pixels; determine the sky background and create co-added images from observations with the same pointing. Data input to these pre-processing tasks must be the original fits files as received from the HST archive. In order to compare our results directly with those of Li07 we were careful to choose exactly the same options as detailed in their paper. During pre-processing we co-added the cosmic-ray split frames in each filter. When running HSTphot we chose Option 10, which turned on local sky determination and turned off aperture corrections since there were no good aperture stars. In such cases HSTphot applies default filter-dependent aperture corrections. We also matched our signal-to-noise (S/N) thresholds to those of Li07 - detection S/N threshold = 2.5; final photometry S/N threshold = 3.0.
Li07 detect a source of 5.6 significance in F814W with a magnitude of =, and nothing in the F555W frame. We too find a source in F814W, with exactly the same magnitude and S/N ratio, which is indeed very close to our transformed SN position but is not coincident within the astrometric errors. (A source is also detected in F555W but is classified by HSTphot as having a flat, extended profile and is therefore rejected from the stellar photometry list). Having identified the source in F814W, we measured its position using the three centring algorithms555Note that the centring box used for the daophot centroiding task was 5 pixels wide, and hence the measured source position was not erroneously shifted towards the bright pixel to the south-east in Fig. 2 within daophot (see above) and used these values along with the HSTphot measurement to calculate an average pixel position: Object(x,y) = (410.40, 158.70) 0.21 WF pixels (21 mas) estimated from the range of the four measurements. Correcting for geometric distortion (Kozhurina-Platais et al. 2003; Anderson & King 2003) we found Object(xo,yo) = (410.23, 158.46).
Comparing with our transformed SN position, SN(xo,yo)pre = (410.25, 159.21) 0.20 WF pixels, we find a separation of 0.750.29 WF pixels (7529 mas)(see Figure 2). This displacement suggests that the pre-explosion source and the SN are not coincident.
We note that the original Li07 transformation, calculated using CFHT observations of SN 2006my, did produce a SN position that was coincident with this source within the (larger) astrometric uncertainties. Their identification of this source as a progenitor candidate was therefore perfectly valid at the time. For the reasons stated previously, we favour the differential astrometry performed using the follow-up HST data as being more accurate. We therefore suggest that the Li07 candidate is most probably not the progenitor of SN 2006my given the displacement we find between the SN site and the candidate source. This agrees with the findings of Leonard et al. (2008). However, the ultimate test will be to re-image the explosion site after SN 2006my has faded to find out if the Li07 candidate, or indeed any other object, has disappeared (similar to the analysis of the SN 2003gd progenitor carried out by Maund & Smartt 2009).
2.2 Progenitor luminosity and mass limits
Since we conclude that the progenitor of SN 2006my is most probably not detected in the pre-explosion observations, we must derive detection limits for these data in order to set luminosity and mass limits on the unseen stellar pre-cursor (see, for example, Maund & Smartt 2005). The signal-to-noise ratio, S/N, of a star imaged with a CCD is given by the equation
| (1) |
where is the flux of the star in units of electron counts, , and is the noise contribution from all other background sources other than the photon noise from the star itself ( ). Here we define as
| (2) |
where and are the number of pixels in the aperture and sky annulus respectively, is the detector readout noise in , and is the mean flux of the sky background per pixel, also in . The term accounts for the noise incurred due to any error in the estimation of the sky background, . This effect is mitigated by using large numbers of sky pixels to estimate the mean sky value. Rearranging eqn. 1 and solving the resultant quadratic gives
| (3) |
Taking values for all the input variables from the observations, we can use eqn. 3 to calculate the value of required to produce a detection of a desired S/N ratio. An apparent magnitude limit can then be calculated as
| (4) |
where , , , and are the detector gain, exposure time, zeropoint, aperture correction and charge transfer efficiency correction respectively. The updated WFPC2 Vegamag zeropoints of Dolphin (2000a) are taken from Andrew Dolphin’s website666http://purcell.as.arizona.edu/wfpc2_calib. These are defined as the magnitude of a source producing a count rate of 1 Data Number per second (1 ), which is why we covert our flux to such units in Equation 4. Aperture corrections are determined from the tabulated encircled energy curves of Holtzman et al. (1995) and CTE corrections (Dolphin 2000a) calculated using the latest equations from Andrew Dolphin’s website3.
Using an aperture of 2 pixels radius and a sky annulus of inner radius 10 pixels and width of 5 pixels (all WF pixels), we calculated a 3 detection limit for the progenitor of SN 2006my in the pre-explosion image: = 24.8. That we define a detection limit only in is due to the fact that we did not detect the SN progenitor. It is obviously impossible to obtain any colour constraints from a non-detection, and hence we must assume a spectral type in order to set luminosity and mass limits. In the case of a type II-P SN, such as SN 2006my (Li07; Maguire et al. 2010), we expect the progenitor to have been a red supergiant star. SNe II-P require progenitors of large radii of the order 400-1000R⊙ (Chevalier 1976; Arnett 1980), which are typical for red supergiant stars. Of our pre-explosion observations the data provides by far the most restrictive limits on such a red object.
The apparent detection limit was converted to a bolometric magnitude using estimates of the distance and extinction towards the progenitor star, and bolometric and colour corrections appropriate for a red supergiant. Solanes et al. (2002) have collected distance estimates for NGC4651 from seven different sources, deriving a mean distance of d = 22.3 Mpc (distance modulus ) and we adopt this value here. Li07 found no evidence for any host-galaxy extinction in spectra of SN 2006my and hence, like them, we apply only a correction for the Galactic extinction of assuming the reddening laws of Cardelli et al. (1989). Bolometric and colour corrections for an M0 supergiant were taken from Drilling & Landolt (2000) with a further correction between the and Cousins filters from Maund & Smartt (2005). An uncertainty of was assumed for the bolometric correction, estimated from the range of values for red supergiants of late K to late M-type (Levesque et al. 2005). The bolometric magnitude limit was found to be , which corresponds to a luminosity limit of . Assuming the errors in the distance, extinction and bolometric correction are Gaussian in nature, one can set an 84 per cent confidence limit for the progenitor luminosity of .
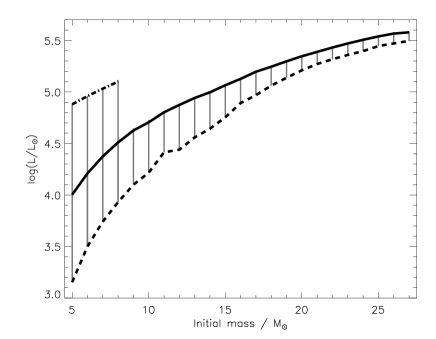
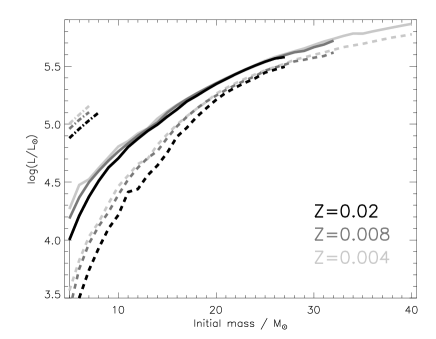
Comparing this limit with the final luminosities of Cambridge stars stellar evolutionary models Eldridge & Tout (2004) shown in Figure 3 we can estimate an upper mass limit for the progenitor star. A detailed discussion of all aspects of our methodology, including its merits over comparing progenitor photometry with the closest stellar model tracks on an HR diagram, is provided in Smartt et al. (2009). Since metallicity affects the final luminosity of a star of given initial mass (see Figure 3b) we attempted to constrain the metallicity at the position of SN 2006my. The de-projected galactocentric radius777 is the radius of a galaxy at which the surface brightness drops to 25 mag per square arcsec of SN 2006my was found to be ; almost exactly the radius of the characteristic oxygen abundance measured in NGC4651 by Pilyugin et al. (2004). They measure a value of log (O/H) + 12 = 8.7 dex at this position, which is consistent with solar metallicity (Asplund et al. 2004, 8.660.05). We note that Li07 find an oxygen abundance of 8.5 dex and correctly interpret this as subsolar compared to the solar value of 8.8 dex from Grevesse & Sauval (1998). With respect to the latest oxygen abundance estimates (Asplund et al. 2004, 8.660.05) we interpret the Li07 measurement as being between our solar and LMC metallicity values. From the LMC and solar metallicity models in Figure 3 we derive upper initial mass limits for the progenitor of SN 2006my of 11-13M⊙.
3 The progenitor of SN 2006ov
Li07 also reported the detection of a candidate red supergiant progenitor of main-sequence mass M⊙ for SN 2006ov in archival WFPC2 observations of M61. In this case they aligned the pre-explosion frames with HST observations of the SN. Having performed PSF-fitting photometry using HSTphot (Dolphin 2000b) without detecting a progenitor star, Li07 noticed that a source was still visible in the residual images close to the SN site. They conclude that this residual object is coincident with the SN position, and report that by forcing HSTphot to fit a PSF at the SN position they detect an object of 6.1 significance in the F814W and F450W observations.
| Date | Telescope+Instrument | Filter | Exp. Time |
| (s) | |||
| Pre-explosion images | |||
| 2001 Jul 26 | HST+WFPC2 | F450W | 460 |
| 1994 Jun 06 | HST+WFPC2 | F606W | 160 |
| 2001 Jul 26 | HST+WFPC2 | F814W | 460 |
| Post-explosion images | |||
| 2006 Dec 12 | HST+ACS/HRC | F435W | 420 |
| 2006 Dec 12 | HST+ACS/HRC | F625W | 180 |
3.1 Astrometry and Photometry
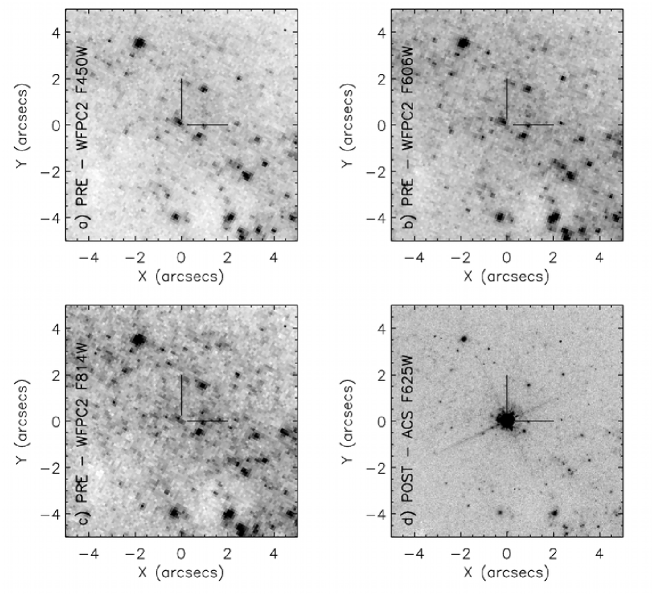
We have analysed the same HST data-sets as detailed in Li07 and in Table 3 of this paper. The pre-explosion WFPC2 data consisted of F450W and F814W images from program GO-9042 (PI: Smartt) and F606W exposures from program GO-5446 (PI: Illingworth). The SN observations were taken with the Advanced Camera for Surveys (ACS) High Resolution Channel (HRC) (pixel scale = 0.025) as part of program GO-10877 (PI: Li). All data were downloaded from the HST archive at STScI via the OTFR pipeline, and the WFPC2 images further reduced using standard tasks within iraf (see 2.1). While the OTFR pipeline automatically corrected the ACS/HRC data for geometric distortion, the above reduction did not correct the WFPC2 data. Our data reduction was therefore entirely consistent with that of Li07, except in the case of the WFPC2 F606W pre-explosion observations. On inspection of this data-set we noticed that the pointings of the cosmic-ray (CR) split exposures were offset. With respect to the coordinate frame of the WF4 chip (on which the SN site was imaged), these offsets (exposure 1 minus exposure 2) were measured to be x = -0.12 pix and y = 1.16 pix. The CR-split frames were first aligned, using exposure 1 as the reference frame, and then combined to produce the final reduced image (see Figure 4). The “clipped” nature of objects along the y-axis of the co-added F606W image in Li07 (see Fig. 8 in Li07), suggests that these offsets were missed. Li07 also used the HSTphot task coadd to combine the CR-split exposures before running the photometry package. This task cannot apply image offsets and will therefore have produced a similarly clipped image. Finally, the coordinate transformation we derive for this pre-explosion image results in a progenitor position that is offset in the y-direction from that of Li07 (see below). This is easily explained as a consequence of the differences in our respective reductions of the data.
We have repeated the alignment of the pre- and post-explosion HST observations originally performed by Li07, except that here, as in 2.1, we have applied the geometric distortion corrections of Anderson & King (2003) and Kozhurina-Platais et al. (2003) to the WFPC2 coordinates prior to calculating the transformation.
In all of the pre-explosion observations the SN site was imaged on the WF4 chip of the WFPC2 mosaic. The and WFPC2 observations were found to be well registered and hence a single transformation was deemed appropriate for both. The positions of 31 sources common to both the pre-explosion and the post-explosion images were measured, corrected for distortion, and subsequently used to calculate a transformation (x and y shifts, scales and rotations) between the pre- and post-coordinate frames. This transformation had an rms error of 0.15 WF pixels (15 mas). A separate transformation between the pre-explosion image888We assume a distortion correction appropriate for the image (Anderson & King 2003) and the post-explosion frame was calculated from the positions of 31 common objects, with a total rms error of 0.15 WF pixels (15 mas).
We tested the robustness of the transformation rms values using the same method as employed in 2.1. The results of these tests are shown in Table 4. The residuals calculated from the fit-independent coordinates were only slightly larger than the geomap residuals, suggesting that there was negligible over-fitting by the geomap task, and that distortion corrections had been successful. Nevertheless, we adopted the slightly larger 0.17 WF pixels (17 mas) and 0.16 WF pixels (16 mas) as conservative, total rms errors for the WFPC2 F814W and WFPC2 F606W transformations respectively.
| ACS/HRC F625W to WFPC2 F814W | ||
| 31 source transform | 16 source tranform | 15 source transform |
| = 0.081 | = 0.077 | = 0.085 |
| = 0.122 | = 0.125 | = 0.106 |
| = 0.146 | = 0.147 | = 0.136 |
| (residuals estimated from transformed positions | ||
| of fit-independent source coordinates) | ||
| = 0.087 | = 0.079 | |
| = 0.137 | = 0.145 | |
| = 0.162 | = 0.165 | |
| ACS/HRC F625W to WFPC2 F606W | ||
| 31 source transform | 16 source tranform | 15 source transform |
| = 0.095 | = 0.076 | = 0.107 |
| = 0.114 | = 0.125 | = 0.100 |
| = 0.148 | = 0.146 | = 0.146 |
| (residuals estimated from transformed positions | ||
| of fit-independent source coordinates) | ||
| = 0.122 | = 0.091 | |
| = 0.107 | = 0.129 | |
| = 0.162 | = 0.158 | |
| All values are in units of WF chip pixels (0.1 / pix) | ||
The position of SN 2006ov in the post-explosion ACS/HRC F625W image was measured using the three centring algorithms within daophot and the PSF-fitting photometry package DOLPHOT.999http://purcell.as.arizona.edu/dolphot/,101010Positions measured by DOLPHOT differ from those of daophot by -0.5 in both x and y coordinates. All positions quoted in this paper are corrected to daophot values. The mean of the four measurements was adopted as the SN position, SN(xo,yo)post = (598.61, 613.89) 0.12 ACS/HRC pixels (3 mas), estimated from the range of the four measurements. We again note that the ACS image was corrected for geometric distortion during pipeline reduction, hence no further correction was required.
| Pre-explosion | Li07 position | Li07 position | Crockett et al. position |
|---|---|---|---|
| image | (distortion corrected) | (distortion corrected) | |
| F450W/F814W | (571.62, 236.22) 0.17 | (571.76, 236.09) 0.17 | (571.69, 236.19) 0.17 |
| F606W | (227.44, 267.34) 0.16 | (227.64, 267.44) 0.16 | (227.81, 268.01) 0.16 |
| Coordinates are for WF4 chip (0.1 / pix), while uncertainties are total values (x and y errors combined) | |||
Applying the 31 source ACS-to-WFPC2 F814W transformation, we found a distortion corrected position for SN 2006ov on the pre-explosion and images of SN(xo,yo) = (571.69, 236.19) 0.17 WF pixels (17 mas). This can be considered coincident with the transformed SN position from Li07, being offset by just 0.120.24 WF pixels after correcting the Li07 coordinates for geometric distortion (see Table 5).
However, this is not the case for the pre-explosion image. Applying the 31 source ACS-to-WFPC2 F606W transformation, we found the transformed distortion corrected SN position to be SN(xo,yo) = (227.81, 268.01) 0.16 WF pixels (16 mas), which is offset by 0.59 WF pixels from the distortion corrected Li07 position (see Table 5). This difference is due to the shift between the F606W CR-split images that was missed by Li07 during data reduction. We therefore adopt our F606W transformation as the most reliable.
HSTphot was used to perform PSF-fitting photometry on the WFPC2 images. HSTphot and all pre-processing steps were run in precisely the same manner as in Li07 (see 2.1), except in the case of the data where the offset between the CR-split exposures required special treatment. Here the exposures were not co-added; rather they were input separately to HSTphot along with appropriate offsets, using the first exposure as the reference frame. HSTphot returned no objects coincident with the SN position in any of the pre-explosion frames, but a point-like source was discovered close to the SN site in the residual image. Given that we have used identical HSTphot settings, we assume that this is the same residual as observed by Li07, which they subsequently identified as a candidate progenitor for SN 2006ov. We, however, cannot conclude that this source is definitely coincident with the SN position.
 |
 |
 |
 |
 |
 |
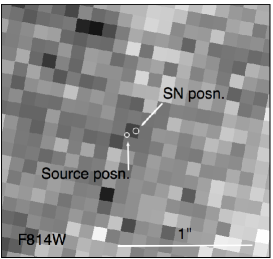
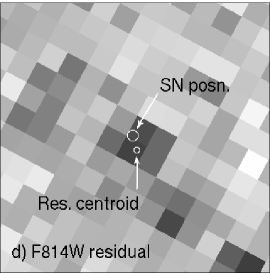
Figure 5 shows magnified sections of the WFPC2 pre-explosion frames along with the corresponding HSTphot residual images. All are centred on the transformed SN position, marked by a circle which represents the 1 astrometric uncertainty.
The point-like residual can be seen close to the centre of Figure 5d. We measured its position to be Res(x,y)F814W = (571.16, 235.80) 0.12 WF pixels, which is marked in Figure 5d by the smaller of the two circles just south of the SN position. Note that this is the raw position of the residual source, not corrected for geometric distortion. These coordinates can therefore be compared directly with those quoted in Li07. Comparing our residual position to the Li07 transformed SN position, we found that the two are separated by 0.620.21 WF pixels. Correcting the residual position for distortion, Res(xo,yo)F814W = (571.30, 235.67), and comparing with our own transformed SN position (Table 5) we found the same offset of 0.620.21 WF pixels.
The residual source (Figure 5e) is neither point-like, nor as significant as that in . If it is a real source, its extended nature would suggest that it is not a single object. Nonetheless we have attempted to determine its centroid, Res(x,y)F450W = (571.17, 235.55) 0.13 WF pixels, which is marked on Figure 5e and lies 0.810.21 pixels from the Li07 transformed SN position. Again, correcting the residual position for geometric distortion, Res(xo,yo)F450W = (570.86, 235.91), and comparing with our transformed SN position we found an offset of 0.88 0.21 WF pixels.
The shallower observation (Figures 5c&f) shows no apparent residual at, or near, the SN site.
Li07 report that by forcing HSTphot to fit a PSF at their transformed SN position they detect a source of 6.1 significance in and , and 2.2 in F606W. We performed the same forced-fitting, being careful to convert all daophot positions to HSTphot coordinates by subtracting 0.5 pixels from the x and y values. We were unable to reproduce their photometry at the transformed SN site, finding detections of 3.6 and 2.9 significance in and respectively, and nothing in .
Detections of the highest significance ( = 24.160.24 (4.5); = 23.360.18 (6.0)) were found when forcing PSF fitting at our Residual source positions, which are offset from the transformed SN position. Admittedly, it is difficult to judge by eye which of the two circles, the SN position or the Residual centroid, is closer to the true centre of the residual source in the panels of Figure 5. However, since our best-fit photometry arises when fitting at the measured Residual coordinates, we favour this as its true position.
Since we cannot reproduce the photometry of Li07 at the transformed SN site, and have found that the residual source is offset from the SN position, we suggest that this object is probably not the progenitor star. Given its proximity to the SN site, it is likely that some of the pre-explosion source flux in contributed by the progenitor. However, the evidence shown here suggests that it would be wrong to attribute all of this flux to the progenitor. As the residual itself is close to the noise limit in both and , we suggest that the progenitor of SN 2006ov is not observed. The ultimate test will be to re-image the explosion site with HST after SN 2006ov has faded to find out if the Li07 candidate, or indeed any other object, has disappeared.
3.2 Progenitor luminosity and mass limits
Luminosity and mass limits were set for the assumed red supergiant progenitor following the method described in 2.2. The sky background at the SN site was estimated and equations 2, 3 & 4 used to calculate the 3 limiting magnitude of = 24.2.
Estimates of the distance, extinction and bolometric and colour corrections were applied to convert this detection limit to a bolometric magnitude. Li07 calculated a mean distance modulus for M61 of ( Mpc) from two Tully-Fisher distance estimates (Tully 1988; Schoeniger & Sofue 1997). They also found no evidence for any host-galaxy extinction in spectra of SN 2006ov, applying only a small correction of for Galactic extinction. We adopt both these values here, and make the same assumptions for the bolometric and colour corrections as we have done in 2.2. In this way we derived a bolometric magnitude limit of , corresponding to a luminosity limit of . Assuming the errors are Gaussian, an upper luminosity limit of 84 per cent confidence can be set of .
The oxygen abundance gradient of M61 was re-defined by Pilyugin et al. (2004) and we use this, along with the galactocentric radius , to estimate an oxygen abundance of 8.9 dex at the position of SN 2006ov. Hence, we compare the above luminosity limit with stars models of solar metallicity in Figure 3, finding an upper initial mass limit for the SN progenitor of 10M⊙.
4 The progenitor of SN 2004et
A candidate progenitor star for the type II-P SN 2004et was identified by Li05 on archival images from the Canada France Hawaii Telescope (CFHT). These included CFH12K images from 2002 and u’g’r’ MegaCam observations from 2003. The pre-explosion images were aligned with SN observations from the Katzman Automatic Imaging Telescope (KAIT), yielding a transformation between the pre- and post-explosion coordinate systems with a rms error of . The candidate progenitor was found to be coincident with the SN position to within these astrometric errors. Through comparision with stellar evolutionary models Li05 characterised this source as a single, yellow supergiant star with an initial main sequence mass of 15M⊙. Both the mass and the colour of this candidate progenitor were of note; the mass since it was the largest detected for a normal II-P SN, and the colour since such progenitors were expected to be red not yellow supergiants.
To more accurately determine the position of SN 2004et on the pre-explosion frames Li et al. (2005b) aligned the CFHT data with HST ACS/HRC observations of the SN. They reported that the transformed position of the SN was “consistent with the progenitor in the CFHT image to within ” and that this confirmed their identification of the progenitor star.
We have since obtained deep follow-up observations of the site of SN 2004et from the William Herschel Telescope (WHT), the HST and the Gemini (North) observatory, which show that the Li05 candidate progenitor is still visible approximately 3 years post-explosion, and that it is in fact resolved into at least 3 separate sources. We also present hitherto unpublished pre-explosion -band observations of the SN site, taken at the Isaac Newton Telescope (INT), in which we detect an excess flux that we attribute to the unresolved progenitor of SN 2004et.
4.1 Data acquisition and reduction
| Date | Telescope+Instrument | Filter | Exp. Time |
| (s) | |||
| Pre-explosion images | |||
| 2002 Aug 06 | CFHT+CFH12K | B | 450 |
| 2002 Aug 06 | CFHT+CFH12K | V | 300 |
| 2000 Sep 27 | CFHT+CFH12K | R | 360 |
| 2002 Aug 12 | INT+WFC | i’ | 3600 |
| Post-explosion images showing bright SN | |||
| 2005 May 02 | HST+ACS/HRC | F625W | 360 |
| Late-time post-explosion images | |||
| 2007 Aug 12 | WHT+AUX | B | 2400 |
| 2007 Aug 12 | WHT+AUX | V | 1800 |
| 2007 Aug 12 | WHT+AUX | R | 1800 |
| 2007 Aug 12 | WHT+AUX | I | 2400 |
| 2007 Jul 08 | HST+WFPC2 | F606W | 1600 |
| 2007 Jul 08 | HST+WFPC2 | F814W | 1600 |
| 2007 Jul 08 | HST+NICMOS | F110W | 640 |
| 2007 Jul 08 | HST+NICMOS | F160W | 512 |
| 2007 Jul 08 | HST+NICMOS | F205W | 576 |
| 2008 Jan 19 | HST+WFPC2 | F606W | 1600 |
| 2008 Jan 19 | HST+WFPC2 | F814W | 1600 |
| 2008 Jan 19 | HST+NCMOS | F110W | 640 |
| 2008 Jan 19 | HST+NICMOS | F160W | 512 |
| 2008 Jan 19 | HST+NICMOS | F205W | 576 |
| 2008 Jul 10 | Gemini-N+Altair/NIRI | K | 7200 |
The pre- and post-explosion observations for SN 2004et are detailed in Table 6. The Canada France Hawaii Telescope (CFHT) datasets were downloaded from the CFHT archive at the Canadian Astronomy Data Centre (CADC)111111http://www4.cadc-ccda.hia-iha.nrc-cnrc.gc.ca/cadc along with appropriate flat field and bias frames. The & data were the same as those analysed by Li05. However, the -band image was different. Taken in 2000, the total exposure time of 360 sec is only slightly longer than that of the 2002 -band image (300 sec) analysed by Li05, but the image quality is (compared to ) and the SN site happened to fall on one of the high resistivity (HiRho) bulk silicon chips of the CFH12K mosaic. The sensitivity of these chips in the -band is on average 15 percent higher than the standard epitaxial silicon (EPI) chips that make up the rest of the mosaic, and on which the observations from Li05 were taken. The net result is a deeper pre-explosion image than has yet been published. All CFHT data were reduced using standard tasks within iraf. In addition we discovered a deep INT+WFC i’-band observation from 2002, not analysed by Li05, which extended the pre-explosion SED to longer wavelengths. The INT data were downloaded from the CASU INT Wide Field Survey (WFS) 121212http://www.ast.cam.ac.uk/ wfcsur, having been processed and calibrated via the INT WFC pipeline. The HST Advanced Camera for Surveys/High Resolution Channel (ACS/HRC) observation of SN 2004et from 2005 was retrieved from the HST archive at STScI via the OTFR pipeline. The pipeline Multidrizzle task combined the sub-exposures and corrected the resultant image for geometric distortion.
We re-observed the field of SN 2004et using the Auxilary Port Imager (AUX) on the WHT in Aug 2007, 3 yrs post-explosion. By this late-epoch we judged the SN would have faded sufficiently to allow us to check whether or not the Li05 candidate progenitor had disappeared; a key test of its validity. The observations were taken in filters to match as closely as possible the pre-explosion CFHT and INT images. All WHT data were reduced using standard tasks within iraf.
In an attempt to resolve the explosion site at late-time, after the SN had faded, ground-based adaptive optics (AO) observations of the field of SN 2004et were taken on 2008 July 10 ( 4 yrs post-explosion) using Altair/NIRI on the 8.1-m Gemini (North) Telescope (programs GN-2008A-Q-28, PI: Crockett and GN-2008A-Q-26, PI:Gal-Yam). It was only afterwards that the authors discovered proprietary HST WFPC2 and NICMOS data, taken 2007 July 8, had become public 2 days earlier. Further HST data, taken 2008 Jan 19, became public in Jan 2009.
The Gemini observations were taken using a nearby 2MASS source (2MASS 20352132+6007102) as the natural guide star (NGS) for the Altair AO wave front sensor. This guide star was separated by around 30 from the SN position. Due to the geometry of the detector and wavefront sensors, the maximum displacement of a guide star from the centre of the FOV is 25. The site of SN 2004et was therefore imaged off-centre using the f/14 camera, which has a FOV of 51 (pixel scale of 0.05). The effects of anisoplanatism, which would seriously reduce the image quality at such large separations from the guide star, were mitigated by inclusion of the field lens in the optical path. A series of short exposures totalling 7200 sec on-source were taken in the -band and subsequently reduced, sky subtracted and combined using the NIRI reduction tools within the iraf gemini package. The quality of the reduced image at our target position was 0.15; excellent given the large displacement from the AO guide star and that the guide star itself was relatively faint for its purpose.
The HST WFPC2 and NICMOS observations were carried out as part of program GO-11229 (PI: Meixner). All data were downloaded from the STScI archive via the OTFR pipeline. WFPC2 observations were taken in F606W and F814W filters, in each case as a series of 4400 sec exposures. NICMOS F110W, F160W and F205W data were taken as 5128 sec, 4128 sec and 4144 sec exposures respectively. Both the WFPC2 and NICMOS sub-exposures were dithered, and we used the drizzle technique (Fruchter & Hook 2002) to combine the sub-exposures in each filter. This reduction process also corrected the WFPC2 and NICMOS images for geometric distortion. The SN site was imaged on the PC chip of the WFPC2 instrument (drizzled pixel scale = 0.0455) and on the NIC2 camera of NICMOS (drizzled pixel scale = 0.075).
In the following subsections we discuss first our natural-seeing, ground-based observations, following by the HST and Gemini images, before drawing final conclusions from the combined data set.
4.2 Ground-based, seeing-limited data: image alignment and photometry
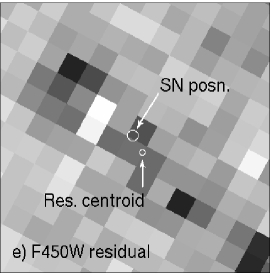
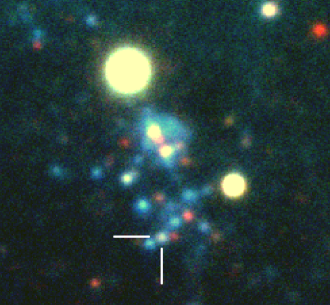
In Figure 6 we show the CFHT+CFH12K images, as presented by Li05; the previously unpublished CFHT+CFH12K observation from 2000; and the deep INT+WFC i’-band observation from 2002, also previously unpublished. In the same figure we present our late time WHT+AUX observations, with the images combined in Figure 7 to create a pseudo-colour image. It is immediately apparent that an object is still visible at the position of the Li05 candidate progenitor in all bands. Alignment of the CFHT and WHT -band images demonstrated that the pre- and post-explosion sources are coincident, having a measured separation of mas.
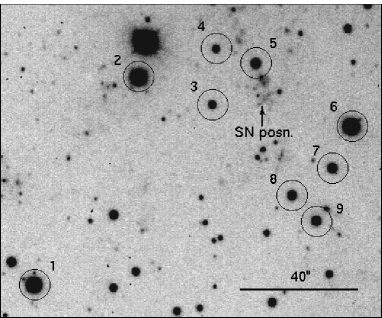
PSF-fitting photometry of the Li05 candidate progenitor source was carried out on both the archival and late-time observations using tasks within the iraf daophot package. Although photometry for the CFH12K images was presented by Li05, it was decided to repeat this analysis so as to obtain measurements in a consistent fashion across all our pre- and post-SN observations. Zeropoints and colour corrections were derived using stars in the field with calibrated magnitudes taken from Li05 and Misra et al. (2007) (see Figure 8 and Table 7). The INT+WFC i’-band observation was an exception, the zeropoint being taken from the image header (calculated during the WFS calibration process) and colour transformations to the Landolt system from the INT Wide Field Survey (WFS) website131313http://www.ast.cam.ac.uk/ wfcsur/technical/photom/colours/. A series of Landolt standard stars were observed every night during the INT WFS, and secondary standards were also established in each field. The photometric calibration of the WFS data is therefore very reliable. Nevertheless we have checked this calibration using the secondary standards from Li05 and Misra et al. (2007) presented in Table 7, and found that the results are consistent. Several of the isolated standard stars (Figure 8) were used to build emperical PSFs for each image. Sources close to Li05 candidate progenitor were fitted simultaneously, but their photometry is not detailed in this paper. Our pre- and post-explosion photometry is recorded in Table 8, along with the pre-explosion photometry of Li05.
| ID | ||||
|---|---|---|---|---|
| 1 | 15.80(0.008) | 14.73(0.010) | 14.14(0.005) | 13.47(0.023) |
| 2 | 15.51(0.008) | 14.15(0.009) | 13.41(0.004) | 12.63(0.023) |
| 3 | 19.40(0.027) | 18.48(0.015) | 17.96(0.013) | 17.31(0.053) |
| 4 | 19.44(0.040) | 18.29(0.030) | 17.60(0.020) | - |
| 5 | 18.31(0.017) | 17.10(0.012) | 16.43(0.018) | 15.69(0.026) |
| 6 | 15.56(0.008) | 14.28(0.009) | 13.63(0.004) | 12.81(0.023) |
| 7 | 18.30(0.018) | 17.46(0.013) | 17.04(0.005) | 16.39(0.030) |
| 8 | 18.43(0.018) | 17.66(0.013) | 17.28(0.043) | 16.67(0.040) |
| 9 | 18.33(0.015) | 17.39(0.011) | 16.93(0.007) | 16.25(0.028) |
4.2.1 V & R-band photometry
Comparing the pre-explosion photometry of the Li05 candidate progenitor with that of the coincident source at late-time, we find that measurements in the & bands match within the errors.
There are three possible solutions to these observations: 1) that the & flux of the pre- and post-explosion objects come from the same source or blended sources, with negligible contributions from the progenitor and SN respectively; 2) the pre-SN & flux is entirely from the progenitor star while the late-time flux is from the SN; 3) the object consists of multiple blended sources with the progenitor and SN contributing some significant fraction of the pre- and post-explosion & flux respectively.
The second scenario seems the least likely as it requires the SN to be significantly brighter than expected (predicted 26.1, and 26.2 by extrapolating the late-time light curves of Maguire et al. 2010) while at the same time coincidentally matching the magnitudes of its progenitor, and is ultimately ruled out by the HST and Gemini AO which resolves the object at the SN site into 3 distinct objects (4.3). The third scenario still requires a certain amount of fine-tuning in order to match the pre- and post-SN photometry. However, the degree of fine-tuning can be reduced if we arbitrarily assume ever increasing flux contributions from the other constituent sources, so that it becomes possible to “wash-out” differences between the progenitor and SN magnitudes. The first scenario is the simplest, and assumes that the progenitor and the SN contribute negligible -band flux to the pre- and post-explosion images respectively. However, late-time optical spectra of the SN site presented by Kotak et al. (2009), and discussed in more detail in 4.3.1, clearly show broad emission lines that can only be attributed to the SN. Hence we know that SN 2004et does contribute at least some of the flux in the late-time WHT images. These observations therefore point to the third scenario.
4.2.2 B-band photometry
In the -band observations it appears that the Li05 candidate may be brighter at late-time; = 24.020.21, = 23.620.06. If the difference is real we would assume that the SN contributes at least the excess post-explosion flux () with the remainder coming from neighbouring unresolved sources, or at most the entire post-explosion flux. We predicted the magnitude of the SN at the time of the WHT observations ( 3 yrs post-explosion) to be 24.7 from extrapolation of the SN light curve in Maguire et al. (2010). This extrapolated magnitude is in good agreement with what we measure for the post-explosion excess, suggesting that 1) the SN is still visible, at least in , and 2) the majority of the late-time flux comes from other unresolved sources that would also have been visible pre-explosion. These observations are in good agreement with what we infer from the -band photometry above.
4.2.3 I-band photometry
Photometry of the I-band observations shows that the pre-explosion source coincident with the Li05 candidate is significantly brighter than its late-time counterpart; , . Comparing this object to the surrounding stars, it is easy to see from Figure 6 that it is visibly brighter in the INT image than in the WHT frame. Such an excess in the pre-explosion image can logically be interpreted as a detection of the SN progenitor, which must have been intrinsically very red or heavily extinguished (or both) to have avoided detection in the -bands. An -band magnitude for the unresolved progenitor can be trivially calculated from the difference between the pre- and post-explosion photometry; .
We predicted the magnitude of the SN at the epoch of the WHT observations to be 24.6, by extrapolating the -band light curve of Maguire et al. (2010). If correct, the predicted photometry would suggest that the SN contributes 9 per cent of the WHT -band flux, which should be discounted when calculating the progenitor magnitude. This would result in a slightly brighter progenitor magnitude of . However, in extrapolating the SN photometry we have assumed that there was no flattening or re-brightening of these light curves due to light echoes or ejecta-CSM (circumstellar material) interaction. Kotak et al. (2009) found that, starting October 2007, SN 2004et did in fact re-brighten significantly in mid-IR Spitzer data. However, previous mid-IR observations from August 2007 (around the time of our WHT observations) had still shown a declining light curve (Kotak et al. 2009), so our assumption above may not be unreasonable. We will discuss the IR-echo in more detail in 4.3.1. Later in this paper (4.4.2) we attempt to use the late-time optical spectra of Kotak et al. (2009) to constrain the true contribution of the SN to the late-time optical photometry, and subsequently to correct the progenitor magnitudes.
| Filter | Pre-SN CFHT | Pre-SN CFHT & INT | Post-SN WHT |
|---|---|---|---|
| (Li et al. 2005) | (this work) | ||
| B | 24.30(0.48) | 24.02(0.21) | 23.62(0.06) |
| V | 22.93(0.31) | 23.04(0.27) | 23.06(0.04) |
| R | 22.50(0.18) | 22.24(0.06) | 22.27(0.05) |
| I | - | 21.27(0.08) | 21.99(0.06) |
4.3 High-resolution data: alignment and photometry
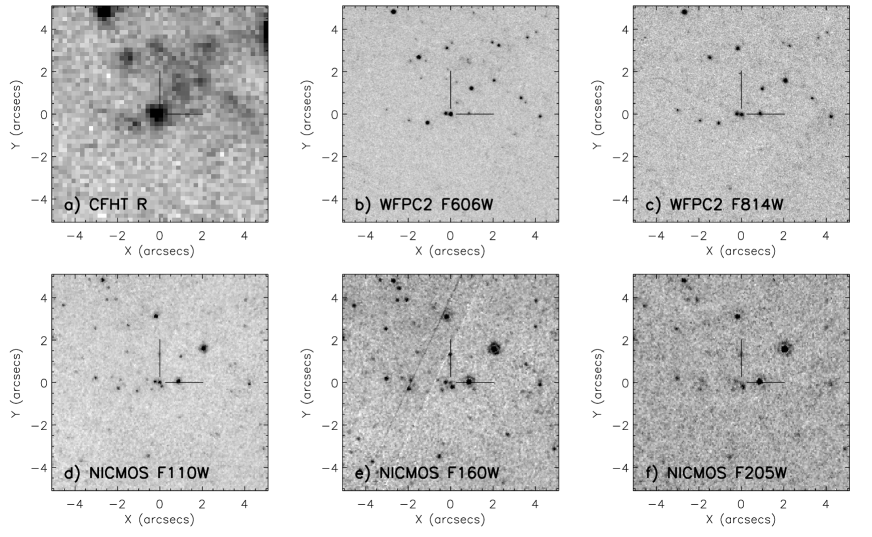
Immediately apparent from the HST and Gemini AO images is that the previously unresolved source, coincident with the Li05 candidate progenitor, in fact consists of at least three distinct sources (see Figures 9&10). This provides conclusive evidence that the Li05 candidate identified in ground-based, seeing limited observations, was not solely the progenitor of SN 2004et. What contribution the unresolved progenitor made to the pre-explosion images is the question we attempt to address in the remainder of 4.
Photometry of the WFPC2 and NICMOS datasets was carried out using PSF fitting techniques within iraf daophot. Empirical PSF models were created using several isolated stars in each image. The updated WFPC2 zeropoints of Dolphin (2000a) were taken from Andrew Dolphin’s website141414http://purcell.as.arizona.edu/wfpc2_calib, while NICMOS Vegamag zeropoints were determined using data from the STScI site151515http://www.stsci.edu/hst/nicmos/performance/photometry. Flight system magnitudes measured for the three sources clustered close to the SN site are recorded in Table 9.
| WFPC2 NICMOS | |||||
|---|---|---|---|---|---|
| Object | F606W | F814W | F110W | F160W | F205W |
| Date | |||||
| East | |||||
| 2007 Jul 08 | 23.88(0.04) | 22.98(0.05) | 22.52(0.06) | 21.67(0.05) | 21.26(0.08) |
| 2008 Jan 19 | 23.90(0.03) | 23.20(0.04) | 22.64(0.06) | 21.95(0.06) | 22.1 |
| Centre | |||||
| 2007 Jul 08 | 23.07(0.03) | 22.80(0.04) | 22.17(0.06) | 22.65(0.09) | 21.70(0.15) |
| 2008 Jan 19 | 23.29(0.03) | 23.06(0.04) | 22.42(0.06) | 22.56(0.10) | 21.22(0.09) |
| South | |||||
| 2007 Jul 08 | 26.0 | 25.33(0.14) | 22.86(0.07) | 21.22(0.04) | 20.78(0.05) |
| 2008 Jan 19 | 26.3 | 25.16(0.14) | 22.89(0.07) | 21.20(0.04) | 20.75(0.05) |
Alignment with the 2005 ACS/HRC F625W image of the SN confirmed that one of the three sources is exactly coincident with SN 2004et, having a measured separation of mas. This object is labelled “Centre” in Table 9 and is indicated by the cross hairs in Figure 9. However, with the current dataset it is impossible to determine whether object Centre is solely a detection of the SN in all filters, or whether a second unresolved source (e.g. a close companion of the former progenitor star) is now also visible.
What does appear clear is that object Centre is significantly brighter than one would expect the SN to be from simple extrapolation of the late-time light curves of Maguire et al. (2010). At the time of the 2007 July 08 HST observations, we estimated the SN to have magnitudes of 25.7 and 24.2. This compares with object Centre magnitudes of (-band = 23.18) and (-band = 22.78).161616HST photometry transformed to standard Johnson-Cousins & magnitudes using the colour transformations from http://purcell.as.arizona.edu/wfpc2_calib
However, we know from Kotak et al. (2009) that the SN re-brightened significantly in the mid-IR beginning in October 2007. Although no mid-IR re-brightening was detected earlier than this date (including observations from August 2007) we cannot completely rule out the possibility of an optical light-echo, which could significantly increase the contribution of the SN to object Centre in the HST image from 2007 July 08. It is therefore also entirely possible that object Centre is solely a detection of SN 2004et. We consider this case in 4.4.1, while in 4.4.2 we use the late-time optical spectra of the SN site from Kotak et al. (2009) to constrain the minimum contribution of the SN to the late-time optical photometry.
4.3.1 NIR re-brightening of SN 2004et and late-time optical spectra
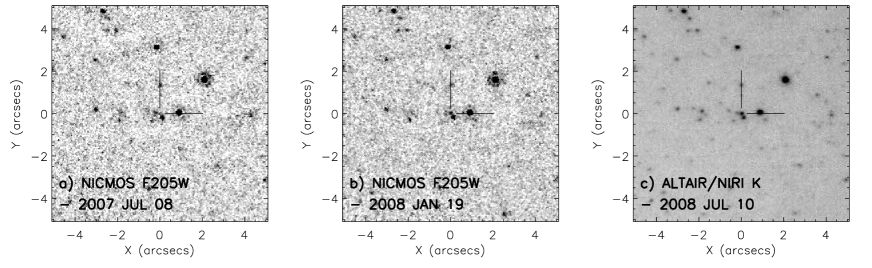
Although there is no direct evidence from the HST data for an optical light-echo associated with SN 2004et, we do observe a significant brightening of object Centre in the near-IR (NIR), both in the NICMOS F205W and Gemini Altair/NIRI -band observations from 2008 Jan 19 and 2008 Jul 10 respectively (see Figure 10). Object Centre, which is marginally detected in the F205W observation from 2007 July 08, increases in brightness by roughly 40 per cent by 2008 Jan 19. Photometry of the Gemini adaptive-optics observations was complicated by the large variation in the PSF across the FOV (due to anisoplanatic effects of the AO correction) and by having only one usable standard star (2MASS 20352132+6007102). Nevertheless, we estimated an approximate magnitude for object Centre in the 2008 July 10 Gemini image of 20.0.
We attribute the increase in object Centre’s F205W / -band flux to a re-brightening of SN 2004et in the NIR, but stress once again that we cannot be certain that object Centre consists solely of the SN. The NIR re-brightening of SN 2004et was contemporaneous with the mid-IR increase observed by Kotak et al. (2009).
Interestingly, we do not observe a brightening of object Centre in any of the other optical or NIR observations shortward of m. However, we note that the rate of decline in the optical bands between July 2007 and January 2008 is much slower than that measured by Maguire et al. (2010) for the earlier part of the radioactive tail; mag/100 days for the late-time HST photometry compared to mag/100 days from Maguire et al. Furthermore, the late-time F160W photometry show no discernible decline whatsoever. All this could be interpreted as a flattening of the SN 2004et light curves caused by the same mechanism(s) that produced the F205W / and mid-IR re-brightening. Another possible explanation is that a second unresolved source at the position of object Centre (such as a close companion star to the former SN progenitor) is beginning to dominate over the fading SN. A combination of the two effects is also possible. Future HST observations of the SN site will be required to determine which is actually the case.
Of immediate consequence for our study of the progenitor star in the optical, pre-explosion images are the late-time, optical spectroscopic observations of the site of SN 2004et presented in Kotak et al. (2009), and reproduced here (Figure 11) with the permission of the author. The three spectra, taken with the Keck Telescope, span the period between 2 to 3 yrs post-explosion, and clearly show broad emission lines that can only be attributed to the SN. The width of these lines indicate expansion velocities of , and Kotak et al. interpret this as being due to the impact of the SN ejecta on the progenitor circumstellar medium. Such interaction would have resulted in a slower rate of decline (flattening) of the optical light curves. This lends support to the first scenario in the previous paragraph, but lacking further observations we still cannot rule out the possibility of a second unresolved source at the SN position.
The Keck spectra are certainly contaminated by flux from other resolved sources close to the SN site. The spectra were reportedly taken under relatively poor conditions using a slit width of around 1.5 (R. Kotak, private communication). A glance at Figure 9 of this paper shows that, depending on the slit orientation, several objects could have contributed significant flux, not least the object immediately to the east of the SN position. It is therefore impossible to determine the total flux contribution made by SN 2004et to the late-time optical spectra / photometry.
4.4 Progenitor luminosity and mass estimates
In this section we attempt to derive luminosity and mass estimates for the progenitor of SN 2004et. In 4.2.3 we detected an unresolved progenitor star as an -band flux excess in pre-explosion INT observations, when these were compared with WHT images taken 3 yrs post-explosion. The optical spectra of Kotak et al. (2009) (Fig. 11) show that the SN was still visible at this late-epoch, and hence we must correct for its contribution to the late-time optical photometry before calculating the magnitude of the unresolved progenitor star.
As discussed above, determination of the total flux contribution of the SN to the late-time photometry is impossible. The Keck spectra are contaminated by nearby, resolved sources, while object Centre in the HST observations may consist of more than just SN 2004et. We can, however, estimate the maximum and minimum contributions of the SN from the HST photometry and the Keck spectra. These two extremes are considered separately in the following subsections, where we also determine corresponding values for the progenitor photometry, luminosity and mass.
We also note that there is some evidence from the photometry in Table 9 to suggest that object East may be variable. This adds an unknown systematic uncertainty to our calculations in the following subsections. Further HST observations of the SN site will be required to determine if object East is truly variable.
To calculate the progenitor luminosity, and ultimately estimate its mass from stellar models, we require the distance to the host galaxy, the extinction along the line of sight and the (approximate) metallicity of the progenitor star. Botticella et al. (2009) present a review of the distance estimates to NGC 6946 in the literature, and employ the unweighted mean as their preferred value; = 28.780.08 (d = 5.70.2 Mpc). We adopt the same value in this paper.
The extinction of E = was estimated by Zwitter et al. (2004) from the equivalent width of the Na i D lines in a high resolution spectrum of SN 2004et, and using the calibration of Munari & Zwitter (1997). The reddening uncertainty was chosen by Li05 to bracket the lower limit, which assumes no host-galaxy extinction. As pointed out by Li05, the Galactic component of extinction towards SN 2004et is estimated to be E = 0.34 (Schlegel et al. 1998).
We also attempted to constrain the metallicity of the progenitor of SN 2004et from the available literature. Pilyugin et al. (2004) studied 9 H ii regions in NGC 6946, but none of these are close to the location of SN. We therefore used their calculated abundance gradient and the de-projected galactocentric radius of SN 2004et ( = 0.92) to estimate the metallicity at its position. This yielded an oxygen abundance of 12+log(O/H) = 8.3 dex, which is consistent with that of the LMC (Hunter et al. 2007).
4.4.1 Object Centre is SN 2004et
Firstly, we consider the maximum possible flux contribution of the SN to the late-time photometry. This is the case where SN 2004et is assumed to contribute all the flux of object Centre in the late-time HST images (Figure 9 & Table 9). In this scenario, the pre-explosion source (Li05 candidate) is logically assumed to consist of the other HST resolved objects (i.e. objects East and South) plus the SN progenitor. By subtracting the flux of objects East and South from the ground-based, pre-explosion photometry, we can calculate photometry for the progenitor star. To this end, the July 2007 and photometry of object East was transformed to standard Johnson-Cousins & magnitudes using the colour transformations from Andrew Dolphin’s website11. With no detection of object South in , we were unable to transform its photometry to the standard system. However, we note that, in the case of the -to- transformation, the correction is generally very small. Johnson-Cousins photometry for object East was therefore calculated as = 24.250.03 and = 22.940.04, while for object South we set = = 25.330.14.
These magnitudes and their respective errors were converted to flux units, and subtracted from the & -band photometry of the pre-explosion source (Table 8). This yielded progenitor star magnitudes of, = 23.470.40 and = 21.570.12. The apparent colour of the progenitor was therefore . Applying our best estimate of extinction (see 4.4), we calculated the progenitor’s intrinsic colour; . This colour range corresponds to supergiant stars of type F8 to K3, which are significantly hotter than the M-type red supergiant one would expect for a type II-P SN progenitor. Drilling & Landolt (2000) show that the values of + BC for such stars are quite similar, and we calculated an average of + BC = 0.750.15. Applying this to the -band detection, along with values for the extinction and distance modulus detailed above (4.4), we calculated the progenitor’s bolometric magnitude, M and its luminosity, = 4.720.09. By comparing this luminosity to the STARS stellar models of LMC metallicity in Figure 3, we estimated the progenitor initial mass to be M⊙.
4.4.2 Estimating the minimum contribution of SN 2004et from late-time optical spectra
In this section we have attempted to estimate the minimum flux contribution of the SN to the late-time photometry. In order to constrain the SN flux, we firstly utilised the stsdas synphot package to measure the SN emission line fluxes in the late-time optical spectra from Kotak et al. (2009). By interpolating the measurements from the 2007 April 13 and 2007 November 12 spectra we derived emission line magnitudes that were contemporaneous with our 2007 August 12 WHT photometry, assuming an exponential decay in flux. The reader should note that these ground-based spectroscopic observations were made under natural seeing conditions, and hence the continuum flux contains contributions from at least three different sources, that is those resolved in the HST and Gemini AO observations.
Magnitudes were first of all measured from the flux-calibrated spectra as presented in Kotak et al. (2009) (Figure 11), but the interpolated results, = 22.22 and = 21.59, were found to be significantly brighter than our WHT photometry (see Table 8). and were brighter by factors of 2.2 and 1.9 respectively. Since we do not know the exact conditions under which the spectra were taken, such as seeing and slit orientation, we cannot easily quantify the contamination due to other nearby resolved sources (see Figure 6). In the -band, at least, the blended source closest to the SN site is much brighter than any of the nearby objects. We suggest that the neighbouring resolved sources could not have resulted in the observed -band excess in the spectra, and subsequently conclude that the flux values reported by Kotak et al. (2009) are approximately a factor of 2 higher than their true values. In the analysis that follows we have re-scaled the spectra by a factor of 0.5, so as to be consistent with our WHT photometry.
In order to estimate the the emission line magnitudes, the continuum of each spectrum was fitted and removed before the synphot task calcphot was run using the Landolt & passbands. Since calcphot resets all negative fluxes to zero, positive noise spikes lead to artificial brightening of the measured magnitudes. We therefore added a constant flux offset to the continuum subtracted spectra before running calcphot, which ensured that all fluxes were greater than zero. The offset magnitudes were measured separately, and then subtracted from the combined results to find the true emission line magnitudes. Interpolation of these results yielded estimates of the emission line magnitudes on the date of the WHT observation; 2007 August 12. Following this procedure we found that the SN emission lines could account for just 5 per cent of the total flux in , but around 25 per cent of that in the -band. This is not surprising, since the filter covers the wavelength region that includes the prominent Hα and [Ca II] emission features, while the -band only grazes the Hα profile.
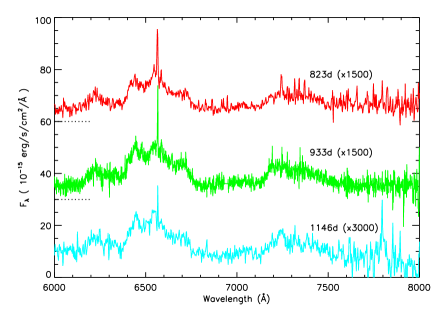
In the -band wavelength range the spectra from Kotak et al. (2009) were noisy and included prominent sky lines. However, the [Ca II] emission feature lies within the bounds of this passband. We estimated its contribution to the WHT -band observations in the same manner as described for the other filters above, except that in this case all flux values at wavelengths longer than 7600Å were set to zero in order to suppress the sky lines. The [Ca II] emission was thereby estimated to contribute around 9 per cent of the total flux in ; a lower limit to the SN emission line flux in this filter.
Of course, we expect the SN to have contributed flux to the continuum also, although the absolute level of this contribution is impossible to measure from the current dataset. By comparing the & magnitudes of the original 2007 April 13 and 2007 November 12 spectra, we found that around 14-18 per cent of the April flux is lost from the continuum by the time of the November observation. These continuum losses equate to roughly 910-4 mag d-1. Between our WHT observations on 2007 August 12, and the final spectrum on 2007 November 12, we calculate that the SN continuum would have faded by 0.08 mag in & , again assuming an exponential decay in flux. This constitutes a lower limit for the continuum contribution of the SN in the WHT observations. Later spectra may well have revealed a further decline in the continuum due to the fading SN. However, lacking such extra information, we only consider flux that can be logically attributed to the SN using the current data, and reiterate that it is a minimum value. (The reader should note that the combined emission-line plus continuum contributions derived here are in excess of the decline observed between the 2007 July and 2008 January HST optical observations. Hence, no further constraint can be gleaned from the HST data).
Our estimates of the minimum SN flux in were subtracted from the WHT post-explosion photometry of the Li05 candidate in order to calculate the contribution from the other unresolved stars. Subtracting the result from the pre-explosion photometry of Li05 candidate left us with the flux of the progenitor star itself. In this way we estimated the magnitudes of the progenitor in the pre-explosion images to be =25.13, =23.390.26 and =21.880.17. (We assume a similar continuum reduction in as we have observed in & ). Clearly, the calculated flux of is insignificant when compared to its error. Therefore, we use only and to characterise the progenitor in this case. Using the extinction quoted in 4.4, the intrinsic colour of the progenitor is calculated as . These colours correspond to supergiant stars of types K4 to M4. Again, we noted that the + BC values for these stars are quite similar, and calculated an average value of 0.890.11 from Elias et al. (1985) and Drilling & Landolt (2000). The bolometric magnitude and luminosity were calculated from to be M, and = 4.540.10. This corresponds to an initial mass for the progenitor of M⊙.
Having corrected for the emission line fluxes and minimum continuum contributions of the SN, we conclude that these results are our best estimates for the spectral type, luminosity and initial mass of the progenitor of SN 2004et. However, we stress that future high-resolution observations of the SN site using HST will be required to determine if object Centre has faded further in order to confirm or adjust these results.
5 Conclusions
| Supernova | Photometry | Distance Modulus | Extinction | Colour | Spectral Type | Luminosity | Mass |
| M⊙ | |||||||
| 2006my | 0.027 | - | M0 I (assumed) | ||||
| 2006ov | 0.022 | - | M0 I (assumed) | ||||
| 2004et (a) | = | F8 I to K3 I | |||||
| (b) | = | K4 I to M4 I | |||||
| (a) assuming SN 2004et contributes the flux of object Centre in late time HST images (4.4.1) | |||||||
| (b) SN 2004et contribution to object Centre estimated from late-time optical spectra (4.4.2) | |||||||
We have re-analysed the pre-explosion observations of the type II-P SNe 2006my, 2006ov and 2004et. In the cases of SNe 2006my and 2006ov we have argued that the published progenitor candidates (Li07) are most likely not coincident with their respective supernova sites in pre-explosion HST+WFPC2 observations. We concluded that the progenitors of SNe 2006my and 2006ov were probably not detected, and hence derived detection limits for each (see Table 10). Based on the assumption that the unseen progenitors were red supergiants, a reasonable assumption given both SNe were classified as type II-P (Chevalier 1976; Arnett 1980), we calculated upper luminosity and mass limits for the progenitors of SNe 2006my (; M⊙) and 2006ov (; M⊙). Future high-resolution observations of each SN site will be required to confirm these results.
Late-time WHT observations of the site of SN 2004et revealed that the yellow supergiant progenitor candidate, identified in pre-explosion CFHT data by Li05, was still visible some 3 years post-explosion. High-resolution, late-time Gemini AO and HST images resolve this object into at least 3 distinct sources, one of which (object Centre) is coincident with the SN. A hitherto unpublished, pre-explosion -band image from the INT was also analysed. Through comparison with the late-time WHT -band data, we discovered a pre-explosion excess of flux coincident with the Li05 progenitor candidate. We attributed this to a detection of the unresolved progenitor star.
Gemini Altair/NIRI and HST NICMOS observations revealed an apparent re-brightening of the SN in the NIR 3.5 - 4 years post-explosion. This coincides with the re-brightening observed by Kotak et al. (2009) in the mid-IR. Late-time optical spectra presented by Kotak et al. confirmed that SN 2004et was still visible in the optical at the time of our WHT photometry. Correcting for the SN contribution we found an excess of pre-explosion flux in the -band, which we again attributed to the unresolved progenitor. By combining the and -band progenitor photometry we estimated the progenitor of SN 2004et to be a K4 to M4 supergiant, of = 4.540.10, and initial mass M⊙ (see Table 10). These constitute our best estimates for the spectral type, luminosity and mass of the progenitor of SN 2004et, but we stress that future observations may show that the SN has faded still further, in which case our progenitor photometry would require revision.
Acknowledgments
We thank an anonymous referee for detailed comments and suggestions which substantially improved the paper.
This research is based in part on observations made with the NASA/ESA Hubble Space Telescope, obtained from the data archive at the Space Telescope Science Institute. Support for Program number 10803 was provided by NASA through a grant from STScI, which is operated by the Association of Universities for Research in Astronomy, Incorporated, under NASA contract NAS 5-26555.
The William Herschel Telescope and Isaac Newton Telescope are operated on the island of La Palma by the Isaac Newton Group in the Spanish Observatorio del Roque de los Muchachos of the Instituto de Astrof sica de Canarias. We thank the Service Programme and Ian Hunter for coordination of the WHT observations. The INT data, on which this research is partly based, was made publicly available through the Isaac Newton Group’s Wide Field Camera Survey Programme.
This research used the facilities of the Canadian Astronomy Data Centre operated by the National Research Council of Canada with the support of the Canadian Space Agency, and is partly based on observations obtained at the Canada-France-Hawaii Telescope (CFHT) which is operated by the National Research Council of Canada, the Institut National des Sciences de l’Univers of the Centre National de la Recherche Scientifique of France, and the University of Hawaii.
Based on observations obtained at the Gemini Observatory (acquired through the Gemini Science Archive), which is operated by the Association of Universities for Research in Astronomy, Inc., under a cooperative agreement with the NSF on behalf of the Gemini partnership: the National Science Foundation (United States), the Particle Physics and Astronomy Research Council (United Kingdom), the National Research Council (Canada), CONICYT (Chile), the Australian Research Council (Australia), CNPq (Brazil) and SECYT (Argentina).
This work conducted as part of the award “Understanding the lives of massive stars from birth to supernovae” (S. J. Smartt) made under the European Heads of Research Councils and European Science Foundation EURYI (European Young Investigator) Awards Scheme, was supported by funds from the Participating Organisations of EURYI and the EC Sixth Framework Programme. SJS and RMC thank the Leverhulme Trust and the European Science Foundation for a Philip Leverhulme Prize and postgraduate funding. S.M. acknowledges support from the Academy of Finland (project 8120503).
References
- Anderson & King (2003) Anderson, J. & King, I. R. 2003, PASP, 115, 113
- Argo et al. (2005) Argo, M. K., Beswick, R. J., Muxlow, T. W. B., et al. 2005, Memorie della Societa Astronomica Italiana, 76, 565
- Arnett (1980) Arnett, W. D. 1980, ApJ, 237, 541
- Asplund et al. (2004) Asplund, M., Grevesse, N., Sauval, A. J., Prieto, C. A., & Kiselman, D. 2004, A&A, 417, 751
- Bethe (1990) Bethe, H. A. 1990, Reviews of Modern Physics, 62, 801
- Blondin et al. (2006) Blondin, S., Modjaz, M., Kirshner, R., & Challis, P. 2006, CBET
- Botticella et al. (2009) Botticella, M. T., Pastorello, A., Smartt, S. J., et al. 2009, MNRAS, 398, 1041
- Cardelli et al. (1989) Cardelli, J. A., Clayton, G. C., & Mathis, J. S. 1989, ApJ, 345, 245
- Casertano & Wiggs (2001) Casertano, S. & Wiggs, M. 2001, WFPC2 ISR 01-10, Baltimore, STScI
- Chevalier (1976) Chevalier, R. A. 1976, ApJ, 207, 872
- Chevalier et al. (2006) Chevalier, R. A., Fransson, C., & Nymark, T. K. 2006, ApJ, 641, 1029
- Dolphin (2000a) Dolphin, A. E. 2000a, PASP, 112, 1397
- Dolphin (2000b) Dolphin, A. E. 2000b, PASP, 112, 1383
- Drilling & Landolt (2000) Drilling, J. S. & Landolt, A. U. 2000, Normal Stars (Allen’s Astrophysical Quantities), 381
- Dwek (1983) Dwek, E. 1983, ApJ, 274, 175
- Eldridge et al. (2007) Eldridge, J. J., Mattila, S., & Smartt, S. J. 2007, MNRAS: Letters, 376, L52
- Eldridge & Tout (2004) Eldridge, J. J. & Tout, C. A. 2004, MNRAS, 353, 87
- Elias et al. (1985) Elias, J. H., Frogel, J. A., & Humphreys, R. M. 1985, ApJ Supplement Series, 57, 91
- Elias-Rosa et al. (2009) Elias-Rosa, N., Van Dyk, S. D., Li, W., et al. 2009, ApJ, 706, 1174
- Elmhamdi et al. (2003) Elmhamdi, A., Danziger, I. J., Chugai, N., et al. 2003, MNRAS, 338, 939
- Filippenko (1997) Filippenko, A. V. 1997, Ann. Rev. A&A, 35, 309
- Fraser et al. (2010) Fraser, M., Takáts, K., Pastorello, A., et al. 2010, ApJL, 714, L280
- Fruchter et al. (2009) Fruchter, A., Sosey, M., Hack, W., et al. 2009, ”The Multidrizzle Handbook”, version 3, Baltimore, STScI
- Fruchter & Hook (2002) Fruchter, A. S. & Hook, R. N. 2002, PASP, 114, 144
- Gilmozzi et al. (1995) Gilmozzi, R., Ewald, S., & Kinney, E. 1995, WFPC2 ISR 95-02, Baltimore, STScI
- Grevesse & Sauval (1998) Grevesse, N. & Sauval, A. J. 1998, Space Sci. Rev., 85, 161
- Hamuy et al. (2001) Hamuy, M., Pinto, P. A., Maza, J., et al. 2001, ApJ, 558, 615
- Heger et al. (2003) Heger, A., Fryer, C. L., Woosley, S. E., Langer, N., & Hartmann, D. H. 2003, ApJ, 591, 288
- Hendry et al. (2005) Hendry, M. A., Smartt, S. J., Maund, J. R., et al. 2005, MNRAS, 359, 906
- Holtzman et al. (1995) Holtzman, J. A., Hester, J. J., Casertano, S., et al. 1995, PASP, 107, 156
- Hunter et al. (2007) Hunter, I., Dufton, P. L., Smartt, S. J., et al. 2007, A&A, 466, 277
- Kotak et al. (2009) Kotak, R., Meikle, W. P. S., Farrah, D., et al. 2009, ApJ, 704, 306
- Kozhurina-Platais et al. (2003) Kozhurina-Platais, V., Anderson, J., & Koekemoer, A. 2003, WFPC2 ISR 03-02, Baltimore, STScI
- Leonard et al. (2002) Leonard, D. C., Filippenko, A. V., Gates, E. L., et al. 2002, PASP, 114, 35
- Leonard et al. (2008) Leonard, D. C., Gal-Yam, A., Fox, D. B., et al. 2008, PASP, 120, 1259
- Levesque et al. (2005) Levesque, E. M., Massey, P., Olsen, K. A. G., et al. 2005, ApJ, 628, 973
- Levesque et al. (2006) Levesque, E. M., Massey, P., Olsen, K. A. G., et al. 2006, ApJ, 645, 1102
- Li et al. (2005a) Li, W., Dyk, S. D. V., Filippenko, A. V., & Cuillandre, J.-C. 2005a, PASP, 117, 121
- Li et al. (2006) Li, W., Dyk, S. D. V., Filippenko, A. V., et al. 2006, ApJ, 641, 1060
- Li et al. (2005b) Li, W., Filippenko, A. V., & van Dyk, S. D. 2005b, ATEL, 492, 1
- Li et al. (2007) Li, W., Wang, X., Dyk, S. D. V., et al. 2007, ApJ, 661, 1013
- Maguire et al. (2010) Maguire, K., di Carlo, E., Smartt, S. J., et al. 2010, MNRAS, 404, 981
- Martí-Vidal et al. (2007) Martí-Vidal, I., Marcaide, J. M., Alberdi, A., et al. 2007, A&A, 470, 1071
- Mattila et al. (2008) Mattila, S., Smartt, S. J., Eldridge, J. J., et al. 2008, ApJL, 688, L91
- Maund & Smartt (2005) Maund, J. R. & Smartt, S. J. 2005, MNRAS, 360, 288
- Maund & Smartt (2009) Maund, J. R. & Smartt, S. J. 2009, Science, 324, 486
- Maund et al. (2005) Maund, J. R., Smartt, S. J., & Danziger, I. J. 2005, MNRAS: Letters, 364, L33
- Meikle et al. (2006) Meikle, W. P. S., Mattila, S., Gerardy, C. L., et al. 2006, ApJ, 649, 332
- Misra et al. (2007) Misra, K., Pooley, D., Chandra, P., et al. 2007, MNRAS, 381, 280
- Munari & Zwitter (1997) Munari, U. & Zwitter, T. 1997, A&A, 318, 269
- Nakano & Itagaki (2006) Nakano, S. & Itagaki, K. 2006, IAU Circ., 8773, 1
- Nakano et al. (2006) Nakano, S., Itagaki, K., & Kadota, K. 2006, CBET, 756, 1
- Pilyugin et al. (2004) Pilyugin, L. S., Vílchez, J. M., & Contini, T. 2004, A&A, 425, 849
- Poelarends et al. (2008) Poelarends, A. J. T., Herwig, F., Langer, N., & Heger, A. 2008, ApJ, 675, 614
- Prieto et al. (2008) Prieto, J. L., Kistler, M. D., Thompson, T. A., et al. 2008, ApJL, 681, L9
- Sahu et al. (2006) Sahu, D. K., Anupama, G. C., Srividya, S., & Muneer, S. 2006, MNRAS, 372, 1315
- Schlegel et al. (1998) Schlegel, D. J., Finkbeiner, D. P., & Davis, M. 1998, ApJ v.500, 500, 525
- Schoeniger & Sofue (1997) Schoeniger, F. & Sofue, Y. 1997, A&A, 323, 14
- Siess (2007) Siess, L. 2007, A&A, 476, 893
- Smartt (2009) Smartt, S. J. 2009, ARAA, 47, 63
- Smartt et al. (2009) Smartt, S. J., Eldridge, J. J., Crockett, R. M., & Maund, J. R. 2009, MNRAS, 395, 1409
- Smartt et al. (2001) Smartt, S. J., Gilmore, G. F., Trentham, N., Tout, C. A., & Frayn, C. M. 2001, ApJL, 556, L29
- Smartt et al. (2003) Smartt, S. J., Maund, J. R., Gilmore, G. F., et al. 2003, MNRAS, 343, 735
- Smartt et al. (2004) Smartt, S. J., Maund, J. R., Hendry, M. A., et al. 2004, Science, 303, 499
- Solanes et al. (2002) Solanes, J. M., Sanchis, T., Salvador-Solé, E., Giovanelli, R., & Haynes, M. P. 2002, AJ, 124, 2440
- Stanishev & Nielsen (2006) Stanishev, V. & Nielsen, T. B. 2006, CBET, 737, 1
- Tully (1988) Tully, R. B. 1988, Nearby Galaxies Catalog (Cambridge University Press, 1988, 221 pages.)
- Van Dyk et al. (2003a) Van Dyk, S. D., Li, W., & Filippenko, A. V. 2003a, PASP, 115, 448
- Van Dyk et al. (2003b) Van Dyk, S. D., Li, W., & Filippenko, A. V. 2003b, PASP, 115, 1289
- Van Dyk et al. (2003c) Van Dyk, S. D., Li, W., & Filippenko, A. V. 2003c, PASP, 115, 1
- van Loon et al. (2005) van Loon, J. T., Cioni, M.-R. L., Zijlstra, A. A., & Loup, C. 2005, A&A, 438, 273
- Zwitter et al. (2004) Zwitter, T., Munari, U., & Moretti, S. 2004, IAU Circ., 8413, 1
Appendix A A Note on Extinction
In all cases in this paper, we have used our best estimate for the extinction towards each SN as a proxy for that of its progenitor star. We therefore assume that the extinction towards each SN is the same as that towards its progenitor before explosion. However, if the progenitor stars happened to be surrounded by a significant quantity of circumstellar dust, this might not be true (e.g., Botticella et al. 2009). Dust within a certain radius could be photo-evaporated by the SN explosion (Dwek 1983), effectively reducing the extinction measured towards a SN compared with that towards its progenitor star. Botticella et al. (2009) have estimated that it is possible for the UV-optical luminosity of a type II-P SN to destroy circumstellar dust equating to several tens of magnitudes of optical extinction.
All this is of little concern if the progenitor star is free of such circumstellar material, or if this material is far enough from the star to avoid evaporation (e.g., Meikle et al. 2006). If a progenitor star was detected across a sufficient number and range of band-passes one could directly measure its extinction. Such direct measurement could reveal the presence of circumstellar dust that was subsequently destroyed by the SN. Unfortunately none of the three SNe studied in this paper fulfil these requirements.
In 6.2 of Smartt et al. (2009), we have discussed the progenitor extinction problem with relation to 20 type II-P SNe, including the three featured in this paper. We refer the reader to Smartt et al. (2009) for the detailed discussion, but highlight some of the main points here. The distribution of extinction values estimated for our progenitor sample was more or less consistent with that for optically selected red supergiants in the LMC and SMC (Levesque et al. 2006), albeit with some evidence to suggest there were greater numbers of objects from our sample in the lowest extinction bin than would be typical for red supergiants (see Figure 5 Smartt et al. 2009). An arbitrary increase in of 0.3 mag for the 5 lowest reddening values in our sample brings the mean into line with that of the LMC/SMC red supergiants. The progenitors of SNe 2006my and 2006ov are two of the five objects ostensibly suffering the lowest extinctions. Applying the above arbitrary increase raises the upper mass limits for these two progenitors to: 2006my 14M⊙; 2006ov 11M⊙.
Highly reddened () red supergiants do exist (e.g. van Loon et al. 2005) and these, being optically obscured, would not be included in the sample of Levesque et al. (2006). Our comparison sample is therefore biased towards lower extinctions, although to what extent is unclear since the relative number of heavily extinguished to low/moderately extinguished red supergiants is unknown. Without these relative numbers, we favour the progenitors to have come from a population of low/moderately extinguished red supergiants, although ultimately we cannot rule out that any of the three progenitors studied in this paper could have experienced much higher reddening than estimated.
How would this essentially arbitrary source of extinction affect our results? Assuming arbitrary extinction, no constraints whatsoever can be placed on the mass limits or spectral types of the progenitors of SNe 2006my and 2006ov, since in both cases we do not detect a progenitor star. In the case of SN 2004et some constraints are possible. Assuming the progenitor photometry of 4.4.2, the colour of any fitted progenitor model must satisfy the observed (apparent) colour range of =1.510.31. For a progenitor of given spectral type, a range of extinctions between minimum and maximum values will satisfy this condition. Hotter/bluer spectral types will require higher minimum extinctions, while such increases in extinction will rule out cooler spectral types. The result is that, as extinction is increased, we can fit progenitors of higher luminosity/mass, but these must also be of earlier spectral type.
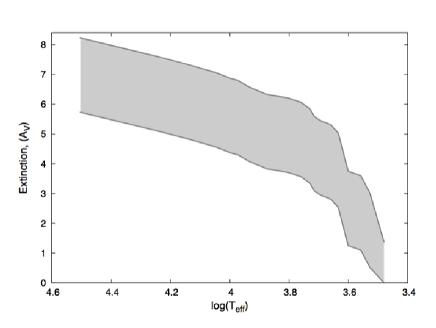
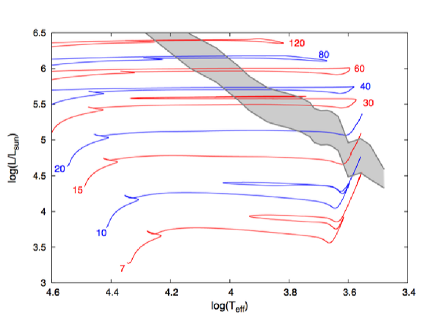
The results of a simple calculation using the photometry of the SN 2004et progenitor, as derived in 4.4.2, and the intrinsic colours of supergiant stars from Drilling & Landolt (2000) are plotted in Figure 12. The minimum and maximum values of extinction, , required to fit each spectral type are easily calculated from:
| (5) |
where,
| (6) |
The denominator of eqn. 5 comes from the ratios =0.751 and =0.479 from Cardelli et al. (1989). The minimum and maximum luminosities plotted in Figure 12 were calculated from the I-band progenitor photometry (4.4.2), the distance modulus (4.4), the bolometric and colour corrections from Drilling & Landolt (2000), and the minimum and maximum extinction values derived for each spectral type. stars stellar models for stars of initial masses between 7 - 120 M⊙ are also plotted. These can be used as a rough guide to the initial stellar mass for a progenitor of given spectral type. Alternatively, the plotted luminosities can be compared directly with model endpoint luminosities in Figure 3.
In the introduction to this paper we discussed the X-ray and radio detections of SN 2004et (Argo et al. 2005; Misra et al. 2007; Martí-Vidal et al. 2007), while in 4.3.1 we show a NIR re-brightening some 4 years post-explosion and discuss the results of Kotak et al. (2009) who find evidence of ejecta-CSM interaction. These observations infer the presence of significant amounts of circumstellar material (CSM) around the progenitor star. One might therefore argue, with some justification, that the progenitor of SN 2004et was significantly extinguished by CSM, some of which may have been destroyed in the SN explosion. Our simple analysis suggests that if the extinction was greater than , the progenitor star could not have been a red supergiant. On the other hand, if it was a red supergiant it could not have had an initial mass greater than 16 M⊙.
It should be noted that to assume a progenitor of earlier spectral type automatically requires it to be more compact. For example a G0 supergiant has a radius of RR⊙. Such radii are not easy to reconcile with the fact that SN 2004et was a typical II-P (Misra et al. 2007; Sahu et al. 2006; Maguire et al. 2010). SNe II-P require larger radii of the order 400-1000R⊙ (Chevalier 1976; Arnett 1980), which are typical for red supergiant stars.