Direct Observation of Coherent Population Trapping in a Superconducting Artificial Atom
Abstract
The phenomenon of Coherent Population Trapping (CPT) of an atom (or solid state “artificial atom”), and the associated effect of Electromagnetically Induced Transparency (EIT), are clear demonstrations of quantum interference due to coherence in multi-level quantum systems. We report observation of CPT in a superconducting phase qubit by simultaneously driving two coherent transitions in a -type configuration, utilizing the three lowest lying levels of a local minimum of a phase qubit. We observe suppression of excited state population under conditions of CPT resonance. We present data and matching theoretical simulations showing the development of CPT in time. Finally, we used the observed time dependence of the excited state population to characterize quantum dephasing times of the system.
pacs:
Coherent population trapping (CPT) is a physical effect in which a quantum system is driven into a coherent superposition of two long-lived states by a combination of two optical fields. These fields couple each of the long-lived states to a common, shorter-lived excited state. CPT has been observed for some time in atomic systems Gray et al. (1997). CPT refers to the dynamics of the atom while the associated effect on the optical fields is referred to as electromagnetically induced transparency (EIT) Harris (1997). EIT has been shown to give rise to a number of interesting effects, including slow light Hau et al. (1999); Kash et al. (1999); Budker et al. (1999), low light level non-linear optics Harris and Hau (1999); Schmidt and Imamoglu (1996), and single photon quantum storage and memory van der Wal et al. (2003); Kuzmich et al. (2003); Chaneliere et al. (2005). There have been impressive demonstrations in quantum wells Serapiglia et al. (2000); Phillips and Wang (2004) and more recently in quantum dots Xu et al. (2008).
In Murali et al. (2004) it was proposed to apply these concepts to the microwave, rather than optical, domain in superconducting quantum circuits. This step is interesting for two reasons. First, it applies CPT and EIT and related nonlinear optical effects to superconducting qubits, which have shown great promise for future quantum information processing systems DiCarlo et al. (2009); Ansmann et al. (2009). Second, it also involves observing these effects in a completely different region of the electromagnetic spectrum. Some experimental steps in this direction were taken in Baur et al. (2009); Sillanpää et al. (2009), in which the related effect of Autler-Townes (AT) splitting Autler and Townes (1955) was observed.
In this letter, we present direct experimental observation of Coherent Population Trapping (CPT) in a three level configuration superconducting system in which two long-lived levels ( and ) are coupled to a short-lived higher-lying level (). By resonantly driving two transitions of this system with a two-tone microwave field, we observe the creation of a coherent superposition state of the lower lying levels, which is known as a “dark” state and is central to the observation of CPT Harris (1997). We observe the probe resonance in the absence of CPT conditions, and a suppression of this resonant excitation under conditions of CPT. Furthermore, we observe the time dynamics of the development of the CPT resonance and use the observed time dependence to extract decoherence rates, as proposed in Murali et al. (2004). Our experimental results are corroborated by theoretical simulations of the density matrix evolution of the system.
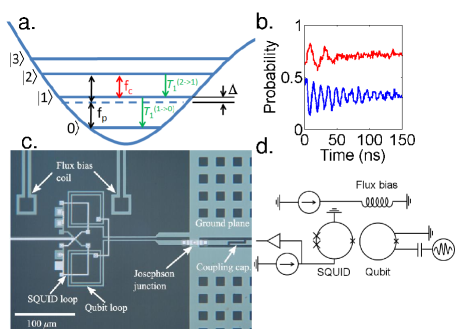
In our implementation, the three states of our system are the three lowest levels of a metastable phase qubit potential well Martinis et al. (2002) (Fig. 1(a)). This device exhibits an anharmonic potential in which the transition frequencies, and , differ by a few percent. The design of the qubit seen in Fig. 1(c,d) is identical to the devices explored in Kline et al. (2009). The fabrication of the junctions was targeted to yield a flux tunable transition frequency in the 5-10 GHz range. For the CPT experiment we biased the qubit to have GHz which makes GHz. This corresponds to a shallow qubit potential that supports approximately 8 metastable bound states. For the sake of visual simplicity these other levels are not include in Fig. 1(a). We choose this flux bias to make the anharmonicity parameter MHz sufficiently large and to create a strong damping of which is advantageous for observing CPT.
When a microwave field is applied at the frequency we obtain Rabi oscillations with a period determined by the Rabi frequency , proportional to the field envelope amplitude. To create a system, we couple to via a two-photon virtual transition with a probe microwave field near frequency GHz. In this virtual excitation scheme the single photon energy is significantly detuned from . The detuning is determined by the anharmonicity parameter . The resonant Rabi frequency associated with the transition is and for sufficiently small microwave field amplitude (), the effective two-photon coupling amplitude is Dutta et al. (2008). The accuracy of these expressions was confirmed in Dutta et al. (2008) where it was noted that this two-photon virtual transition amplitude quantitatively explained the observed coupling rates. It was also noted there that the two-photon virtual process dominates the direct two-photon process. Contrary to the spectroscopic results in Dutta et al. (2008), we observe only the and transitions and none of the higher level transitions observed in Dutta et al. (2008). In our experiment we choose MHz, giving MHz.
Rabi oscillations shown in Figure 1(b) were measured with a qubit bias that exhibited longer coherence times [23] than the bias used for the CPT experiment. This demonstrates coherence of both the and transitions. The oscillations are slower than the oscillations due to the smaller effective Rabi frequency, and more damped due to the faster relaxation of state Wang et al. (2008). We note that in this scheme there is some unwanted population excitation of the intermediate level . This process is accounted for in our theoretical analysis and it effects our data quantitatively but does not prevent CPT from clearly being observed.
To suppress the probe transition process via CPT, we apply a second coupling microwave field at frequency . The amplitude of this transition is given by , where is the resonant Rabi frequency. When both fields are applied simultaneously, the system is ideally driven from the ground state into the “dark” state superposition , where . In this superposition, the excitation amplitudes for each of the individual probe and coupling transitions are equal and opposite, resulting in a quantum interference which suppresses the excitation of state .
In order to initialize the system into a well defined state, we let the qubit relax to the state . To observe CPT we then apply a two-tone microwave field at frequencies and , with independently controlled power at each frequency, and duration using a pulsing scheme similar to Lucero et al. (2008). Our microwave pulses were generated by sending trapezoidal envelope pulses through a 1 GHz low pass filter and into the IF port of a microwave mixer. Analysis of Rabi and data showed that we had independent control over the amplitude and duration of these pulses. After the time , the qubit state is destructively measured with a calibrated pulse that probes the population of the state only () Mea . We repeat this procedure many times at each and to get statistics, and swept these frequencies about the resonances and .
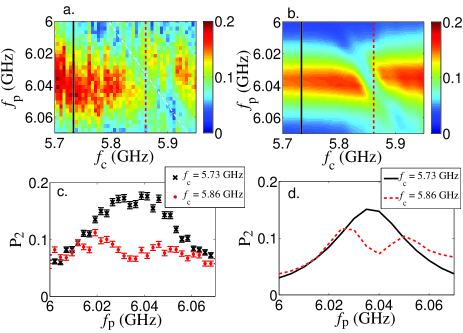
Figure 2(a) presents our results showing the CPT resonance and Fig. 2(c) shows cuts at two values of . At GHz, far from the coupling resonance , we observe a probe resonance at GHz with width of approximately 40 MHz. This is primarily broadened by the linewidth of the transition, . No CPT is observed here as the dark state is quickly dephased. A similar feature is obtained in the absence of a coupling field. By contrast, a cut at GHz reveals a suppression of relative to the off-resonant case. The CPT contrast and uncertainty was extracted from a parabolic fit of both curves in Fig. 2(c). A salient feature observed in Fig. 2(a) is the diagonal trench of suppressed at positions corresponding to the CPT resonance (white dot-dashed line in Fig. 2(a)).
We compare our experimental results with theoretical simulations in which we propagate the density matrix equations in time with a Runge-Kutta algorithm. In the model we include the first four levels of the phase qubit potential well and dipole coupling on , , and from both applied fields. The relative dipole moments for these transitions are . The presence of the state was seen to have a negligible effect on our simulation results, as was expected. The population of state was found to be for all of our simulations. The overall calibration between Rabi frequency couplings and microwave powers was fitted as a free parameter. Since the relative phase of the probe and coupling field varied randomly from shot to shot in our experiment, our theoretical results were averaged over all possible phase differences of the microwave fields. The dipole moment for direct transitions is much smaller Dutta et al. (2008) and furthermore is far detuned from both microwave fields. Population decay was included according to independent measurements of the energy relaxation times, ns and ns. We extracted the dephasing time ns from the width of several off resonant cuts near GHz.
Results of our theoretical simulations are presented in Fig. 2(b). We see good agreement with the experimental data in Fig. 2(a), with the theory clearly showing the broad horizontal stripe corresponding to the probe resonance and the diagonal trough due to CPT. A more quantitative comparison is seen by examining the cuts in Fig. 2(c) and (d). By fitting data near the CPT resonance at GHz, we found best agreement for dephasing times ns and ns. Rabi data taken for this potential was consistent with this value of . In the limit of a perfect three-level system and an infinitely long lived coherence , the CPT suppression under conditions of EIT resonance () would be . The resonant suppression predicted in the theoretical simulation is , in fairly good agreement with the observation of . Analysis of the theoretical results reveals that the finite probability of excitation is primarily due to dephasing of the transition, but also partly due to undesired off-resonant coupling Dutton et al. (2006). The most dominant such coupling is due to the probe field coupling the transition.
We note that our configuration is distinct from that employed in the recent observation of Autler-Townes splitting in a superconducting phase qubit Sillanpää et al. (2009), where a ladder scheme was used and population was suppressed in the intermediate level . This leads to two important qualitative differences. First, in contrast to Sillanpää et al. (2009), we directly measure the expected population suppression (which in our case is of ). Second, the fact that we create a dark state of the two longest lived states in the system allows us to unambiguously observe CPT, rather than the closely related phenomena of Autler-Townes (AT) splitting Sillanpää et al. (2009); Baur et al. (2009). In AT, the coupling field dresses the system, splitting the probe resonance, of width , into two distinct resonances, spaced by the coupling field amplitude . In this regime, the suppression of at the probe resonance can be attributed to large detuning () from the dressed resonance peaks. By contrast, when the resonances still largely overlap and the suppression of can only be explained by a quantum inteference of the excitation processes. In our experiment, we estimate MHz, and MHz, which would correspond to only suppression of attributable purely to the AT splitting. The uncertainty in this quantity comes from the uncertainty in the value of . Using this same model the contrast including quantum interference is predicted to be , which is consistent with our experimental results.
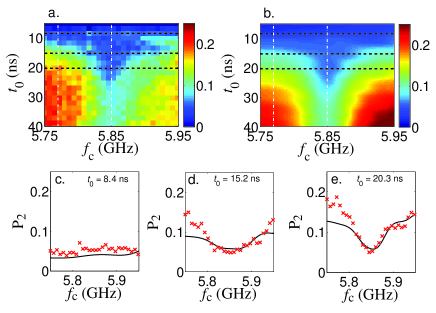
To further understand CPT and EIT in our system, we varied the duration of the two microwave fields. Figure 3(a) presents measurements of as a function of and keeping the probe field on the two-photon resonance . The results show the excitation into is slowed when the coupling field is at the CPT resonance . Figure 3(c-e) shows cuts in at several different times. Note that the probe is always on, resonantly exciting the transition. As time progresses the CPT feature narrows and deepens until the maximum suppression () is reached at about ns. After this time, contrast is degraded by the decoherence rate and in the limit of longer times, the EIT notch disappears.
Since the excitation of is driven by , it was previously proposed Murali et al. (2004) to extract this decoherence rate by measuring loss in a CPT experiment. We realized this idea by taking a cut of the data in Fig. 3(a) both off ( GHz) and on ( GHz) CPT resonance (Fig. 4(a,b)). The theoretical data from Fig. 3 are then presented as solid black lines. We adjusted the various dephasing times and energy level frequencies in the theory to best fit the experimental data and found the best agreement for ns, ns , and ns TLS .
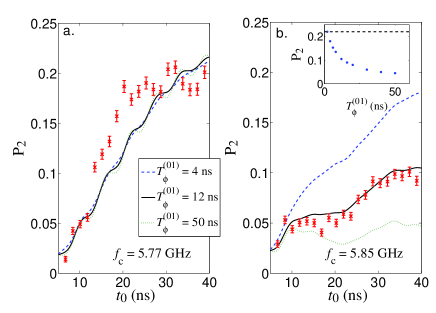
To understand how sensitive a probe this measurement is of we performed several simulations in which we varied this parameter. The inset in Fig. 4(b) shows at ns as a function of . We see that in the regime we are able to measure . At longer the population asymptotically approached a level which is dominated by off-resonant coupling effects Dutton et al. (2006). Performing our experiment in a regime with greater anharmonicity would suppress this effect, allowing measurement of longer and, in the event of obtaining larger coherence times, greater CPT suppression of .
In summary, we have directly observed CPT in a three-level superconducting phase qubit and seen suppression of the excited level population that is clearly attributable to quantum interference. We did this by creating a configuration using a two-photon virtual probe transition and monitoring the population of . We have matched our results with theoretical simulations of the full density matrix equations, including expected decoherence and cross-talk effects. We have furthermore observed the development of the characteristic EIT notch in time and used these time dynamics to characterize the decoherence time of the transition.
These results are of fundamental interest as a clear observation of a quantum interference at a macroscopic scale. Furthermore, they are directly pertinent to future investigations of low light level nonlinear optics in the microwave domain and quantum information applications utilizing superconducting quantum circuits.
Acknowledgements.
We acknowledge generous internal support from BBN Technologies to carry out this work. We thank Jon Habif for the suggestion to try this experiment. The fabrication of the device was funded by the US government and IARPA.References
- Gray et al. (1997) H. R. Gray, R. M. Whitley, and J. C. R. Stroud, Optical Letters 3, 218 (1997).
- Harris (1997) S. E. Harris, Physics Today 50, 36 (1997).
- Hau et al. (1999) L. V. Hau, S. E. Harris, Z. Dutton, and C. H. Behroozi, Nature 397, 594 (1999).
- Kash et al. (1999) M. M. Kash et al., Phys. Rev. Lett. 82, 5229 (1999).
- Budker et al. (1999) D. Budker, D. F. Kimball, S. M. Rochester, and V. V. Yashchuk, Phys. Rev. Lett. 83, 1767 (1999).
- Harris and Hau (1999) S. E. Harris and L. V. Hau, Phys. Rev. Lett. 82, 4611 (1999).
- Schmidt and Imamoglu (1996) H. Schmidt and A. Imamoglu, Opt. Lett. 21, 1936 (1996).
- van der Wal et al. (2003) C. H. van der Wal et al., Science 301, 196 (2003).
- Kuzmich et al. (2003) A. Kuzmich et al., Nature 423, 731 (2003).
- Chaneliere et al. (2005) T. Chaneliere et al., Nature 438, 833 (2005).
- Serapiglia et al. (2000) G. B. Serapiglia et al., Phys. Rev. Lett. 84, 1019 (2000).
- Phillips and Wang (2004) M. C. Phillips and H. Wang, Phys. Rev. B 69, 115337 (2004).
- Xu et al. (2008) X. Xu et al., Nat. Phys. 4, 692 (2008).
- Murali et al. (2004) K. V. R. M. Murali et al., Phys. Rev. Lett. 93, 087003 (2004).
- DiCarlo et al. (2009) L. DiCarlo et al., Nature 460, 240 (2009).
- Ansmann et al. (2009) M. Ansmann et al., Nature 461, 504 (2009).
- Baur et al. (2009) M. Baur et al., Phys. Rev. Lett. 102, 243602 (2009).
- Sillanpää et al. (2009) M. A. Sillanpää et al., Phys. Rev. Lett. 103, 193601 (2009).
- Autler and Townes (1955) S. H. Autler and C. H. Townes, Phys. Rev. 100, 703 (1955).
- Martinis et al. (2002) J. M. Martinis, S. Nam, J. Aumentado, and C. Urbina, Phys. Rev. Lett. 89, 117901 (2002).
- Kline et al. (2009) J. S. Kline et al., Supercond. Sci. Technol. 22, 015004 (2009).
- Dutta et al. (2008) S. K. Dutta et al., Phys. Rev. B 78, 104510 (2008).
- Wang et al. (2008) H. Wang et al., Phys. Rev. Lett. 101, 240401 (2008).
- Lucero et al. (2008) E. Lucero et al., Phys. Rev. Lett. 100, 247001 (2008).
- (25) Using theoretical simulations we extracted a measurement contrast of , and background of in our data. All presented data have been processed to give in accordance with this analysis.
- Dutton et al. (2006) Z. Dutton, K. V. R. M. Murali, W. D. Oliver, and T. P. Orlando, Phys. Rev. B 73, 104516 (2006).
- (27) Note that the dephasing times are different in Fig. 2 and Fig. 3. We speculate that this difference could be attributable to shifts in the frequencies of two-level fluctuators between runs.