Properties of Gamma Ray Bursts at different redshifts
Abstract
GRBs are now detected up to Sal-ref ,Tan-ref . We try to find differences, in their restframe properties, which could be related either to distance or to observing conditions.
I SAMPLE SELECTION
We try to find changes in the properties of GRBs at different redshifts which could be related to source evolution. We consider all the 149 events detected by Swift Bar-ref , Geh-ref between January 26, 2005 and July 15, 2009 for which the redshift has been at least tentatively measured. We use the table given at the HEASARC website111 http://heasarc.gsfc.nasa.gov/docs/swift/archive/grb_table.html.
Figure 1 shows the histogram of all GRB redshifts detected until July 15, 2009. Data for Figure 1 were taken from the above quoted website and from GCN222http://gcn.gsfc.nasa.gov/gcn3_archive.html. We also show the histogram for events detected by HETE-2 and BeppoSAX, although the trigger criteria were not the same for all three experiments.
II ANALYSIS
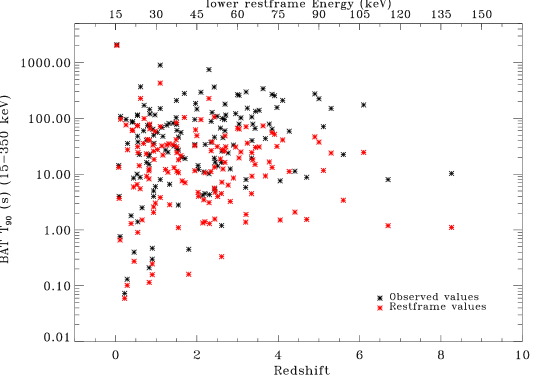
The Swift table gives also the BAT fluence (15-150 keV) and the BAT T90 (15-350 keV). We consider both the values in the observer’s frame and the ones converted in the restframe. The redshift in the events goes from 0.0331 to 8.26. Note that the lowest value of the redshift until now is 0.0085 for GRB980425, detected by BeppoSAX.

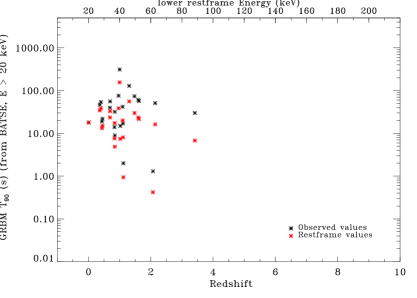
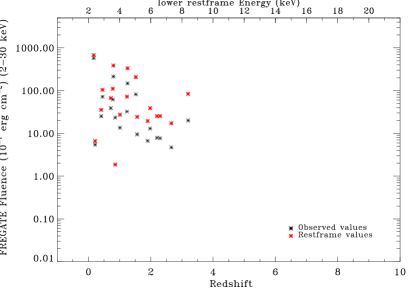
The scatter diagrams of those quantities, namely BAT T90 and fluence, are shown in Figures 2 and 4 respectively, both in the observer’s and in the restframe. For lack of some data only a total of 139 events could actually be used. For comparison we also show T90 versus redshift (Figure 3) and fluence versus redshift (Figure 5) as obtained using the Gamma Ray Burst Monitor (GRBM) Fro-ref , on board of BeppoSAX (energy bands: keV for T90 and 40–700 keV for fluence) and FREnch GAmma-ray TElescope (FREGATE) Pel-ref , on board of HETE-2 (energy bands: 6–80 keV for T90 and 2–30 keV for fluence).
As noted by Dr. Upendra Desai Des-ref in Figure 2 and even more in Figure 4 there seems to be a lack of “low T90–low Fluence” events at and , but unfortunately the number of GRBs is still too small to allow us to confirm this possibility. We recall that, for example, in the case of quasars the periodicity of redshifts is a problem which has been debated for many years Lop-ref .
As shown in Figure 6, we also tried to compensate for the fact that the values, taken at the same energy range in the observer’s frame, originate from different energy ranges in the event’s restframe. T90 in the restframe is the observed value divided by and the fluence in the restframe is the observed value multiplied by , but their respective energy intervals in the restframe are also multiplied by . By using the Fenimore Fen-ref correlation between peak duration and energy, and assuming that it can be applied also to T90, we try to take into account that, for long bursts, the duration normally decreases with energy.
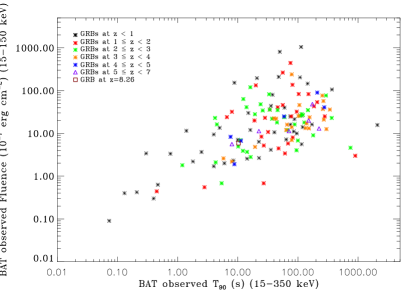
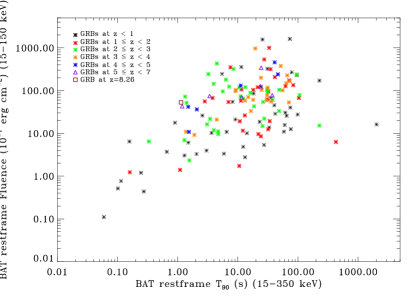
In Figure 7 we show the scatter diagram of fluence versus T90, again in the observer’s and restframe for the Swift events, color coded for six redshift intervals.


III Correlation coefficients
We also computed the fluence–T90 correlation coefficients for the same redshift groups shown in Figure 6 (see Table 1). The correlation for all redshifts together is , both for observed and restframe values, non weighted, while it is and for observed and restframe weighted values.
| Redshift groups | 0–1 | 1–2 | 2–3 | 3–4 | 4–5 | 5–7 |
|---|---|---|---|---|---|---|
| Number of GRBs | ||||||
| per group | 45 | 28 | 34 | 21 | 6 | 5 |
| Coeff. neglecting | ||||||
| both errors | ||||||
| Coeff. including | ||||||
| fluence errors |
IV CONCLUSION
We considered 139 GRBs at different redshifts, all of them detected by the same experiment, Swift-BAT, hoping to find proof of evolution with . Except for the well known two groups of “short” and “long” GRBs, which appear to be a little less well defined in the restframe, no such proof is evident. We can see from the plots (Figures 2 and 4) that the number of events obviously becomes smaller with redshift, but both T90 and fluence hardly change in their average log value, where we find them also for the events at the largest redshifts. Thus we conclude that the probability of having GRB with those values is higher, even at large . We conclude that no redshift selection or evolution can yet be inferred from our plots. Even GRB090423, the one detected at the largest until now, lies just in the middle of the distribution in the observer’s restframe. Not surprisingly, it is evident from the restframe plots (Figure 7, right panel) that fluence increases with T90 practically for all redshifts. Bursts at large redshifts have higher fluences, but we must remember that they originate from higher energy ranges and that detection thresholds favor distant intense events.
References
- (1) Salvaterra, R., et al. 2009, Nature, 461, 1258
- (2) Tanvir, N.R., et al. 2009, Nature, 461, 1254
- (3) Barthelmy, S.D., et al. 2005, SSR, 120, 143
- (4) Gehrels, N., et al, 2007, NJPh, 9, 37
- (5) Frontera, F. et al. 2009, ApJS, 180, 192
- (6) Pelangeon, A. et al. 2008, A&A, 491, 157
- (7) Desai, U.D. private communication
- (8) Lopez-Corredoira, M. 2009, arXiv0910.4297
- (9) Fenimore, E.E., et al. 1995, ApJ, 448, L101