The XMM-Newton Wide Angle Survey (XWAS): the X-ray spectrum of type-1 AGN
Abstract
Aims. We discuss the broad band X-ray properties of one of the largest samples of X-ray selected type-1 AGN to date (487 objects in total), drawn from the XMM-Newton Wide Angle Survey (XWAS). The objects presented in this work cover 2-10 keV (rest-frame) luminosities from and are detected up to redshift 4. We constrain the overall properties of the broad band continuum, soft excess and X-ray absorption, along with their dependence on the X-ray luminosity and redshift. We discuss the implications for models of AGN emission.
Methods. We fitted the observed 0.2-12 keV broad band spectra with various models to search for X-ray absorption and soft excess. The F-test was used with a significance threshold of 99% to statistically accept the detection of additional spectral components.
Results. We constrained the mean spectral index of the broad band X-ray continuum to with intrinsic dispersion . The continuum becomes harder at faint fluxes and at higher redshifts and hard (2-10 keV) luminosities. The dependence of with flux is likely due to undetected absorption rather than to spectral variation. We found a strong dependence of the detection efficiency of objects on the spectral shape. We expect this effect to have an impact on the measured mean continuum shapes of sources at different redshifts and luminosities. We detected excess absorption in 3% of our objects, with rest-frame column densities a few . The apparent mismatch between the optical classification and X-ray properties of these objects is a challenge for the standard orientation-based AGN unification model. We found that the fraction of objects with detected soft excess is 36%. Using a thermal model, we constrained the soft excess mean rest-frame temperature and intrinsic dispersion to kT100 eV and 34 eV. The origin of the soft excess as thermal emission from the accretion disk or Compton scattered disk emission is ruled out on the basis of the temperatures detected and the lack of correlation of the soft excess temperature with the hard X-ray luminosity over more than 2 orders of magnitude in luminosity. Furthermore, the high luminosities of the soft excess rule out an origin in the host galaxy.
Key Words.:
X-rays: general - X-rays: diffuse background - surveys - galaxies: active1 Introduction
It is now widely accepted that the emission of Active Galactic Nuclei (AGN) in the X-ray band originates in the innermost regions, close to the energy source of the AGN, most probably an accreting supermassive black hole (SMBH). The study of the X-ray emission of AGN provides strong constraints on their powering mechanism and gives insight to the geometry and physical conditions of the matter surrounding the SMBH.
The typical spectrum of both low luminosity Seyfert galaxies and bright QSOs in the hard X-ray band (2 keV) is dominated by a power-law emission with a photon index 2 with intrinsic dispersion 0.2-0.3 (e.g. Mainieri et al. Mainieri07 (2007); Tozzi et al. Tozzi06 (2006); Mateos et al. 2005b ). This hard X-ray spectral component is believed to originate in hot plasma surrounding the accretion disk which Compton up-scatters UV-soft X-ray thermal emission from the disk into the hard X-ray band (Haardt & Maraschi Haardt91 (1991)).
Part of the primary power-law continuum emission is then reprocessed in the disk producing a reflection spectrum characterised by a hardening of the spectrum above 10 keV and a fluorescent Fe K emission line around 6.4 keV mostly detected in Seyfert-like luminosity objects (Pounds et al. Pounds90 (1990)). Signatures of ionised and/or cold gas have also been detected in high signal-to-noise X-ray spectra of both Seyfert galaxies and QSOs (e.g. Piconcelli et al. Piconcelli05 (2005)). Moreover, an important fraction of AGN shows an excess of emission with respect to the power-law emerging below 2 keV, the so-called soft excess, whose nature is still debated. The soft excess has been interpreted as the tail of the thermal emission from the accretion disk (Turner & Pounds Turner89 (1989)) or Comptonization of EUV accretion disk photons (Kawaguchi et al. Kawaguchi01 (2001)). However, when the soft excess is fitted with a thermal model, the measured temperature is roughly constant over several orders of magnitude in luminosity and BH mass (0.1 keV, Crummy et al. Crummy06 (2006); Gierliński & Done Gierlinski04 (2004)). This is a major problem for models based on accretion disk continuum emission because the disk temperature is expected to vary with both the mass of the black hole and the accretion rate. Furthermore, the measured soft excess temperatures are too high to be the high energy tail of the accretion disk emission. In the past few years two alternative models with very different geometries have been proposed to explain the origin of the soft excess, both relating this spectral component to atomic rather than continuum processes: the soft excess could be produced by absorption from a relativistically outflowing warm gas which is optically thin and in the line of sight, i.e. a wind above the disk (Gierliński & Done Gierlinski04 (2004)), or by enhancement of reprocessing of disk emission in optically thick material out of the line of sight (Crummy et al. Crummy06 (2006)). These two models are indistinguishable in the 0.2-10 keV band (see Ponti et al. Ponti08 (2008) and references therein).


In most surveys AGN are optically classified as type-1 AGN if broad lines with velocity widths are present in their optical spectra. Objects where only narrow lines (velocity widths ) are seen are classified as type-2 AGN. According to AGN unification models the different properties observed for type-1 and type-2 AGN can be explained solely as an orientation effect (e.g. Antonucci Antonucci93 (1993); Urry & Padovani Urry95 (1995)). In type-1 AGN our line of sight to the nucleus is not intercepted by optically obscuring material, and therefore we see the central engine and the broad line region. The line of sight in type-2 AGN intercepts the obscuring material hiding both the central engine and the broad line region. Therefore type-1 AGN are expected to show little or no obscuration in X-rays while type-2 AGN should be more heavily absorbed in X-rays. Spectral analyses have shown that the optical type vs. X-ray properties for most AGN generally agree with the predictions from AGN unification models. However, in recent years, the number of cases where the predictions from AGN unification models do not match the observations has increased substantially, as significant absorption has been detected in 10% type-1 AGN (Cappi et al. Cappi06 (2006); Mateos et al. 2005b ; Akylas et al. Akylas04 (2004)) while type-2 AGN have been detected without any signatures of X-ray absorption (Panessa et al. Panessa09 (2009); Bianchi et al. Bianchi08 (2008); Corral et al. Corral05 (2005); Panessa & Bassani Panessa02 (2002)).
It is still not clear whether the X-ray properties of AGN depend on the luminosity or have any spectral variation with redshift. Various studies of the X-ray photon index have produced different results. Some authors claim an anti-correlation between the spectral photon index and the X-ray luminosity (Young et al. Young09 (2009); Saez et al. Saez08 (2008); Page et al. Page05 (2005)) while other studies suggest the opposite correlation (Dai et al. Dai04 (2004)) or no correlation at all (Winter et al. Winter09 (2009); Mateos et al. 2005b ; George et al. George00 (2000); Reeves & Turner Reeves00 (2000)). Studies of the X-ray spectra of AGN have generally shown no clear dependence of the AGN X-ray properties on the redshift (Mateos et al. 2005a ), although some exceptions have been found (Kelly et al. Kelly07 (2007)).
Here we investigate the broad band X-ray properties of 487 type-1 AGN from the XMM-Newton Wide Angle Survey (XWAS). We selected only those objects having X-ray spectra with sufficient signal-to-noise ratio (hereafter S/N) to perform a basic spectral analysis. This is one of the largest X-ray selected samples of type-1 AGN assembled to date for which constraints on the X-ray properties of the sources can be directly derived from a spectral analysis. A study of the X-ray properties of 156 type-1 AGN observed by XMM-Newton was recently presented by Bianchi et al. (Bianchi08 (2008)). As this study is based on type-1 AGN in targeted observations, it has the advantage that most of the spectra are characterised by high S/N, but it has the disadvantage of complex selection function, biased towards ’interesting’ objects, and it mainly samples AGN in the local Universe. The type-1 AGN from XWAS span more than 3 orders of magnitude in X-ray luminosity and are detected at redshifts from 0.08 to 3.9. Hence, our type-1 AGN sample is ideal to investigate whether the properties of the broad band continuum shape, X-ray absorption and soft excess in type-1 AGN depend on the X-ray luminosity of the objects and whether they have evolved with cosmic time.
This paper is organised as follows: In §2 we describe the XMM-Newton Wide Angle Survey and the compilation of the sample of type-1 AGN. In §3 we discuss the procedure for extraction of the X-ray spectra of the objects and the spectral fitting. In §4 we present and discuss the results of the spectral analysis. The summary and conclusions of our analysis are reported in §5. Throughout this paper we have adopted the WMAP derived cosmology with , and (Spergel et al. Spergel03 (2003)).
2 The XMM-Newton Wide Angle Survey (XWAS)
The XMM-Newton Wide Angle Survey (XWAS) identification programme was based on optical multi-fibre spectroscopy obtained at the Anglo Australian Telescope (AAT) Two Degree Field (2dF; Lewis et al. Lewis02 (2002)) for the counterparts of serendipitous X-ray sources, originally selected from 68 spatially distinct pointings made by XMM-Newton between June 2000 and May 2003. The fields targeted by XWAS cover a net sky area 11.5 deg2. A full description of this survey will be presented in a forthcoming paper.
The XMM-Newton field selection for XWAS prioritised those observations with adjacent or overlapping coverage, to take optimum advantage of the 2 degree diameter of the 2dF spectrograph. Counterparts for 2dF spectroscopy were primarily selected from the SuperCOSMOS Sky Survey (Hambly et al. Hambly01 (2001)), supplemented by additional counterparts extracted from Isaac Newton Telescope Wide Field Camera (INT WFC) imaging. Only candidates down to R21 were selected, with priority given to X-ray sources with 0.5-4.5 keV flux . The XWAS programme was primarily aimed at accumulating as large a sample of X-ray sources identifications as possible and is not complete to these magnitude and X-ray flux limits.
Optical spectroscopy was obtained for the potential counterparts of a total of 3000 X-ray sources (although, as the 2dF provides more fibres per field than required for this programme, a significant fraction of the spectroscopic fibres were placed on lower probability counterparts and X-ray sources with lower detection likelihoods). The XWAS 2dF spectroscopy provides an effective resolution over a wavelength range 3850-8250 Å and reaches a S/N of 5 at 5500 Å for V=21 mag, sufficient to provide reliable object classification and redshift determination together with a reasonable characterisation of the optical continuum shape.
The XWAS survey provides data of sufficient quality for the optical spectroscopic identification of 980 of the sample X-ray sources. Of these, the majority, 65%, are identified as type-1 AGN or BLAGN (velocity widths 1500 km s-1). The remainder comprise narrow emission line galaxies (NELGs; 16%, velocity widths 1500 km s-1) absorption line galaxies (6%) and Galactic stars (13%).
Corral et al. (Corral08 (2008)) computed the rest-frame X-ray averaged spectrum and constrained the mean Fe K line emission properties for type-1 AGN up to redshift 3.5 while Krumpe et al. (Krumpe08 (2008)) investigated the X-ray properties of the most luminous type-2 AGNs. In this paper we concentrate on the X-ray spectral analysis of the 487 type-1 AGN in the sample with sufficient S/N in their X-ray spectra (75 EPIC counts in the 0.2-12 keV energy band) to provide constraints on their broad band X-ray properties. The top row in Fig. 1 shows the redshift distribution of the sources (left) and the distribution of 2-10 keV luminosity vs. redshift (right). The bottom row shows the distributions of 0.2-12 keV EPIC net counts (left) and 2-10 keV fluxes (right). Fluxes and luminosities were computed from the best-fit model and corrected for Galactic absorption. Luminosities are also corrected for intrinsic X-ray absorption. The great majority of AGN, including type-1 AGN, have X-ray-to-optical flux ratios (X/O) in the range 0.1X/O10 (e.g. Brusa et al. Brusa07 (2007)). The imposed limit of R21 for optical follow-up of the XWAS sources, implies that as we approach the X-ray flux limit of the survey we are better sampling type-1 AGN with typically lower X-ray to optical flux ratios than the overall population. We note however that X-ray spectral analyses of AGN samples not suffering from this identification bias do not find that the X-ray properties of type-1 AGN vary with X/O (see e.g. Tozzi et al. Tozzi06 (2006)). Hence we do not expect the imposed limit for optical follow-up of the XWAS sources to have any impact on the results of our analysis.
We matched our type-1 sample with the 1.4-GHz NRAO VLA Sky Survey (NVSS, Condon et al. Condon98 (1998)). The survey covers the entire sky north to -40 deg declination, hence we have radio coverage for 410 out of the 487 objects in our sample. Only 10 objects were detected above the NVSS completeness limit of 2.5 mJy. Therefore we expect the contribution to our sample from radio-loud AGN to be less than 3%, and hence our sample to be dominated by radio quiet AGN.
2.1 The X-ray data
We searched the XMM-Newton archive for all the available observations of XWAS sources. The number of XMM-Newton fields that overlap with the original XWAS selected pointings at the time of this study was 119 observations in total.
In order to get the X-ray source list for each observation we used the same source detection configuration as in the second XMM-Newton serendipitous source catalogue, 2XMM (see Watson et al. Watson08 (2008) for details). Source detection is carried out on data of the three EPIC cameras (pn, MOS1 and MOS2) and on five energy bands simultaneously (0.2-0.5 keV, 0.5-1 keV, 1-2 keV, 2-4.5 keV and 4.5-12 keV). The final XWAS X-ray source catalogue includes all detections with EPIC 0.2-12 keV detection likelihood 6 and contains 7000 unique X-ray sources.

3 Spectral analysis
3.1 X-ray spectral extraction
Spectra were extracted for each detection and EPIC camera in circular regions centred at the source positions. The size of the source extraction regions was selected to optimise the S/N via the SAS task eregionanalyse. Background spectra were obtained in annular regions centred at the source position after masking out nearby sources falling in the extraction regions. If the background region did not have sufficient S/N we used source-free circular regions near the sources and in the same CCD. Appropriate response matrices and effective area curves were obtained for each detection using the SAS tasks rmfgen and arfgen respectively.
For each source all detections were merged to obtain a pn and a single MOS spectrum over the observed energy range 0.2-12 keV. As the differences between the MOS1 and MOS2 response matrices are of just a few per cent we created combined MOS source and background spectra and response matrices. Merged source and background spectra were obtained by adding the individual spectra. Backscale values (size of the regions used to extract the spectra) and calibration matrices for the combined spectra were obtained weighting the input data with the exposure times. In order to use the minimisation during the spectral fitting spectra were grouped to a minimum of 15 counts per bin.
3.2 Spectral fitting
The spectral fitting of the 487 XWAS type-1 AGN with more than 75 EPIC counts in the 0.2-12 keV band was carried out with the XSPEC package (Arnaud Arnaud96 (1996)). Hereafter quoted errors refer to the 90% confidence level for one interesting parameter (i.e. =2.71) unless otherwise stated. We started with a joint fitting of MOS and pn spectra with a power-law model with fixed Galactic absorption ( in XSPEC). The spectral parameters were tied to the same value while the normalisations were left free to vary in order to account for flux cross-calibration discrepancies between the EPIC MOS and pn cameras (see Mateos et al. Mateos09 (2009)). The Galaxy H column density values for each field were obtained using the ftool nh111http://heasarc.nasa.gov/lheasoft/ftools/. The values are derived from the HI map of Dickey & Lockman (Dickey90 (1990)). Two additional model components were added to the simple power-law model to search for intrinsic absorption and soft excess emission: a redshifted neutral absorption component ( in XSPEC) and a blackbody spectrum ( in XSPEC). We also used a partial covering model ( in XSPEC) to fit the spectral complexity observed in some of our sources, but we found that the quality of the fits did not improve significantly for any source with respect to the above models.
The significance of the detection of additional components in the X-ray spectra of our sources was measured with the F-test. The F-test measures the significance of a change in when new components are added to the model. We used a significance threshold of 99% to accept the detection of soft excess and/or intrinsic absorption. No more spectral complexity was detected, hence there was no need for additional model components. The lack of detection of the Fe K line emission is likely due to the fact that most spectra do not have sufficient S/N to detect this spectral component. However, it has also been shown that the most luminous AGN do not tend to reveal iron emission (e.g. Corral et al. Corral08 (2008); Krumpe et al. Krumpe08 (2008); Iwasawa & Taniguchi Iwasawa93 (1993)).


Fig. 2 shows the quality of the spectral fitting, where the best-fit values are shown as a function of the number of degrees of freedom (ndof) of the fits. The solid line indicates the value corresponding to =ndof. The upper and lower dashed lines indicate for a given number of ndof the range of above and below which we expect a 1% probability of finding such high/low values of if the model is correct. We see that the quality of our fits is very good, only 5% and 1% of the fits have values that lie above or below the region delineated by the dashed lines respectively.
| Model | |
|---|---|
| (1) | (2) |
| 430 (88.3%) | |
| 17 (3.5%) | |
| 38 (7.8%) | |
| 2 (0.4%) |
(1) XSPEC model definition: : Simple photon power-law. : Rest-frame photoelectric absorption. : A redshifted blackbody spectrum. All models include Galactic absorption (). (2) Number and fraction of objects best fitted with the indicated model.
A summary of the results of the spectral fitting is presented in Table 1. As expected most of our type-1 AGN are best fitted with a simple power-law model corrected for Galactic absorption. Excess X-ray absorption above the Galactic value and a soft excess emission were detected in 4% and 9% of the sources respectivelly. We used the recipe in Mateos et al. (2005a ) to obtain the intrinsic fraction of objects with detected soft excess and/or intrinsic absorption. The method takes into account the expected number of spurious detections (1% expected for the chosen F-test significance threshold) using Bayesian statistics. We found that intrinsic absorption and soft excess emission were detected with a significance 99% in 3%1.5% and 7.3%2% of the sources respectively.
4 Results and discussion
4.1 The broad band X-ray continuum
Fig. 3 (top) shows the distribution of best-fit values (solid line). In order to constrain the mean continuum shape of our type-1 AGN, , we have assumed that the distribution of spectral slopes can be well reproduced with a Gaussian of mean and dispersion . The best simultaneous estimates of the average photon index and the intrinsic spread were obtained with a maximum likelihood technique accounting for both the errors in the measurements and the intrinsic dispersion of values (Maccacaro et al. Maccacaro88 (1988)). Fig. 3 shows the best-fit Gaussian distribution (top, dashed line) and the 1, 2 and 3 contours for the two parameters together with the best-fit values, and (cross). The errors in the parameters were obtained from the 1 contour. These values are in excellent agreement with recent measurements of the mean photon index and intrinsic dispersion for type-1 AGN found in the literature (e.g. Young et al. Young09 (2009); Dadina Dadina08 (2008); Mainieri et al. Mainieri07 (2007), Page et al. Page06 (2006); Mateos et al. 2005a , Mateos et al. 2005b ). We note that hard X-ray selected samples ( 20 keV) from the INTEGRAL and Swift satellites report marginally flatter spectral slopes for bright type-1 AGN, 1.7-1.8 (Molina et al. Molina09 (2009); Winter et al. Winter09 (2009); Panessa et al. Panessa08 (2008)). This could be explained if these surveys are biased towards sources with flatter spectral slopes or with a substantial Compton reflection component as these objects should be more easily detected at such high X-ray energies.


4.1.1 Dependence of on the flux, luminosity and redshift
We have investigated whether the continuum shape of type-1 AGN depends on the soft (0.5-2 keV) X-ray flux, hard (2-10 keV) X-ray luminosity and redshift of the sources. Fluxes and luminosities were computed from the best-fit model and corrected for Galactic absorption. Luminosities are also corrected for intrinsic X-ray absorption. We use hard X-ray luminosities because the measurements are less affected by uncertainties in the detected amount of X-ray absorption. However, to investigate the dependence of the spectral index on flux we used fluxes in the 0.5-2 keV band. For samples of objects derived by using different energy bands simultaneously in the source detection procedure such as this, the number of objects detected only in the soft band increases at faint hard (2-10 keV) fluxes. This is due to the fact that at faint 2-10 keV fluxes it is more difficult to detect sources with flat spectral slopes because their emission peaks at energies above 2 keV where the sensitivity of the X-ray detectors is much lower. As already stated in Mateos et al. (2005a ; see Fig. 6 in that paper) this produces an apparent softening of the objects’ mean spectral index as we approach the survey limit in the hard band.
The left column in Fig. 4 shows the distributions of best-fit values vs. flux, luminosity and redshift. For reasons of simplicity error bars in the individual measurements are not shown on the plot. The error bars at the top of the plots indicate the mean error in . A Spearman rank correlation test indicates that correlates with the soft X-ray flux (=0.18, prob=1), in the sense that fainter objects have flatter continuum slopes. On the other hand seems to be anti-correlated with both the hard X-ray luminosity (=-0.17, prob=1) and redshift (=-0.14, prob=2), i.e. becomes flatter at higher luminosities and redshifts. These trends become more evident when plotting instead of , binned in flux, luminosity and redshift (Fig. 4 right column). The bins were defined to have at least 50 measurements per bin. Note the different scales used on the right hand plots in Fig. 4 compared to the corresponding figures on the left. Mean values were obtained with the maximum likelihood method described before (squares) while the corresponding errors are the measured intrinsic dispersion of for each bin. It is unlikely that the observed trends are affected by outliers in the distribution of values in each bin, as these typically correspond to spectra with low S/N and hence larger associated uncertainties, and we accounted for the uncertainties in the computations of .

We have investigated whether the spectral complexity in type-1 AGN can explain the observed trends in . At rest-frame energies below 2 keV, intrinsic X-ray absorption and soft excess emission are important contributors to the X-ray spectra of AGN. Nevertheless, at low redshifts accurate constraints of become more difficult especially in the low count statistics regime, as the detection of soft excess or excess absorption might not be significant enough to be accepted by our adopted detection threshold (F-test99%). Furthermore, the typical absorbing column densities detected in type-1 AGN do not exceed a few , and hence are more difficult to detect especially at high redshifts where the signatures of absorption shift outside the observed band-pass. Undetected spectral complexity can have an important effect on the measured values of as even moderate absorption () can still produce apparently flatter spectral slopes than the canonical value for type-1 AGN. In Fig. 4 (left) we see a number of objects in our sample with best-fit values deviating more than 3 from the mean. We found that all the objects with significantly flatter spectral slopes (31 objects with 1.4) show curvature at the lowest energies, however the signatures of absorption are not strong enough to be statistically detected in the fitting process. Undetected X-ray absorption can explain the apparent hardening of the mean continuum shape of our objects at faint soft fluxes, as the S/N of the spectra decreases with the flux as indicated in Fig. 4 (top-left). On the other hand a steepening of the spectra at the softest energies, indicative of soft excess emission, was clearly present in the objects with the softest spectral slopes in our sample. However, in all cases the signature of this component was not strong enough to be detected above our significance threshold.
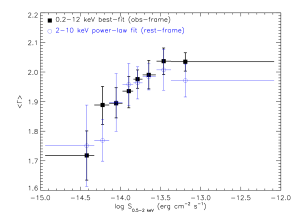
In order to further investigate the scatter in the observed at different fluxes, redshifts and luminosities, we fitted the X-ray spectra of the sources in the 2-10 keV rest-frame band a power-law model as the measured hard X-ray continuum of type-1 AGN is expected to be less affected by soft excess emission and/or absorption. We fitted only sources with at least 50 EPIC counts in the 2-10 keV rest-frame band (60% of the sources in the total sample). We checked that the objects with enough S/N in their 2-10 keV rest-frame spectra have the same 0.5-2 keV flux, 2-10 keV luminosity and redshift distributions as the total sample. The mean continuum shapes measured in this way are shown in Fig. 4 (right column, circles). In this case we have not used the maximum likelihood analysis to compute as the typical number of sources per bin is only 25-30. The mean spectral slopes were obtained by weighting with the errors in the individual measurements while the error bars correspond to the 1 dispersion in the values. We found that the spectral fitting in the 2-10 keV rest-frame band returned a substantially harder at the lowest luminosities. Because these objects are detected at the lowest redshifts sampled by our survey it is not surprising to find that the 2-10 keV rest-frame fits returned a substantially harder at low redshifts. It is interesting to note that we still find sources at high redshifts (2) to be marginally flatter than those at lower redshifts () even when only rest-frame energies above 2 keV are used in the spectral fitting.
4.1.2 The mean type-1 AGN spectrum vs. redshift
In order to understand the origin of the variation of the mean continuum shape of type-1 AGN as a function of redshift and luminosity we stacked the spectra of the objects in each bin of redshift. The co-addition of spectra in such a way blurs narrow features (such as iron line emission), however this is not a problem for our analysis as we are interested only in measuring broad band spectral features. The co-added spectra were obtained following the recipe in Appendix A in Mateos et al. (2005b ). At high energies the S/N of the spectra decreases substantially and the uncertainties associated with background subtraction become much larger. Hence we only stacked spectra from 0.5 keV (to minimise EPIC calibration uncertainties at the lowest energies) to 8 keV (observed frame). The stacked spectra were shifted to rest-frame energies using the mean redshift of each bin. Fig. 5 shows both the unfolded stacked spectra (data points) and a power-law model 222 where N is the number of photons, E the photon energy, A the normalisation and is the photon index. in units of (horizontal solid lines) with photon index =2 (mean spectral index of the broad band X-ray continuum of our objects). The vertical line shows the energy where we expect the iron fluorescence (Fe K) line emission. Also indicated are the redshift range and mean 2-10 keV luminosity of each bin. The normalisations are arbitrary. We only show for clarity pn stacked spectra, however MOS and pn results are consistent. We checked that the stacked spectra are not dominated by bright objects in the bins.
| (1) | (2) | (3) | (4) |
|---|---|---|---|
| 0.31 | 1.690.03 | 0.110.01 | 1.600.07 |
| 0.74 | 2.020.04 | 0.090.01 | 1.830.10 |
| 0.94 | 1.970.03 | - | 1.960.08 |
| 1.19 | 2.010.03 | - | 1.930.04 |
| 1.45 | 1.930.06 | - | 2.010.17 |
| 1.74 | 1.990.05 | - | 1.910.11 |
| 2.01 | 1.810.05 | - | 1.810.12 |
| 2.56 | 1.810.05 | - | 1.770.20 |
(1) Mean redshift in bin. (2) Best-fit value. (3) Rest-frame temperature of the blackbody model (in keV) used to fit the soft excess component. (4) Best-fit from a power-law fitting in the 2-10 keV rest-frame band. Errors are 90% confidence.
The results of fitting the co-added spectra are summarised in Table 2. The spectra of objects at redshifts above 0.9 were best fitted with a simple power-law model. Cold absorption was required in all spectra, however the measured values were consistent with typical Galactic values (). At lower redshifts a soft excess component was detected with an F-test significance 99.99%. We best modelled this component with a thermal blackbody. The measured temperatures are listed in Table 2. For comparison we also show in Table 2 the best-fit spectral slopes obtained by fitting the spectra with a power-law in the 2-10 keV rest-frame band. The results of this analysis show the same dependence of on the redshift as found in Fig. 4, i.e. the mean continuum shape of our objects becomes substantially harder (0.2-0.3) at the lowest and highest redshifts sampled by our survey.
An apparently harder spectral slope could be ascribed to the net effect of stacking spectra with different amounts of X-ray absorption and marginally different redshifts. Another possible explanation for the hard spectral slope could be a hardening of the continuum at the highest energies due to the presence of the Compton reflection bump. However, reflection is unlikely to explain the hard at the lowest redshifts as the reflection component only becomes important at rest-frame energies above 10 keV, which are not sampled in our lowest redshift bin. Furthermore a power-law fit to the stacked spectrum at rest-frame energies above 4 keV (where no effect from X-ray absorption is expected) resulted in a steeper spectral slope, =1.90.2. Therefore our results indicate that the overall harder spectral slope at the lowest redshifts is an effect of X-ray absorption.
At high redshifts absorption is unlikely to explain the measured harder continuum of the objects, as at redshifts 2 we expect most of the spectral signatures of moderate absorption to be shifted outside the observed band-pass. The flattening of could be the result of the redshifting of the Compton reflection bump into the observed band and/or the redshifting of the soft excess outside the observed band. However, no strong indications for spectral evolution of type-1 AGN have been detected so far, as the power-law slopes of high redshift QSOs (out to 4) have been constrained to a value 2 (Just et al. Just07 (2007); Shemmer et al. Shemmer06 (2006); Vignali et al. Vignali05 (2005)). It is therefore unlikely that the Compton reflection bump is producing the overall flatter spectral slopes in our sources.
4.1.3 Effect of the object detection efficiency on the measured
We have investigated whether the flatter spectral slope for high redshift sources can be explained by the dependence of the efficiency of detection of the XMM-Newton EPIC cameras on the spectral shape of the objects: in high redshift objects we are sampling rest-frame energies above 10 keV and hence harder sources might be more easily detected than steep spectrum sources or sources with no reflection component. This is related to the fact that source detection with X-ray telescopes is in photons rather than in flux, hence different flux limits are sampled for sources with different intrinsic spectra (Carrera et al. Carrera07 (2007); Della Ceca et al. Ceca99 (1999); Zamorani et al. Zamorani88 (1988)).
In order to constrain the importance of this effect we have simulated power-law spectra with different continuum shapes at different redshifts. We have performed the simulations using response files for the EPIC pn camera only, although the results of this analysis also apply to the EPIC MOS cameras. We required the simulated spectra to have a 0.2-12 keV flux of , typical for the objects in our sample. At each redshift we found the luminosity that corresponds to the selected flux for a typical spectral slope =1.9. Then we used that luminosity to obtain the normalisation of the simulated spectra as a function of the spectral index. We then computed the number of counts in the 0.2-12 keV band.
The change in detection efficiency as a function of redshift and spectral slope is shown in Fig. 6, where the y-axis represents the detected number of counts in the broad 0.2-12 keV band normalised to the number of counts detected for a power-law spectrum with =1.9. The top axis shows the luminosities that were used to normalise the spectra at different redshifts. It is evident that there is a strong dependence of the sensitivity of detection of objects on the spectral shape and this also has a strong dependence on redshift. As we move to higher redshifts the efficiency of detection of soft objects decreases substantially while the efficiency of detection of hard objects increases. Therefore in flux limited samples such as this, the strong dependence of the efficiency of detection on the spectral shape at different redshifts could produce the apparent hardening of the mean continuum shape of objects detected at high redshifts: as we move to higher redshifts, at the flux limit of the survey we better detect objects in the ’hard tail’ of the distribution of continuum spectral slopes. This effect was already noted by Francis et al. (Francis93 (1993)), who pointed out that the range of continuum slopes has an important effect upon the measured spectral evolution of the AGN population. Because of this important effect we cannot confirm whether the intrinsic broad band continuum of type-1 AGN has any dependence on redshift (and hence on the hard X-ray luminosity) without doing extensive simulations, which are beyond the scope of this paper.

There have been claims in the literature of an anti-correlation between the spectral slope and the hard X-ray luminosity, in the sense that the X-ray spectral slope hardens at higher luminosities (e.g. Young et al. Young09 (2009); Saez et al. Saez08 (2008); Page et al. Page05 (2005)). However, other studies find the opposite correlation, i.e a softening of the spectral slope at higher luminosities (Dai et al. Dai04 (2004)) or no correlation at all (e.g. George et al. George00 (2000); Reeves & Turner Reeves00 (2000); Winter et al. Winter09 (2009)). The detected hardening of the spectral slope at higher hard luminosities in our sample is dominated by the two lowest luminosity bins where the uncertainties in the measurements of are larger due to spectral complexity. Indeed, at luminosities above seems to remain fairly constant over two orders of magnitude in luminosity, so we do not have strong indications of a dependence of the spectral slope with the 2-10 keV luminosity. We note also that the strong dependence of the sensitivity of detection of sources on the spectral shape must have an impact on the measured mean continuum shapes at different luminosities in flux limited samples due to the strong correlation of the X-ray luminosity and redshift in these surveys.
4.2 X-ray absorption
We did not detect absorption in excess of the Galactic value in most of our type-1 AGN. Only the spectra of 19 objects out of 487 showed strong enough signatures of absorption to be detected above our significance threshold. This value corresponds to 3% of the objects after taking into account the spurious detections for the selected F-test significance. Furthermore, a number of objects in our sample have best-fit values deviating more than 3 from the mean (see Fig. 4). Using a fixed spectral slope of =1.9 we detected substantial X-ray absorption in all sources with typical measured column densities . Previous studies of type-1 AGN selected in the optical (Piconcelli et al. Piconcelli05 (2005)) and X-ray band (Mainieri et al. Mainieri07 (2007); Page et al. Page06 (2006); Mateos et al. 2005b ; Mateos et al. 2005a ; Caccianiga et al. Caccianiga04 (2004); Perola et al. Perola04 (2004); Barcons et al. Barcons02 (2002)) report a fraction of absorbed type-1 AGN of 10% or less, i.e marginally higher than our reported value, however most of these studies used lower confidence thresholds when applying the F-test. However, accounting for all sources with measured flat spectral slopes, the fraction of X-ray absorbed objects in our sample increases to 8%, a value entirely consistent with previous measurements.


The distribution of absorbing column densities for our type-1 AGN is shown in Fig. 7. The measured amounts of X-ray absorption are , i.e. lower than the amount of absorption typically detected for type-2 AGN (Krumpe et al. Krumpe08 (2008); Mateos et al. 2005b ). Only one object shows an absorbing column density substantially above , but with very large uncertainty. Fig. 8 shows the distribution of X-ray absorption as a function of redshift and 2-10 keV luminosity. We do not see any clear correlation amongst these parameters. We only find a marginal indication that the minimum detected column density increases with redshift. However, this effect can easily be explained in terms of absorption being redshifted towards lower energies and further decreased by a factor (Barger et al. Barger02 (2002)).
We found little or no evidence for X-ray absorption in the great majority of our type-1 AGN, in line with AGN unification models. However 3% of type-1 AGN show substantial absorption in X-rays. The apparent mismatch between the optical classification and the X-ray properties of these objects is a challenge for the simplest AGN unification model where the type-1/type-2 AGN classification is due solely to an orientation effect.
Dedicated monitoring of a few bright AGN has found strong variations in X-ray absorption on time scales as short as a few hours (Risaliti et al. Risaliti02 (2002)). These results put tight constraints on the location of the X-ray absorber, suggesting that the toroidal obscuration region used in the AGN unification schemes to explain the observed AGN diversity might be co-spatial with the broad line region. In the clumpy torus models recently presented by Nenkova et al. (Nenkova08 (2008)) there is a physical reason that could explain the detection of absorption in a fraction of type-1 AGN: the broad line region clouds located inside the dust sublimation radius are dust free, and hence affect X-rays but not the optical. In this scenario optical extinction should always be lower that the expected value assuming the Galactic dust-to-gas ratio as it is typically observed (Maiolino et al. 2001a ). On the other hand, it has also been suggested that if the dust composition in the circumnuclear region of AGN has different properties than in the Galactic diffuse interstellar medium, for example if it is dominated by large grains, this medium will be less effective in absorbing the optical/UV radiation (Maiolino et al. 2001b ).
A large fraction (50%) of both Seyfert 1s and QSOs show signatures of highly ionised gas along the line of sight, the so-called ’warm absorber’, in their X-ray spectra (e.g. Piconcelli et al. Piconcelli05 (2005); George et al. George98 (1998)). These absorbers, probably associated with outflowing winds, have been found to show a wide range of ionisation, have typical outflowing velocities of a few hundred km s-1 and have column densities in the range . Warm absorption could also explain the apparent mismatch between the optical and X-ray classification in our absorbed type-1 AGN.
4.3 Soft excess
A strong broad excess emission at energies below 2 keV with respect to the extrapolation of the 2-10 keV continuum, known as soft excess, is known to be an important component of the X-ray spectra of Seyfert 1 galaxies and radio-quiet quasars (e.g. Porquet et al. Porquet04 (2004)). The nature of the soft excess emission in unobscured AGN is still one of the open questions in our understanding of the emission properties of AGN.


In order to search for this spectral component we have used a thermal blackbody model that, to a first order approximation, can model the thermal emission from an optically-thick accretion disk. We also fitted soft excess signatures with a partial covering model but in all cases we obtained better quality fits with the blackbody model. Soft excess has been detected in 40 objects with an F-test significance 99%. Considering only objects at redshifts below 0.5, where most soft excess emission is detected, we found that the fraction of objects with detected soft excess increases to 36%. A soft excess emission component seems to be very common in type-1 AGN. For example, studies based on ASCA (George et al. George00 (2000); Reeves & Turner Reeves00 (2000)) reported the detection of soft excess emission in 50-60% of the objects while in a more recent study of a sample of QSOs from the Palomar-Green (PG) Bright Quasar Survey this spectral component was detected in 90% of the objects (Piconcelli et al. Piconcelli05 (2005)).


Taking into account the fraction of spurious detections we detected soft excess in 7.3%2% of the full sample of XWAS type-1 AGN at all redshifts. That this value is so much lower that 36% is quite plausibly a consequence of the soft excess being redshifted below the EPIC energy range for a large fraction of our XWAS spectra, and hence 7.3% can be considered as a very conservative lower limit to the fraction of type-1 AGN with soft excess emission.
We searched for warm absorbers in our objects with detected soft excess emission fitting the spectra with the warm absorber model absori in XSPEC. In all cases the warm absorber did not provide a good quality fit to the data. Therefore here we describe the properties of the soft excess emission fitted with the thermal blackbody model.
Fig. 9 (top) shows the distribution of measured temperatures of the soft excess component. We clearly see that the values are narrowly distributed and they tend to cluster around kT0.1 keV in the rest-frame. We constrained the mean value of the temperature of the soft excess and the amplitude of the intrinsic scatter assuming that the distribution of temperatures can be reproduced with a Gaussian of mean and dispersion . The best simultaneous estimates were obtained with a maximum likelihood technique accounting for both the errors in the measurements and the intrinsic dispersion of values (Maccacaro et al. Maccacaro88 (1988)). Fig. 9 (bottom) shows the 1, 2 and 3 contours for the two parameters together with the best-fit values (cross). The mean blackbody temperature is kT=0.0930.007 keV with intrinsic dispersion =0.0340.005 keV. This value is in excellent agreement with recent estimates in the literature (e.g. Winter et al. Winter09 (2009); Bianchi et al. Bianchi09 (2009); Crummy et al. Crummy06 (2006), Piconcelli et al. Piconcelli05 (2005); Gierliński & Done Gierlinski04 (2004)). We would like to note however that, although constraining the mean temperature of the soft excess using thermal models is a helpful measurement that can be compared with other data, it does not have any physical meaning.
As shown in Fig. 10 we find that the temperature of the thermal blackbody emission has no dependence on the redshift of the objects and is uncorrelated with the hard X-ray luminosity over more than two orders of magnitude in luminosity. This result agrees with the recent finding that the temperature of the soft excess is remarkably constant regardless of the luminosity and mass of the objects (e.g. Bianchi et al. Bianchi09 (2009); Crummy et al. Crummy06 (2006); Gierliński & Done Gierlinski04 (2004)). Fig. 10 also shows the soft excess luminosity (rest-frame 0.5-2 keV, corrected for absorption) vs. the power-law X-ray luminosity (rest-frame 2-10 keV). If we use the ratio of the soft excess and power-law X-ray luminosities to measure the strength of the soft excess, we find that in most objects the strength of the soft excess is under 60%. Furthermore, there seems to be a strong correlation between the luminosities of the soft excess and power-law components, with . This result can be explained as the combination of two different effects: first the lack of detections in the bottom-right of the plot in Fig. 10 (bottom-left) is due to the fact that it is more difficult to detect weak soft excess (strength lower than 10%) on top of a bright continuum. Second, the lack of detections in the top-left of the plot suggests that there must be an upper limit in the strength of the soft excess that exists in AGN. The strongest soft excesses have been detected predominantly in narrow line Seyfert 1 galaxies (Boroson et al. Boroson02 (2002)).
The measured soft excess blackbody temperatures are too high to be the high energy tail of thermal emission from the hot inner accretion disk (kT20-40 eV for a black hole mass of accreting at the Eddington rate, Shakura & Sunyaev Shakura73 (1973)). Furthermore, the fact that the temperatures of the soft excess are constant (0.1-0.2 keV) over such a broad range of luminosities and black hole masses is a major problem for models based on continuum emission, such as optically-thick Comptonization of accretion disk emission, because the disk temperature is expected to vary with both the mass of the black hole and the accretion rate (see Fig. 1c in Gierliński & Done Gierlinski04 (2004)). However, see Kawaguchi et al. (Kawaguchi01 (2001)) for a model in which optically-thin Comptonization is invoked to produce a soft excess with a shape that does not depend on the temperature of the disk.
Alternative models relate the soft excess to atomic rather than continuum processes which could easily explain the constancy of the temperature by the abrupt increase in opacity in partially ionised material between 0.7-3 keV especially due to at 0.6-0.7 keV as well as Ly lines from C, N and Fe L shell transitions (Ross & Fabian Ross05 (2005)). The result is a large increase in reflected/transmitted flux below 0.7 keV, which could produce the soft excess either from absorption in an optically thin material in the line of sight, for example in a wind from the disk (Gierliński & Done Gierlinski04 (2004)), or from reflection in optically thick material out of the line of sight, for example in the accretion disk (Crummy et al. Crummy06 (2006)). Both models predict sharp/strong atomic features from the partially ionised material. To explain the featureless soft excess they both require large velocity smearing which can only be produced in the vicinity of the black hole. In order to fit the strongest soft excesses detected these models require a fine tuning of the ionisation state. Because the reflected emission cannot exceed the illuminating flux, this sets a tight limit on the strength of the soft excess in the reflection model, while in the absorption model the range of measured soft excess strength can be easily reproduced by changing the amount of absorption. Both models have been found to fit the X-ray spectral signatures of soft excess in bright AGN equally well.
In an alternative scenario, it is possible that the soft excess emission does not come from the AGN but from the host galaxy (X-ray binaries, star formation, hot ionised gas). However this emission is not expected to be more luminous than (Ranalli et al. Ranalli03 (2003)). The majority of the measured luminosities of the soft excess for our sources are at least an order of magnitude above this value, hence this component is expected to originate from the AGN in our objects.
5 Conclusions
We have analysed the 0.2-12 keV broad band spectral properties of one of the largest samples of X-ray selected type-1 AGN to date, drawn from the XMM-Newton Wide Angle Survey. The sample contains 487 type-1 AGN detected up to redshift 4 and spanning more than 3 orders of magnitude in X-ray luminosity. The main results of our analysis are as follows.
-
1.
The spectra of most type-1 AGN (90%) are best-fitted with a simple power-law. Absorption and soft excess emission are detected with an F-test significance 99% in 3% and 7% of the objects respectively.
-
2.
We constrain the mean spectral index of the broad band X-ray continuum of type-1 AGN to a value of with intrinsic dispersion , in agreement with previous estimates in the literature. We find the continuum to strongly depend on the 0.5-2 keV flux, in the sense that the type-1 AGN population becomes marginally harder at fainter fluxes. Our analysis indicates that this spectral variation is likely due to undetected absorption in the faintest sources in our sample rather than to changes in the intrinsic spectral shape.
-
3.
The mean continuum shape of our type-1 AGN is found to become harder at higher 2-10 keV luminosities and at higher redshifts. At high redshifts undetected absorption is unlikely to explain the harder continuum of the objects as we expect spectral signatures of moderate absorption to be redshifted outside the observed band-pass. The flattening of could be the result of redshifting of the Compton reflection bump into the observed band and/or redshifting of the soft excess outside the observed band. However, we find that there is a strong dependence of the detection efficiency of sources on the spectral shape. Our analysis indicates that at high redshifts the efficiency of detection of hard objects increases while for soft sources it decreases substantially. This effect must have an impact on the measured mean continuum shapes of sources at different redshifts and also at different luminosities due to the tight correlation between the X-ray luminosity and redshift in flux limited surveys.
-
4.
We find little or no evidence for X-ray absorption in the great majority of our type-1 AGN, as expected from AGN unification models. However 3% of our objects show substantial absorption in X-rays. The measured amounts of X-ray absorption are typically lower than a , i.e. in the low part of the column density distribution of type-2 AGN. The recently presented clumpy torus models, where the torus is a smooth continuation of the broad line region, can provide a physical explanation for the apparent mismatch between the optical classification and the X-ray properties of these objects. In these models X-ray absorption, dust obscuration and broad line emission are produced in a single continuous distribution of clouds: the broad line region is located inside the dust sublimation radius and hence the dust-free clouds obscure the X-rays but not the optical while the torus is located outside the dust sublimation radius (dusty clouds).
-
5.
A soft excess component is detected in 40 objects in our sample, which corresponds to 7.3%2% of our type-1 AGN after taking into account spurious detections. This value should be taken as a lower limit as for high redshift objects the signatures of soft excess will be redshifted outside the observed band-pass. Indeed considering only objects at redshifts below 0.5, where most soft excess emission is detected, we found that the fraction of objects with detected soft excess increases to 36%. We constrain the properties of this spectral component with a thermal blackbody which provided the best quality fits to the data. We constrain the mean value of the temperature of the soft excess and the amplitude of the intrinsic dispersion to kT100 eV and 34 eV. We find that the temperature of the thermal blackbody emission has no dependence on the redshift of the objects and is uncorrelated with the hard X-ray luminosity over more than two orders of magnitude in luminosity. The measured strength of the soft excess, defined as the ratio of the soft excess luminosity (rest-frame 0.5-2 keV, corrected for absorption) and the power-law X-ray luminosity (rest-frame 2-10 keV), is under 60% for the great majority of our objects. Direct thermal emission from the accretion disk is ruled out as a possible origin of the soft excess on the basis of the very high temperatures detected for this component and the apparent lack of correlation of the temperature of the soft excess with AGN parameters such as the X-ray luminosity. Compton scattered disk emission is also ruled out on the basis that in the Comptonization model the shape of the soft excess should be related to the disk emission. The measured luminosities of the soft excess are at least an order of magnitude above those expected if the soft excess originates in the host galaxy (X-ray binaries, star formation, hot ionised gas) hence this component is expected to originate from the AGN in our objects.
Acknowledgements.
We acknowledge Chris Done, Bozena Czerny, Gordon Stewart, Pilar Esquej and Ken Pounds for useful comments. SM, MW and JAT acknowledge support from the UK STFC research council. We acknowledge the anonymous referee for a careful reading of the manuscript and for comments that improved the paper. FJC acknowledges financial support for this work from the Spanish Ministerio de Educación y Ciencia under project ESP2006-13608-C02-01. AC acknowledges financial support from the Spanish Ministerio de Educación y Ciencia fellowship and also from the MIUR and The Italian Space Agency (ASI) grants PRINMUR 2006025203 and n. I/088/06/0. MK acknowledges support from the NASA grant NNX08AX50G and NNX07AG02G.References
- (1) Akylas, A., Georgakakis, A., Georgantopoulos, I. 2004, MNRAS, 353, 1015
- (2) Antonucci, R. 1993, ARA&A, 31, 473
- (3) Arnaud, K. 1996, Astronomical Data Analysis Software and Systems V., ed. G. Jacoby, & J. Barnes, ASP Conf. Ser., 101, 17
- (4) Barcons, X., Carrera, F. J., Watson, M. G., McMahon, R. G., et al. 2002, A&A, 382, 522
- (5) Barger, A. J., Cowie, L. L., Brandt, W. N., et al. 2002, AJ, 124, 1839
- (6) Bianchi, S., Guainazzi, M., Matt, G., Fonseca Bonilla, N., et al. 2009, A&A, 495, 421
- (7) Bianchi, S., Corral, A., Panessa, F., Barcons, X., et al. 2008, MNRAS, 385, 195
- (8) Bechtold, J., Siemiginowska, A., Shields, J., Czerny, Bozéna, J.A., et al. 2003, A&A, 433, 855
- (9) Boroson, T. A. 2002, ApJ, 565, 78
- (10) Brusa, M., Zamorani, G., Comastri, A., Hasinger, G., et al. 2007, ApJS, 172, 353
- (11) Caccianiga, A., Severgnini, P., Braito, V., Della Ceca, R., et al. 2004, A&A, 416, 901
- (12) Cappi, M., Panessa, F., Bassani, L., Dadina, M., et al. 2006, A&A, 446, 459
- (13) Carrera, F. J., Ebrero, J., Mateos, S., Ceballos, M. T., et al. 2007, A&A, 469, 27
- (14) Condon, J. J., Cotton, W. D., Greisen, E. W., Yin, Q. F., et al. 1998, AJ, 115, 1693
- (15) Corral, A., Page, M.J., Carrera, F.J., Barcons, X., et al. 2008, A&A, 492, 71
- (16) Corral, A., Barcons, X., Carrera, F. J., Ceballos, M. T., et al. 2005, A&A, 431, 97
- (17) Crummy, J., Fabian, A. C., Gallo, L., Ross, R. R. 2006, MNRAS, 365, 1067
- (18) Dadina, M. 2008, A&A, 485, 417
- (19) Dai, X., Chartas, G., Eracleous, M., Garmire, G. P. 2004, ApJ, 605, 45
- (20) Della Ceca, R., Castelli, G., Braito, V., et al. 1999, ApJ, 524, 674
- (21) Dickey, J. M., Lockman, F.J. 1990, ARA&A, 28, 215
- (22) Francis, P. J. 1993, ApJ, 407, 519
- (23) George, I. M., Turner, T. J., Yaqoob, T., Netzer, H. 2000, ApJ, 531, 52
- (24) George, I. M., Turner, T. J., Netzer, Hagai, Nandra, K., et al 1998, ApJS, 114, 73
- (25) George, I. M., Fabian, A. C. 1991, MNRAS, 249, 352
- (26) Gierliński, M., Done, C. 2004, MNRAS, 349, 7
- (27) Haardt, F.; Maraschi, L. 1991, ApJ, 380L, 51
- (28) Hambly, N. C., MacGillivray, H. T., Read, M. A., Tritton, S. B., et al. 2001, MNRAS, 326, 1279
- (29) Iwasawa, K., Taniguchi, Y. 1993, ApJ, 413L, 15
- (30) Just, D. W., Brandt, W. N., Shemmer, O., Steffen, A. T., et al. 2007, ApJ, 665, 1004
- (31) Kawaguchi, T., Shimura, T., Mineshige, S. 2001, ApJ, 546, 966
- (32) Kelly, B. C., Bechtold, J, Siemiginowska, A., Aldcroft, T. 2007, ApJ, 657, 116
- (33) Krumpe, M., Lamer, G., Corral, A., Schwope, A. D., et al. 2008, A&A, 483, 415
- (34) Lewis, I.J., Cannon, R.D., Taylor, K., Glazebrook, K., et al. 2002, MNRAS, 333, 279
- (35) Maccacaro, T., Gioia, I. M., Wolter, A., Zamorani, G., Stocke, J. T. 1998, ApJ, 326, 680
- (36) Mainieri, V., Hasinger, G., Cappelluti, N., Brusa, M., et al. 2007, ApJS, 172, 368
- (37) Maiolino, R., Marconi, A., Salvati, M., Risaliti, G., et al. 2001, A&A, 365, 28
- (38) Maiolino, R., Marconi, A., Oliva, E. 2001, A&A, 365, 37
- (39) Mateos, S., Saxton, R. D., Read, A. M., Sembay, S. 2009, A&A, 496, 879
- (40) Mateos, S., Barcons, X., Carrera, F. J., Ceballos, M. T., et al. 2005, A&A, 433, 855
- (41) Mateos, S., Barcons, X., Carrera, F. J., Ceballos, M. T., et al. 2005, A&A, 444, 79
- (42) Molina, M., Bassani, L., Malizia, A., Stephen, J. B., et al. 2009, Accepted for publication on MNRAS (arXiv0906.2909).
- (43) Nenkova, M., Sirocky, M. M., Nikutta, R., et al. 2008, ApJ, 685, 160
- (44) Page, K. L., Reeves, J. N., O’Brien, P. T., Turner, M. J. L. 2005, MNRAS, 364, 195
- (45) Page, M. J., Loaring, N. S., Dwelly, T., Mason, K. O., et al. 2006, A&A, MNRAS, 369, 156
- (46) Panessa, F., Carrera, F.J., Bianchi, S., Corral, A., et al. 2009, Accepted for publication in MNRAS (astro-ph/0906.1974)
- (47) Panessa, F., Bassani, L., de Rosa, A., Bird, A. J., et al. 2008, A&A, 483, 151
- (48) Panessa, F., Bassani, L. 2002, A&A, 394, 435
- (49) Perola, G. C., Puccetti, S., Fiore, F., Sacchi, N., et al. 2004, A&A, 421, 491
- (50) Piconcelli, E., Jimenez-Bailón, E., Guainazzi, M., Schartel, N., et al. 2005, A&A, 432, 15
- (51) Ponti, G., Cappi, M., Genghini, M., Matt, G., et al. 2008, Memorie della Societa Astronomica Italiana, 79, 274
- (52) Porquet, D., Reeves, J. N., O’Brien, P., Brinkmann, W. 2004, A&A, 422, 85
- (53) Pounds, K. A., Nandra, K., Stewart, G. C., George, I. M., Fabian, A. C. 1990, Nature, 344, 132
- (54) Ranalli, P., Comastri, A., Setti, G. 2003, A&A, 399, 39
- (55) Reeves, J. N., Turner, M. J. L. 2000, MNRAS, 316, 234R
- (56) Risaliti, G., Elvis, M., Nicastro, F. 2002 ApJ, 571, 234
- (57) Ross, R. R., Fabian, A. C. 2005 MNRAS, 358, 211
- (58) Saez, C., Chartas, G., Brandt, W. N., Lehmer, B. D. 2008, AJ, 135, 1505
- (59) Shakura, N. I., Sunyaev, R. A. 1973, A&A, 24, 337
- (60) Shemmer, O., Brandt, W. N., Schneider, D. P., Fan, X. 2006, ApJ, 644, 86
- (61) Sobolewska, M. A., Done, C. 2007, MNRAS, 374, 150
- (62) Spergel, D. N., Verde, L., Peiris, H. V., Komatsu, E., et al. 2003, ApJS, 148, 175
- (63) Tozzi, P., Gilli, R., Mainieri, V., Norman, C., et al. 2006, A&A, 451, 457
- (64) Turner, T. J., Pounds, K. A. 1989 MNRAS, 240, 833
- (65) Urry, C. M., Padovani, P. 1995, PASP, 107, 803
- (66) Vignali, C., Brandt, W. N., Schneider, D. P., Kaspi, S. 2005, AJ, 129, 2519
- (67) Watson, M.G., Schröder, A.C., Fyfe, D., Page, C.G. 2008, A&A, 493, 339
- (68) Wilkes, B. J., Schmidt, G. D., Cutri, R. M., Ghosh, H. 2002, ApJ, 564, 65
- (69) Winter, L. M., Mushotzky, R. F., Reynolds, C. S., Tueller, J. 2009, ApJ, 690, 1322
- (70) Young, M., Elvis, M., Risaliti, G. 2009, ApJS, 183, 17
- (71) Zamorani, G., Gioia, I. M., Maccacaro, T., Wolter, A. 1988, A&A., 196, 39