X-ray spectral variability in the ultraluminous X-ray source Holmberg IX X-1
Abstract
We use XMM-Newton and Swift data to study spectral variability in the ultraluminous X-ray source (ULX), Holmberg IX X-1. The source luminosity varies by a factor 3 – 4, giving rise to corresponding spectral changes which are significant, but subtle, and not well tracked by a simple hardness ratio. Instead, we co-add the Swift data in intensity bins and do full spectral fitting with disc plus thermal Comptonisation models. All the data are well-fitted by a low temperature, optically thick Comptonising corona, and the variability can be roughly characterised by decreasing temperature and increasing optical depth as the source becomes brighter, as expected if the corona is becoming progressively mass loaded by material blown off the super-Eddington inner disc. This variability behaviour is seen in other ULX which have similar spectra, but is opposite to the trend seen in ULX with much softer spectra. This supports the idea that there are two distinct physical regimes in ULXs, where the spectra go from being dominated by a disc-corona to being dominated by a wind.
keywords:
accretion, accretion disc – black hole physics: stars: individual: Holmberg IX X-1 – X-rays: binaries.1 Introduction
Ultraluminous X-ray sources (ULXs) are X-ray sources that are too bright ( ergs s-1) to be powered by sub-Eddington flows onto a stellar remnant black hole, but are not associated with galactic nuclei so are not powered by accretion onto a central supermassive black hole. If the Eddington limit holds, then the central object must be intermediate in mass between the population of stellar remnant black holes known in our Galaxy and the supermassive black holes which form in the centres of galaxy bulges, and are therefore termed intermediate-mass black holes (IMBHs). However, there are many serious problems with such an interpretation, not least the in situ formation of the large numbers of such objects required to explain the populations of ULXs in star forming regions, that would result in an unfeasibly high fraction of mass being held in the IMBHs (King, 2004). Thus the majority of ULXs are most probably stellar remnant black holes111It is possible that stellar remnant black holes may range up to in mass if formed in low-metallicity environments, see Zampieri & Roberts (2009)., accreting at super-Eddington rates (e.g. King et al. 2001; Watarai, Mizuno & Mineshige 2001; Begelman 2002; see also Roberts 2007 and references therein), though in the absence of a direct dynamical mass measurement we cannot yet confirm this for any individual ULX. Possibly the best current IMBH candidates amongst ULXs are those with the highest observed luminosities, and those with mHz QPO detections (although see below on the latter point). However, even amongst the brightest ULXs (the hyperluminous X-ray sources, or HLXs, e.g. Gao et al. 2003) there may be explanations other than an IMBH - for example, the HLX reported by Miniutti et al. (2006) has subsequently been revealed to be a background QSO (G. Miniutti, private communication), and the record-breaking HLX reported by Farrell et al. (2009) may turn out to be the stripped nucleus of a dwarf galaxy (Soria et al. 2009).
The bulk of the ULX population therefore probably probes a new mode of accretion onto stellar-remnant black holes, different to the sub-Eddington states that are well studied from observations of black hole binaries (BHBs) in our own Galaxy (see e.g. the reviews by Remillard & McClintock 2006 hereafter RM06; Done, Gierlinski & Kubota 2007 hereafter DGK07). Thus they can constrain models of super-Eddington accretion flows, which have wider impact than just ULXs. In the local Universe, these flows power objects such as the unique BHB GRS 1915+105, and the puzzling narrow line Seyfert 1s. They also have cosmological significance as super-Eddington flows are required in the early Universe in order to quickly build up black hole mass to form the first quasars. ULXs can then give a template for understanding super-Eddington accretion flows, in a similar way to that of the BHBs for sub-Eddington flows.

For BHBs the extensive, high quality monitoring data available means that their spectral variability as a function of luminosity can be studied for individual objects as well as for the class as a whole. This has given rise to a well defined picture, where at low luminosities the spectra are dominated by a hard power-law tail extending out to keV. The thermal emission from an optically thick disc starts to become more important, increasing in both temperature and luminosity as the source brightens. This is correlated with a softening of the power-law tail, which pivots towards (low/hard state: LHS). The spectrum then makes an abrupt transition to the high/soft state (HSS) where the disc dominates the spectrum, though this is generally accompanied by a weak non-thermal tail to high energies with . In this state the disc varies with as expected for a constant inner disc radius. However, at these high luminosities the non-thermal tail can also become strong, carrying a large fraction of the power, at which point the disc spectrum is strongly distorted by this Comptonisation (very high or steep power-law state: VHS) see e.g. the reviews by RM06; DGK07.
By contrast, the much lower flux from ULXs means instead that there are typically only snapshot observations of individual objects, so putting together a picture of the spectral variability is much more difficult. Nonetheless, this has been attempted, though the limited quality of the data mean that often the spectra can be equally well described by power-law or disc models, which obviously confuses the spectral state identification (e.g. Gladstone & Roberts 2009). Kubota, Done & Makishima (2002) used two ASCA observations of IC 342 to track the spectral change of the two ULXs in this field. Both ULXs show a transition between a clearly curved spectrum which can be fit with a disc model, to one which can be fit by a power-law. Previous work has interpreted such changes as being from the HSS to LHS, and as this transition generally occurs at sub-Eddington luminosities then this would favour an IMBH. Kubota et al. (2002) instead showed that this could be interpreted as the much higher luminosity HSS to VHS transition, consistent with a stellar remnant black hole. ‘Spectral transitions’ from sparse observations of other ULXs have also been discovered (Mizuno, Kubota & Makishima, 2001; Dewangan et al., 2004; Feng & Kaaret, 2006; Isobe et al., 2009; Soria et al., 2009a), but the results are confusing, for example some ULXs have spectra which become harder as they become brighter, while others show the opposite trend. Recent work by Feng & Kaaret (2009) and Kajava & Poutanen (2009) has begun to systematically analyse XMM-Newton data for individual ULX variability patterns, and interpret it in a physical framework.
Another approach is to use higher signal-to-noise data from many different ULX to try to delineate the spectral changes as a function of luminosity, though this is complicated by the fact that ULXs are likely to be a heterogeneous population of X-ray sources, in terms of black hole mass and viewing angle. Generally these spectra are fit with disc plus power-law models, and the derived disc temperatures are sometimes low, 0.2 keV, which (if taken at face value) implies a high black hole mass of 103 (e.g. Miller et al. 2003; Kaaret et al. 2003; Miller, Fabian & Miller 2004). While this initially supports the IMBH LHS interpretation, these higher quality data also clearly show that the accompanying power-law tail curves at the highest energies, with a deficit of photons above 5 keV (Stobbart, Roberts & Wilms 2006; Miyawaki et al. 2009). Such curvature is never seen in the BHB LHS at these low energies, arguing against a simple IMBH interpretation for these objects on the basis of their X-ray spectra. On a similar theme, the few tens of mHz QPOs seen in some ULXs imply IMBHs if the observed QPOs are the direct analogues of the strong low frequency type-C QPOs seen in BHBs at 1-10 Hz (e.g. Strohmayer & Mushotzky 2009). However, we note that the likely super-Eddington, BHB GRS 1915+105 can show QPOs at similarly very low frequencies (Morgan, Remillard & Greiner 1997, Hoel, Vaughan & Roberts 2009). Such QPOs are then clearly not an unambiguous signature of IMBHs.
The highest quality X-ray spectra are actually much better fitted by disc plus low temperature, optically thick Comptonisation models (Stobbart et al. 2006; Roberts 2007; Gladstone, Roberts & Done 2009). Using this description, Gladstone et al. (2009) sorted the 12 best available XMM-Newton ULX spectra into a possible luminosity sequence, starting from a disc dominated, bright high/soft state at around the Eddington limit. For higher mass accretion rates they suggested an increasing fraction of the power is dissipated in a corona which covers the inner disc. This corona increases in optical depth and decreases in temperature as the source brightens, perhaps due to the increase in mass loss from the inner disc for these super-Eddington flows. At the highest luminosities the corona is strongly outflowing, giving rise to an increasingly large photosphere around the source which thermalises the energy to progressively lower temperatures (e.g. Kawashima et al. 2009; Begelman, King & Pringle 2006; Poutanen et al. 2007).
While plausible, such models must be tested on individual objects where the mass and inclination of the black hole are fixed since ULXs seem likely to be a heterogeneous population, as stressed above. SWIFT has been conducting a monitoring program for some ULXs in recent years (Moore & Miller, 2008; Kaaret & Feng, 2009). In our present study, we use the data obtained from the most intensive of these, that of Holmberg IX X-1 (also historically known as M81 X-9). This source is located close to the dwarf galaxy Holmberg IX ( Mpc) and is the brightest X-ray source within 20 arcminutes of the nucleus of M81 (La Parola et al., 2001). This is also one of the ULXs that has been most widely studied in the past ten years (La Parola et al., 2001; Wang, 2002; Miller et al., 2004; Dewangan, Griffiths & Rao, 2006; Tsunoda et al., 2006; Kaaret & Feng, 2009). However, all these either used hardness ratios to follow the spectral variability, or at best fit disc plus power-law models. Here we choose to follow the spectral variability of Holmberg IX X-1 from the Swift monitoring data, but model this in detail using the disc and low temperature, optically thick Comptonisation which is required to fit the highest quality XMM-Newton data from this source (Stobbart et al., 2006; Gladstone et al., 2009). Section 2 describes how we extract and bin the intensity sorted spectra, while Section 3 gives details of the spectral fitting results. Section 4 describes how these broadly fit into the Gladstone et al. (2009) picture of spectral variability described above, but also shows the need for better data to understand these trends.
2 Data
We use only those Swift XRT observations that are pointed at Holmberg IX X-1, so we can directly compare instrument count rates rather than having to correct for the different instrument response of off-axis pointings. This gives a total of 75 pointings, each typically with s exposure, from Swift program 00090008, covering the whole monitoring program of Kaaret & Feng (2009) up to July 2009. In addition, we also use 7 observations from Swift program 00035335 during 2006 – 2007. These are longer observations (up to 20ks) but have a much sparser coverage of the light curve.
We extract the photon counting mode of the Swift pointed observation data using the Swift-specific ftool xrtpipeline to obtain clean event files. We use standard data selection criteria, with minimum elevation angle (ELV) set to be larger than 45∘, the bright Earth (BREARTH) angle set to be above 120∘, minimum Sun and Moon angle (SUNANGLE and MOONANGLE) above 45∘ and 30∘, respectively, and pointing direction within 0.08∘ of the source. We then extract spectra for both source and background from grades 0 – 12 within a 47 arcsec (20 pixels) radius region centred on the ULX. A background spectrum was extracted from a same-sized aperture on the edge of the field-of-view.
Fig. 1 (upper panel) shows the resulting light curve for these data over the 0.3 – 10 keV band. Plainly the source is persistent, but variable by a factor of 3 – 4 in intensity. We also show the hardness ratio (HR) for these data, defined using the standard Swift XRT hard and soft energy bands as the rate from 1.5 – 10 keV divided by the rate from 0.3 – 1.5 keV. The lower panel on Fig. 1 shows that this HR does vary, but with large uncertainties associated with the short observations. We show the variation of HR with intensity in Fig. 2, where the 7 data points from the 2006 – 2007 observations are shown in (magenta) filled stars while those from the monitoring program are shown as (cyan) crosses. This shows that the spectrum hardens slightly as the luminosity increases, as seen in the analysis of these data by Kaaret & Feng (2009) (although their hardness ratio is defined slightly differently, as a ratio of 1 – 8 keV/0.3 – 8 keV).
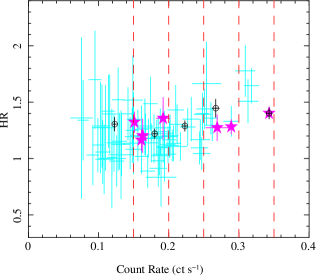
We co-add observation data in order to increase signal-to-noise. We define 5 count rate ranges as detailed in Table 1 to have roughly (within a factor 3) equal numbers of total counts as shown by the (red) dotted lines on Fig. 2. Data within these ranges are consistent with the same HR except for SWIFT 5, the highest intensity bin, where the long observation in 2006 has a slightly but significantly softer spectrum than the ones from the monitoring campaign. These data cannot be co-added as their spectra are not consistent. Hence we include the 2006 data only for this intensity bin as this has higher statistics.
| Name | count rate | total counts | Swift and XMM-Newton Obsid |
|---|---|---|---|
| SWIFT 1 | 0.00-0.15 | 4882 | M04, M12, M13, M14, M17, M18, M26, M28, M34, M45, M46, M47, M65, M66, |
| M67, M68, M69, M70, M71, M72, M73, M75, M76, M77, M78, M79, M81, M82. | |||
| SWIFT 2 | 0.15-0.20 | 11733 | M11, M15, M19, M22, M25, M29, M30, M31, M32, M33, M36, M38, M41, M44, |
| M48, M49, M50, M52, M54, M55, M56, M57, M58, M64, L01, L02, L07, L09. | |||
| SWIFT 3 | 0.20-0.25 | 7143 | M02, M03, M05, M07, M20, M21, M23, M24, M39, M43, M59, M60, M61, M62, |
| M63. | |||
| SWIFT 4 | 0.25-0.30 | 6551 | M08, M09, M10, M40, M42, L05, L06. |
| SWIFT 5 | 0.30-0.35 | 6773 | L04 |
| XMM1 | 114000 | 0200980101 | |
| XMM2 | 12800 | 0112521001 | |
| XMM3 | 16000 | 0112521101 |
We add the spectra of each count-rate group using the addspec ftool. As recommended, the response files are weighted with their counts. The differences between the auxiliary response files (*.arf) over all data sets in each count-rate range is less than 10%. We include the hardness ratios from these co-added spectra on the hardness ratio-intensity plot (Fig. 2) as the large open circle (black) points. For the purposes of spectral fitting, the data were binned with at least 20 counts in each bin.
We also include the long exposure (114ks) XMM-Newton data of Holmberg IX X-1 from Gladstone et al. (2009), hereafter termed XMM1 (observation ID 0200980101, taken on 2004-09-26). The spectrum of this XMM-Newton data is reduced by using the same method as in Gladstone et al. (2009). These data have very similar 0.3 – 10 keV flux to that of the lowest luminosity Swift spectrum. However, its hardness ratio (when calculated independently from the instrument response using model fluxes in the bands) is significantly softer, closest to that from SWIFT 4. This clearly shows that the variability is not simply a function of luminosity, and that there is extra complexity present.
There are two other XMM-Newton data sets available in the archive (hereafter XMM2 and XMM3). These are all between XMM1 and SWIFT 2 in intensity, so do not span much of a range in flux. They also span the range in shape between XMM1 to SWIFT 2, so do not add to the spectral variability but we include them for completeness.
3 Model fitting and results
In some earlier studies, XMM1 data was conventionally analysed using the ’standard’ disc plus power-law model (e.g. Dewangan et al. 2006; Winter, Mushotzky & Reynolds 2007). While this conventional model provides a reasonably acceptable fit, the spectrum curves at high energy such that a power-law tail overpredicts the observations above 5 keV (Gladstone et al., 2009). Instead, a disc plus low temperature (and hence optically thick) Comptonisation spectrum fits this spectral shape, as the low electron temperature gives the low energy rollover in the Comptonised flux. Hence we use this model to fit all our spectra. Gladstone et al. (2009) used some very sophisticated disc and Comptonisation modelling to fit their sample containing the longest exposure XMM-Newton ULX data available in the archive. Here we have more limited signal to noise in the Swift spectra so we choose the simplest possible model for disc plus low temperature Comptonisation, namely a diskbb plus comptt model, and set the seed photon temperature equal to the disc temperature.
We assume a HI column density of 4.06 cm-2 in the direction of Holmberg IX X-1 (Dickey & Lockman, 1990), and we allow intrinsic absorption in the host galaxy to be a free parameter. We fit our 8 spectra (3 XMM-Newton plus 5 Swift spectra) simultaneously in xspec, allowing all parameters to be free except for the extra-galactic absorption column which is tied across all 8 datasets. This gives a reasonable fit, with for a best fit value of cm-2. The derived disc and Comptonisation parameters are given in Table 2, where the fluxes are the unabsorbed (intrinsic) flux from the diskbb plus comptt model from 0.3 – 10 keV. The error of the flux is calculated by using flux err command in xspec. The bolometric luminosity is calculated from the unabsorbed flux in 0.01 – 100 keV range, assuming disc geometry.
All the spectra are well fitted by a low temperature Comptonising corona, that is optically thick. However, the electron temperature only has a firm upper limit in XMM1, XMM2, SWIFT 3 and SWIFT 4, so in the other datasets the rollover is not significantly detected. Nonetheless, the fact that some of the data (especially XMM1, see Fig. 5 of Gladstone et al. 2009) do require this rollover shows that we should use this model for all the data for consistency. Similarly, the moderate signal-to-noise of the SWIFT data means that the disc component is not strongly required in any of them ( for one additional degree of freedom) but we again include it for consistency.
| Group | Norm.1/2 | Flux222Unabsorbed flux in the fitting energy range (0.3 - 10 keV). | 333The bolometric luminosity is calculated from unabsorbed flux in 0.01 - 100 keV range. | ||||
|---|---|---|---|---|---|---|---|
| SWIFT 1 | 0.203 | 5.04 | 3.01 | 6.86 | 6.22 | 6.63 | 189.6/171 |
| SWIFT 2 | 0.239 | 4.94 | 3.11 | 6.60 | 8.70 | 9.27 | 337.8/327 |
| SWIFT 3 | 0.215 | 5.47 | 1.68 | 9.16 | 9.36 | 9.41 | 226.1/245 |
| SWIFT 4 | 0.252 | 5.06 | 1.47 | 10.5 | 12.8 | 11.1 | 232.1/236 |
| SWIFT 5 | 0.488 | 2.35 | 2.47 | 8.15 | 18.0 | 17.3 | 227.1/244 |
| XMM1 | 0.237 | 5.67 | 2.44 | 8.76 | 5.95 | 6.45 | 1349.3/1286 |
| XMM2 | 0.263 | 4.98 | 2.31 | 8.09 | 6.65 | 6.92 | 435.7/447 |
| XMM3 | 0.159 | 6.43 | 9.67 | 3.07 | 7.91 | 11.1 | 514.2/506 |
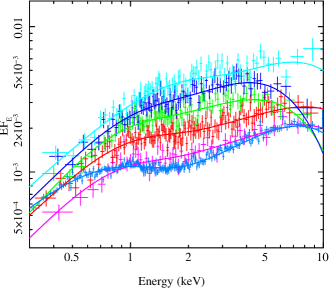
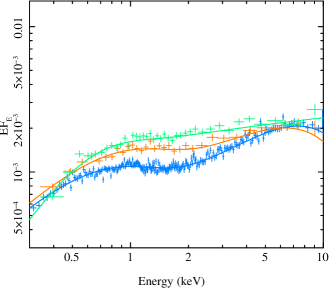
Fig. 3, left panel, shows the derived spectra for XMM1 and the SWIFT spectra, after correcting for absorption in both our Galaxy and the host galaxy, and deconvolving from the instrument response. XMM2 and XMM3 are not included on this plot as they overlap with XMM1, SWIFT1 and SWIFT2. Instead, the three XMM spectra are shown separately in the right panel.
These plots clearly show the complex nature of the spectral variability. XMM1 has a marked inflection at 1 – 2 keV, separating the emission into two peaks which are fit by the cool disc and low temperature Comptonisation at low and high energies, respectively. XMM2 and SWIFT 2 have a similar but less pronounced feature. None of the other spectra appear to have two spectral peaks. This is especially intriguing for SWIFT 1, as this has very similar overall flux to XMM1 yet is plainly different in shape, with more flux between 1 – 2 keV filling in the inflection, and less flux below 0.7 keV. This difference could instead be due to increased absorption in SWIFT 1 rather than a real spectral change for the constant absorption column assumed here. However, the low energy spectral shape of SWIFT 1 is similar to that of the other SWIFT spectra, so it seems more likely that there is a real spectral change between the SWIFT spectra and XMM1. This is not from the different instrument responses as XMM3 has a similar low energy slope to SWIFT 2. Thus it seems most likely that there are real spectral changes for little or no change in luminosity.
At higher energies there is more variability. The high energy rollover clearly indicates that the Comptonising corona has a lower electron temperature in SWIFT 3 and 4 than in the lower luminosity spectra (XMM1 – 3 and SWIFT 1 and 2), but this trend is not continued to the highest luminosity data (SWIFT 5), where the rollover again moves up in energy to close to the edge of the bandpass.
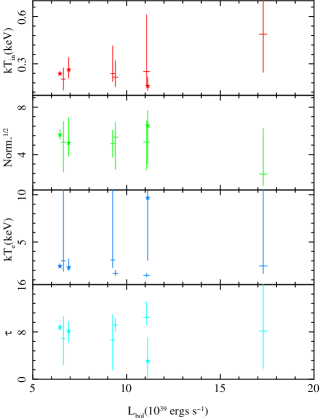
We plot the model parameters in Fig. 4 as a function of the unabsorbed, bolometric luminosity. The XMM-Newton data are plotted as filled stars: XMM1, XMM2, and XMM3, from left to right, respectively. The disc is consistent with having the same temperature in all spectra (). Alternatively, it is consistent with having the same normalisation in all spectra, but tying both temperature and normalisation give a significantly worse fit at . This gives the almost constant low energy flux described above.
The electron temperature is clearly changing, decreasing with increasing luminosity through XMM1 – 2 and SWIFT 1 – 4, except for XMM3 where we cannot have a good constraint on the upper limit of the electron temperature, even worse than SWIFT 5 (and thus its bolometric flux has likely been overestimated in Fig. 4 and Table 2). The similar spectral slope of all the data in the 2 – 4 keV range dominated by Comptonisation requires a similar Compton parameter, defined as constant, where , so the lower temperature implies an increased optical depth. A lower electron temperature also brings the rollover further into the observed bandpass, so it is better constrained. Hence the optical depth (derived from the observable parameters of spectral slope and electron temperature) has correspondingly smaller errors also. However, the highest luminosity spectrum does not follow this trend. The electron temperature increases again, so the optical depth drops.
4 Discussion
Gladstone et al. (2009) suggested that the different spectral shapes seen in their sample of ULXs could be set into a sequence such that the corona became increasingly optically thick and lower temperature, extending over more of the inner disc, as the mass accretion rate increased beyond Eddington (). Plausibly these changes could be caused by the increasingly strong winds which are expected to be driven by such super-Eddington flows. At even higher the source becomes embedded in an expanding photosphere, lowering the temperature still further (Begelman et al., 2006; Poutanen et al., 2007).
Our results show some support for this picture. Figs. 3 and 4 show that the electron temperature and optical depth in the corona generally decrease with increasing luminosity except for the brightest spectrum. However, they also highlight the fact that the spectral variability does not uniquely track the observed luminosity. SWIFT 1 and XMM1 have very similar fluxes, but their spectra are subtly different. Such lack of one-to-one correspondence between spectral shape and luminosity is a well-known feature of BHBs for the transition between the low/hard and high/soft states. However, this hysteresis in BHBs is most probably connected to non-equilibrium effects caused by the rapid rise in mass accretion rate in the transient outbursts of these systems (Gladstone, Done & Gierlinski, 2007), whereas most ULX are persistent sources. BHBs can also however show another type of non-unique relation of spectral shape to luminosity, where the strongly Comptonised very high state can be seen at the same luminosity as a standard disc dominated state (Gierlinski & Done, 2004, and the references therein). It is not at all clear what determines which of these high mass accretion rate states is shown at any time. The difference between SWIFT 1 and XMM1 may then be connected to the same (unknown) mechanism. Alternatively it may be connected to the additional complexity expected from super-Eddington flows. Numerical simulations show that such flows are highly dynamical (Ohsuga 2006; 2007; 2009; Kawashima et al. 2009; Takeuchi, Mineshige & Ohsuga 2009). Hence changes in the disc/wind geometry along the line of sight could result in complex changes in the observed flux which do not reflect the intrinsic luminosity of the source. However, the complex structure in accretion flow shown by the numerical simulations mentioned above may have been smoothed out within the observation timescale of our present study (of the order of days). Alternatively, we may consider an intermittent outflow (e.g. Kato, Mineshige, & Shibata 2004).
It is interesting to compare the variability behaviour of Holmberg IX X-1 to other ULXs modelled with similar cool disc plus Comptonisation models. Specifically, Roberts et al. (2006) explored this for the ULX NGC 5204 X-1 based on a Chandra monitoring programme and XMM-Newton data, and Feng & Kaaret (2009) use this model to compare XMM-Newton data for several ULXs over all available epochs with sufficient data quality. Interestingly, these works show that IC 342 X-1 behaves similarly to Holmberg IX X-1; its coronal electron temperature appears to drop as it gains in luminosity. In contrast, both NGC 5204 X-1 and Holmberg II X-1 behave differently. In these ULXs the electron temperature increases with increasing luminosity, with a corresponding drop in optical depth. Perhaps most interestingly, there appears to be a correlation between these spectral changes and the position of the sources in the spectral sequence for ULXs shown as Fig. 8 of Gladstone et al. (2009). Both Holmberg IX X-1 and IC 342 X-1 appear in the central portion of the sequence, where the spectra appear with a strong inflection and the energy density peaks in the higher energy, optically thick, Comptonised spectral component. Holmberg II X-1 and NGC 5204 X-1, on the other hand, appear further along the sequence, where the energy density peaks in the softer part of the spectrum and Gladstone et al. (2009) hypothesize that the spectra are becoming photosphere-dominated due to the increasingly important effects of a strong wind. This apparent correlation between spectral shape and variability data supports the conclusion of Gladstone et al. (2009) that different physical processes underly the two distinct spectral shapes. However, we emphasize that this tentative result is concluded from the current, sparse data available for ULX spectral variability studies; clearly new dedicated observational programmes are required to investigate these phenomena in more detail.
5 Conclusions
We use the multiple Swift observations of Holmberg IX X-1, co-added in different intensity ranges, together with a long XMM-Newton observation of this source, to make the most sensitive study to date of spectral variability in any individual ULX. We show that the variability is subtle and rather complex, such that it is not well characterised by a single hardness ratio. Instead, we do full spectral fitting with a disc plus thermal Comptonisation model. There is a general trend in Holmberg IX X-1 for the Comptonising corona to decrease in temperature and increase in optical depth as the source luminosity increases. This supports the suggestion of Gladstone et al. (2009) that an increase in mass loss in winds from the inner disc as the source becomes more super-Eddington leads to increased material in the corona, thereby increasing the optical depth. The acceleration mechanism is then required to share the coronal power across more particles, so the temperature drops. We also note that there appears to be a tentative correlation between the observed changes in the coronal parameters with luminosity, and the type of spectrum displayed, over the small number of ULXs with sufficient quality data to begin to explore spectral variability.
However, the data for Holmberg IX X-1 also show more complex behaviour. It is clear that the spectral shape is not uniquely determined by the observed luminosity. At the same luminosity the spectra can look subtly different, and at different luminosities the spectral shape can be the same. It may indicate that some fraction of the observed variability is due to time dependent line of sight column changes rather than intrinsic changes. Alternatively, this may be related to the equally puzzling lack of one-to-one correspondence between spectral shape and luminosity seen in the BHBs at high (but apparently sub-Eddington) mass accretion rates where the source can show either high/soft or very high state at the same luminosity. Whatever the reason, this severely complicates any attempt to understand the origin of the spectral variability. It is therefore very evident that if we are to make progress in understanding ULX spectral variability, and the physical processes that underly these behaviours, then the acquisition of new observational data composed of good quality ULX spectra over a range of timescales and source fluxes is absolutely imperative.
Acknowledgments
We thank the referee for their useful comments, that helped improve this work. KV thanks Chia-Ying Chiang for help with the Swift data reduction and the Ministry of Education, Culture, Sports, Science and Technology (MEXT) of Japan for the scholarship. This work is supported in part by the Grant-in-Aid for the Global COE Program ”The Next Generation of Physics, Spun from Universality and Emergence” from MEXT and by the Grant-in-Aid of MEXT (19340044, SM). This work is in part based on observations obtained with XMM-Newton, an ESA science mission with instruments and contributions directly funded by ESA Member States and NASA.
References
- Begelman (2002) Begelman M.C., 2002, ApJ, 568, L97
- Begelman et al. (2006) Begelman M.C., King A.R., Pringle J.E., 2006, MNRAS, 370, 399
- Dewangan et al. (2004) Dewangan G.C., Miyaji T., Griffiths R.E., Lehmann I., 2004, ApJ, 608, L57
- Dewangan, Griffiths & Rao (2006) Dewangan G.C., Griffiths R.E., Rao A.R., 2006, ApJ, 641, L125
- Dickey & Lockman (1990) Dickey J.M., Lockman F.J., 1990, ARA&A, 28, 215
- Done, Gierlinski & Kubota (2007) Done C., Gierlinski M., Kubota A., 2007, A&ARv, 15, 1
- Farrell et al. (2009) Farrell S.A., Webb N.A., Barret D., Godet O., Rodrigues J.M., 2009, Nature, 460, 73
- Feng & Kaaret (2006) Feng H., Kaaret P., 2006, ApJ, 650, L75
- Feng & Kaaret (2009) Feng H., Kaaret P., 2009, ApJ, 696, 1712
- Gao et al. (2003) Gao Y., Wang Q.D., Appleton P.N., Lucas R.A., 2003, ApJ, 596, L171
- Gierlinski & Done (2004) Gierlinski M., Done C., 2004, MNRAS, 347, 885
- Gladstone, Done & Gierlinski (2007) Gladstone J.C., Done C., Gierlinski M., 2007, MNRAS, 378, 13
- Gladstone & Roberts (2009) Gladstone J.C., Roberts T.P., 2009, MNRAS, 397, 124
- Gladstone et al. (2009) Gladstone J.C., Roberts T.P., Done C., 2009, MNRAS, 397, 1836
- Isobe et al. (2009) Isobe N. et al., 2009, PASJ, 61, S279
- Kaaret et al. (2003) Kaaret P., Corbel S., Prestwich A.H., Zezas A., 2003, Sci, 299, 365
- Kaaret & Feng (2009) Kaaret P., Feng H., 2009, ApJ, 702, 1679
- Kajava & Poutanen (2009) Kajava J.J.E., Poutanen J., 2009, MNRAS, 398, 1450
- Kato et al. (2004) Kato Y., Mineshige S., Shibata K. 2004, ApJ, 605, 307
- Kawashima et al. (2009) Kawashima T., Ohsuga K., Mineshige S., Heinzeller D., Takabe H., Matsumoto R., 2009, PASJ, 61, 769
- King et al. (2001) King A.R., Davies M.B., Ward M.J., Fabbiano G., Elvis M., 2001, ApJ, 552, L109
- King (2004) King A.R., 2004, MNRAS, 347, L18
- Kubota, Done & Makishima (2002) Kubota A., Done C., Makishima K., 2002, MNRAS, 337, L11
- La Parola et al. (2001) La Parola V., Peres G., Fabbiano G., Kim D.W., Bocchino F., 2001, ApJ, 556, L47
- Madau (1988) Madau P., 1988, ApJ, 327, 116
- Miller et al. (2003) Miller J.M., Fabbiano G., Miller M.C., Fabian A.C., 2003, ApJ, 585, L37
- Miller et al. (2004) Miller J.M., Fabian A.C., Miller M.C., 2004, ApJ, 607, 931
- Miniutti et al. (2006) Miniutti G., Ponti G., Dadina M., Cappi M., Malaguti G., Fabian A.G., Gandhi P., 2006, MNRAS, 373, L1
- Miyawaki et al. (2009) Miyawaki R., Makishima K., Yamada S., Gandhi P., Mizuno T., Kubota A., Tsuru T.G., Matsumoto H., 2009, PASJ, 61, S263
- Mizuno, Kubota & Makishima (2001) Mizuno T., Kubota A., Makishima K., 2001, ApJ, 554, 1282
- Moore & Miller (2008) Moore S.B., Miller J.M., 2008, ATel., 1505, 1
- Morgan, Remillard & Greiner (1997) Morgan E.H., Remillard R.A., Greiner J., 1997, ApJ, 482, 993
- Ohsuga (2006) Ohsuga K., 2006, ApJ, 640, 923
- Ohsuga (2007) Ohsuga K., 2007, ApJ, 659, 205
- Ohsuga et al. (2009) Ohsuga K., Mineshige S., Mori M., Kato Y., 2009, PASJ, 61, L7
- Poutanen et al. (2007) Poutanen J., Lipunova G., Fabrika S., Butkevich A.G., Abolmasov P., 2007, MNRAS, 377, 1187
- Remillard & McClintock (2006) Remillard R.A., McClintock J.E., 2006, ARA&A, 44, 49
- Roberts et al. (2006) Roberts T.P., Kilgard R.E., Warwick R.S., Goad M.R., Ward M.J., 2006, MNRAS, 371, 1877
- Roberts (2007) Roberts T.P., 2007, Ap&SS, 311, 203
- Soria et al. (2009a) Soria R., Risaliti G., Elvis M., Fabbiano G., Bianchi S., Kuncic Z., 2009, ApJ, 695, 1614
- Soria et al. (2009b) Soria R., Hau G.K.T., Graham A.W., Kong A.K.H., Kuin N.P.M., Li I.-H., Liu J.-F., Wu K., 2009, arXiv:0910.1356
- Stobbart et al. (2006) Stobbart A., Roberts T.P., Wilms J., 2006, MNRAS, 368, 397
- Strohmayer & Mushotzky (2003) Strohmayer T.E., Mushotzky R.F., 2003, ApJ, 586, L61
- Strohmayer & Mushotzky (2009) Strohmayer T.E., Mushotzky R.F., 2009, ApJ, 703, 1386
- Takeuchi, Mineshige & Ohsuga (1994) Takeuchi S., Mineshige S., Ohsuga K., 2009, PASJ, 61, 783
- Tsunoda et al. (2006) Tsunoda N., Kubota A., Namiki M., Sugiho M., Kawabata K., Makishima K., 2006, PASJ, 58, 1081
- Wang (2002) Wang Q.D., 2002, MNRAS, 332, 764
- Watarai et al. (2001) Watarai K., Mizuno T., Mineshige S., 2001, ApJ, 549, L77
- Winter et al. (2007) Winter L.M., Mushotzky R.F., Reynolds C.S., 2007, ApJ, 655, 163
- Zampieri & Roberts (2009) Zampieri L., Roberts T.P., 2009, MNRAS, in press (arXiv:0909.1017)