The origin of mid-infrared emission in massive young stellar objects: multi-baseline VLTI observations of W33A††thanks: Based on observations with the VLTI, proposal 381.C-0602
Abstract
Aims. In this paper we aim to determine the structure on 100 AU scales of the massive young stellar object W33A, using interferometric observations in the mid-infrared. This emission could be due to a variety of elements, for example the inner protostellar envelope, outflow cavity walls, dusty or gaseous accretion disk.
Methods. We use the Unit Telescopes of the VLT Interferometer in conjunction with the MIDI instrument to obtain spectrally dispersed visibilities in the -band on 4 baselines with an angular resolution between 25 and 60 milli-arcseconds (equivalent to 95 and 228 AU at 3.8 kpc). The visibility spectra and spectral energy distribution are compared to 2D-axi-symmetric dust radiative transfer models with a geometry including a rotationally flattened envelope and outflow cavities. We assume an O 7.5 ZAMS star as the central source, consistent with the observed bolometric luminosity. The observations are compared to models with and without (dusty and gaseous) accretion disks.
Results. The visibilities are between 5% and 15%, and the non-spherically symmetric emitting structure has a typical size of 100 AU. A satisfactory model is constructed which reproduces the visibility spectra for each (u,v) point. It fits the -band flux spectrum, the mid-infrared slope, the far-infrared peak, and the (sub)mm regime of the SED. It produces a 350 m morphology consistent with the observations.
Conclusions. The mid-infrared emission of W33A on 100 AU scales is dominated by the irradiated walls of the cavity sculpted by the outflow. The protostellar envelope has an equivalent mass infall rate of , and an outflow opening angle of . The visibilities rule out the presence of dust disks with total (gas and dust) masses more than . Within the model, this implies a disk of less than , where is the viscosity of the Shakura-Sunyaev prescription. However, optically thick accretion disks, interior to the dust sublimation radius, are allowed to accrete at rates equalling the envelope’s mass infall rate (up to ) without substantially affecting the visibilities due to the extinction by the extremely massive envelope of W33A.
Key Words.:
Stars: formation – Stars: early type – ISM: jets and outflows – accretion disks – Techniques: interferometric1 Introduction
Circumstellar accretion disks are an essential element in the formation of stars. The relatively long time scales involved in low-mass star formation (SF) and the proximity of the regions where they form allow the disks to be imaged at millimeter (Dutrey et al. 1996), near-infrared (near-IR; Padgett et al. 1999) or even optical wavelengths (Grady et al. 1999) and studied in great detail. The short time scales on which high-mass stars are formed and the distance of massive SF regions amongst others render the study of the accretion process particularly difficult. Whether or not a high-mass star grows in mass through the accretion of matter delivered to the stellar surface by means of a circumstellar disk is therefore still left unanswered. Recent 3-D radiation hydrodynamic simulations demonstrate that accretion through a disk can continue in the presence of strong radiation pressure (Krumholz et al. 2009). Observationally a growing number of direct and indirect pieces of evidence point to the presence of large-scale (10,000 AU) rotating toroids (e.g. Beltrán et al. 2004, 2005; Furuya et al. 2008), but also to intriguingly disk-like structures on scales of several 100 AU in a small number of comparatively nearby examples (e.g. Hoare 2006; Jiménez-Serra et al. 2007; for a review see Cesaroni et al. 2007).
The reality of a disk accretion scenario in massive star formation can be assessed by observations of massive stars during the main mass gathering phase at significant angular resolution. Prime examples of such young massive stars constitutes the class of object referred to as massive YSO (MYSO), but also as high-mass protostellar object, and BN-object. The class is characterised by luminous () infrared objects with spectral energy distributions that peak around 100 m. The luminosity indicates a single ZAMS star that would be able to ionise its surroundings, however too little or no radio emission is observed. This absence has been used as an argument to claim on-going mass infall onto the central object. As a result the star is extended and thus relatively cool (Hosokawa & Omukai 2009), and therefore unable to ionise its surroundings (Hoare & Franco 2007). Alternatively, high mass infall rates (Walmsley 1995) or gravitational entrapment (Keto 2002) could quench the development of an H ii that dominates the radio continuum emission. These alternative scenarios invoke however very high emission measure (EM) H ii regions to make them optically thick in the radio, e.g. (Osterbrock 1989). However, it is unlikely in this picture that the region would still be optically thick in the near-IR H i recombination lines Br and Br as these have line centre optical depths that are times smaller than (Hummer and Storey 1987). This would imply that these objects should have strong near-IR H i lines and yet they only show weak, broad lines indicating a stellar wind origin (Bunn et al. 1995). Nonetheless, the MYSO class has the potential to test the disk accretion scenario. The actual accretion region is probably found on AU to tens of AU scales near the central stellar object. This region is however buried by hundreds of of dust, which makes up the extended (0.1 pc) protostellar envelope (van der Tak et al. 2000). Only long-wavelength radiation is capable of carrying away information on the physical processes at play, limiting the attainable spatial resolution with single dish apertures. Interferometers can overcome the problem of limited resolution and the near and mid-infrared wavelength regions currently deliver the highest angular resolution by means of e.g. the Very Large Telescope Interferometer (VLTI).
The inner parts of the dusty MYSO protostellar envelope is heated to a few 100 K and emits strongly at mid-IR wavelengths. The 10 m emission is usually unresolved at the 0.3″ resolution of single 8 meter dish telescopes, but it is partially resolved at 24.5m (de Wit et al. 2009). Here, we present new observations made of the MYSO W33A with the MID-infrared Interferometric (MIDI) instrument at the VLTI. MIDI is a two beam combiner that operates in the -band (8–13m) and delivers spectrally dispersed interferometric observables (see Leinert et al. 2003) . W33A is one of the most intensely studied MYSO thanks to its IR spectrum rich in ice features (Gibb et al. 2000). Its physical nature has received much less attention. The object has an IRAS luminosity of (Faundez et al. 2004) for a kinematical distance of 3.8 kpc (Bronfman et al. 1996). The object shows weak, compact and optically thick radio continuum emission (Rengarajan & Ho 1996; van der Tak & Menten 2005) and broad (100 km s-1), single-peaked H i recombination emission consistent with an ionised stellar wind origin (Bunn et al. 1995). Modelling of the protostellar envelope with spherical dust radiative transfer (RT) model at constant density by Gürtler et al. (1991) required the presence of an inner dust-free cavity of 135 AU (35 milli-arcsecond at 3.8 kpc), a size that would be well resolved by MIDI. In de Wit et al. (2007, hereafter paper I) we presented a single MIDI baseline for W33A in order to probe this hundred AU scale region. We found using 1-D modelling an inner dust-free radius at 7 milli-arcsecond (26.5 AU), corresponding to the dust sublimation radius. We concluded that the dispersed MIDI visibilities and SED can be reproduced by a spherical dust model provided that the density law is relatively flat. In this paper we present three additional VLTI/MIDI observations of W33A with baseline position angles close to perpendicular and with different projected lengths. This allows us to constrain the distribution of the emitting material further using 2-D axi-symmetric RT models.
We describe and discuss the new and archived MIDI observations in Sects. 2 and 3. The basic features of the RT model, our modelling approach and the final preferred model are explained in Sect. 4. The implications for W33A and their effect for MYSOs in general are presented in Sect. 5. We conclude our work in Sect. 6
2 Observations and data reduction
| UT Date | Stations | B | P.A. | Seeing | |
|---|---|---|---|---|---|
| (m) | (°) | (″) | |||
| Config.A | 2008-06-21 | U2-U3 | 42.03 | 15.04 | 0.65 |
| Config.B | 2008-04-22 | U3-U4 | 57.95 | 119.69 | 1.08 |
| Config.C | 2008-04-21 | U3-U4 | 61.08 | 114.57 | 0.52 |
| Config.D | 2005-09-16 | U2-U3 | 45.58 | 47.31 | 1.00 |
2.1 MIDI observations
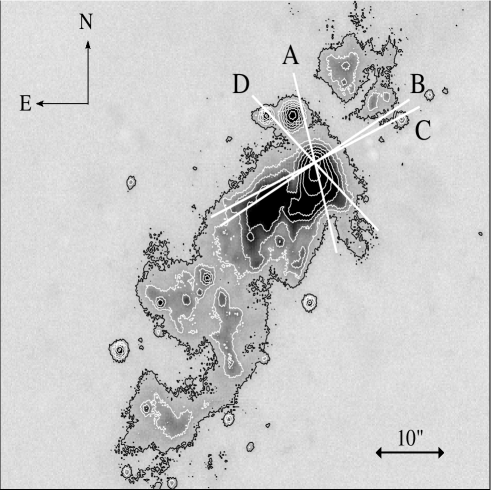
W33A was observed with the VLTI and the MIDI instrument in service mode on four different occasions using the UTs as aperture stations (see Table 1). We aimed at covering different position angles on the shortest possible UT baselines. The baselines are presented in Fig. 1 projected onto the near-IR reflection nebula of W33A as imaged by UKIDSS (Casali et al. 2007; Warren et al 2007; Lucas et al. 2008). The shortest VLTI baselines are attained with the ATs but W33A cannot be observed in this mode due to its relatively low brightness. The obtained angular resolution for the data set presented here stretches from 25 to 60 milli-arcseconds. Detailed descriptions of the MIDI observation procedure are given in Przygodda et al. (2003), Chesneau et al. (2005) and Leinert et al. (2004). The W33A observations were executed in the so-called High-Sens MIDI mode, which uses all the incoming light for beam combination and fringe tracking. The incoming beams are interfered producing two complementary interferometric channels that have by definition a phase difference of radians. A measurement of the uncorrelated flux spectrum to obtain final visibilities is done immediately after the interferometric observation. The high-sens mode is advantageous when observing faint targets or small visibilities, however the accuracy of the final visibility spectrum is limited by the sky brightness variation between the interferometric and photometric measurement. This can amount to 10-15% uncertainty, depending on the atmospheric stability. During the nights, the unresolved interferometric calibrator star HD 169916 was observed in order to determine the instrumental visibility and correct for it. We also inspected all other observed calibrators from different programs for each night (a total of 18 objects), which allowed us to estimate the stability and accuracy of the instrumental visibility. We found it to be uncertain by not more than 5%, much smaller than the uncertainty in the determined photometric measurement (20%, see next section). The calibrator star provides also an approximate flux calibration (Cohen et al. 1999) in addition to the visibility calibration. A prism with a spectral resolution of 30 was employed in order to disperse the incoming beams.
The correlated flux spectra are estimated by the MIAEWS software package (version 1.6; see Jaffe 2004; Köhler 2005). Interferograms are coherently added in order to maximize the signal to noise. First, fringe spectra have to be corrected, because they are affected by the instantaneous atmospheric and instrumental piston. The fringe scan is used to estimate the group delay due to the atmosphere. Removing the atmospheric and the (known) instrumental group delays constitutes a correction to the dispersed fringe signal, and straightens the dispersed fringe spectra, i.e. the phase is independent of wavelength. Next, the phase offset due to varying water refraction index between the time of recording of the fringe spectra has to be accounted for. In principle all spectra can then be added to a final fringe spectrum and the amplitude of the power at each frequency estimated, which will give the correlated flux.
The total flux spectra are taken in a chopping mode and each observation results in two spectra as MIDI splits the beams. The spectra are extracted from the raw data in the EWS mode. An estimate of the sky background is made and subtracted. The area corresponding to the mask with which the correlated spectra are extracted is used here. The counts are then simply summed in the y-direction. The final spectrum is the sum of the two geometric means of the four individual spectra: . This quantity is also what is obtained for the correlated flux after beam combination and thus ensures consistency in deriving visibilities.

2.2 JCMT/HARP-B observations
W33A was observed on the night of 5 June 2007 in 12CO, 13CO and C18O using the HARP-B instrument on the James Clerk Maxwell Telescope. The 12CO data have a resolution of 488 kHz, and the other two lines were rebinned to the same resolution, giving a velocity resolution of approximately 0.4 km s-1. The maps had a linear baseline removed. The core emission was presumed to be traced by the C18O emission (which has line profile very close to a Gaussian). We used this as a model to trace the emission in the 12CO and 13CO maps that arises from the actual outflow. Full details of this work, which is part of a larger project studying outflows from the Red MSX Source Survey (see e.g. Urquhart et al. 2008), will be published separately in due course.
3 Description of observational data of W33A
3.1 -band from MIDI
The measured MIDI observables (flux, correlated flux) and derived visibilities of W33A are presented in Fig. 3. Each column represents a VLTI configuration and we have included the observations already presented in paper I (configuration D). The top panels show the flux calibrated -band spectra. They show a variation of around 20% as expected for data taken in the observational high-sens mode. The errorbars represent two uncertainties that are added in quadrature: (1) the rms estimates of the flux and (2) the systematic error determined from a total of five W33A MIDI spectra (more than the standard one flux spectrum per interferometric measurement were taken.). The distinct feature of W33A in the -band is the extremely deep silicate absorption, the actual depth is not detected at the central wavelength where it drops to less than 1% times the level of the pseudo-continuum.
The second row of panels shows the correlated flux spectra. The dotted lines indicate the correlated noise level. It was estimated by processing that part of the detector directly adjacent to the W33A fringes, indicative of the background noise. The noise produces a signal a few times 0.1 Jy around 10 m, despite the absence of incoming flux at the base of the silicate absorption. Similar noise levels have been found previously (e.g. Jaffe et al. 2004; Matsuura et al. 2006). The errorbars of the W33A correlated flux spectra reflect the uncertainties due to spurious correlated noise level. We discard any signal below this noise level in further analysis.
The third row of figures presents the resulting visibilities for the wavelengths not affected by low flux levels. The errorbars are the uncertainties from correlated and total flux added in quadrature. This entails that the systematic uncertainty inherent to the high-sens mode are taken into account in the visibility uncertainties. We find that W33A has visibility values between 5% and 15% on the used baselines. The spectral shape of the visibilities reveal a clear trend of decreasing visibilities on the blue wing of the silicate absorption feature. The smaller visibilities imply a larger emitting region, and therefore that the increasing optical depth due to the silicate absorption is due to structures on larger size scales than the pseudo-continuum. The visibilities corresponding to the two similar configurations (B and C) are practically the same, as are their correlated flux levels. It gives an independent indication of the stability of the set-up, and the relatively good weather. Configuration A shows a correlated flux level twice higher than the ones of configuration B and C, despite the relatively little difference in total flux. Given that the weather during the observations was stable, we believe that the difference in visibilities between the various configurations is real. If we translate the visibilities at 8 m to Gaussian emission regions then the FWHM decreases from 115 AU to about 95 AU rotating in P.A. from 15°(configuration A) to (B and C) and changing the baseline length accordingly.
3.2 The molecular outflow and near-IR reflection nebula
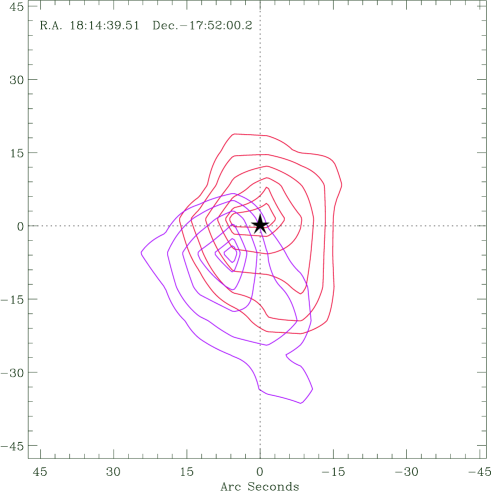
The star formation activity in W33A produces an archetypical bipolar molecular outflow (Fig. 2). The south-eastern lobe constitutes the approaching, blue-shifted flow. Detailed millimeter line maps which would provide constraints on the outflow opening angle and the inclination of the system are currently unavailable. However, outflow activity produces reflection nebulae particularly well traced by near-IR scattered light (see e.g. Tamura et al. 1991). The near-IR image of W33A already presented in Fig. 1 is consistent with the CO map in position angle and orientation. We use this image therefore in order to constrain these system parameters, which will be of further help in modelling the MIDI visibilities and SED later on. The full extent of the long -band nebula is shown in Fig. 1. The nebula has a position angle of , however on scales of order 1″ patchy extinction distorts the morphology. A fainter extension can also be seen in the north-western direction. This lends support for the position angle to be the actual orientation of the system. High-angular resolution IFU images presented in Davies et al. (2010) confirms the reflected nature of the -band emission at the base of the outflow and position angle. The outer regions of the nebula may have contributions from shocked emission as traced by extended 4.5 m emission in Spitzer IRAC images (Cyganowski et al. 2008).
In Davies et al. (2010), it is also shown using spectro-astrometry of the Br transition that the near-IR source is at the base of the bipolar outflow on scales of 200 -arcseconds. The near-IR source corresponds most likely to the central objects in W33A, indeed as was assumed during the execution of the MIDI observations. This source shows a -band profile in the UKIDSS image that is broader than the unresolved stars in the nearby field. In the -band the scattering nebula is much weaker (see Fig. 4). Given that photons are more efficiently scattered at shorter wavelength the relatively dim nature of the -band nebula argues for strong extinction in the line-of-sight towards W33A. Moreover, the central source is absent in the -band.
Most of the emission seen at -band is dust scattered; contribution to the emission by molecular hydrogen gas is small as evidenced by intermediate resolution spectra, obtained as part of the RMS survey111URL: http://www.leeds.ac.uk/RMS. In the -band a foreground star is visible projected onto the nebula, located 2.5″ south and 1.0″ east of the main -band source. We have re-measured the flux densities coming from the full extended nebula as seen on the UKIDSS images, after first removing all the interloping stars from the images and replace the pixels values using the adjacent regions. We find that in the -band the nebula is 0.39 Jy () and in the -band 0.025 Jy ().
4 Modelling
In this section we present the simultaneous modelling of the visibility and spectral energy distribution of W33A. Historically, the SEDs of MYSOs have been interpreted as hot stars embedded in a spherically symmetric dusty envelope (e.g. Gürtler & Henning 1986). In Paper I we adopted the approach of modelling the observables with a 1-D spherical symmetric radiative transfer code. We concluded that models with shallow density laws are preferred provided that a relatively low effective temperature for the central star is adopted. Here we construct a fiducial model of a hot star surrounded by a protostellar envelope with outflow cavities. Our initial model aims to be as simple as possible and we begin by investigating the imprint on -band visibilities by a protostellar envelope that includes outflow cavities. The walls of the cavities are suggested to be the source of mid-IR emission seen on 1″ scales in the nearly edge-on MYSO G35.20-0.74 (De Buizer 2006) and in Ceph A HW2 (de Wit et al. 2009).
4.1 Description of the radiative transfer code and input
We adopt the 2D-axi-symmetric dust RT model by Whitney et al. (see for details Whitney et al. 2003a, 2003b). The model calculates radiation transfer (absorption, re-emission and scattering) through a dusty structure. The inner rim of the structure is the dust sublimation radius which follows from a fit to models with different stellar temperatures (see Whitney et al. 2004: ); space is empty within the inner rim except for the star itself. The structure can include three distinct geometrical elements: an accretion disk, a protostellar envelope, and low density polar outflow cavities. The protostellar envelope is described by the analytical TSC solution (Ulrich 1976; Tereby, Shu & Cassen 1984) of a simultaneously rotating and collapsing spherical structure. This solution is governed by the infall parameter () and the centrifugal radius , i.e. the radius where rotational motion dominates infall. The envelope mass infall rate is a parameterization of the density distribution and does not per se represent an actual determination of infalling material. The presence of an accretion disk is optional in the code. When present, the disk structure follows the one for a flared -type disk prescription, and the released accretion luminosity within the dust inner rim is added to the central luminosity source. The outflow cavity geometry can have two possible shapes, a streamline or polynomial geometry. The streamline is conical on large scales, the polynomial has a opening angle at the stellar surface. Each of these geometrical elements are potential mid-IR emitters and could contribute to the visibilities. For most model runs the is comparatively small (tens of AU) and unresolved by the employed VLTI baselines in the -band.
A model run is necessarily characterised by a large number of free parameters. A fraction of these can be constrained by the known properties of W33A. The spatial information at milli arcsecond angular resolution provided by MIDI allows the RT model to be seriously tested on its correctness in describing a MYSO.
4.1.1 Fixed input parameters
The central star parameters are chosen close to an O7.5 ZAMS according to the scale of Martins et al. (2005). The bolometric luminosity is (Faundez et al. 2004) and it is located at the kinematical distance of 3.8 kpc (Bronfman et al. 1996). The luminosity is based on IRAS flux density, and could be overestimated. We take the opportunity here to correct our 70 m Spitzer MIPS photometry presented in Paper I, which was not corrected for detector non-linearity. Taking this correction into account we find a value of Jy, quite similar to the IRAS measurement at 60 m. This indicates that the luminosity based on IRAS is probably reasonable. We think it is unlikely that a significant fraction of the IR luminosity is due the secondary millimetre source noted in van der Tak et al. (2000) at 6″ from the main source. The W33A MIPS 24 m and 70 m data show no sign of a secondary object, nor does a new 24.5 m image taken with Subaru/COMICS at an angular resolution of 0.6″ (in prep.). This suggests that the IR luminosity is dominated by a single object.
| P.A. | |||||||||||
| () | () | (K) | () | ( yr-1) | () | (AU) | (AU) | () | () | ||
| 25 | 8.4 | 35 000 | 60 | 25 | 8 | 230 | 165 |


.
A number of the important parameters that determine the properties of the TSC envelope are fixed for the following reasons. We choose a single type of dust that consists of an interstellar mixture of “warm silicates” (Ossenkopf et al. 1992), and amorphous carbon with a size distribution according to Mathis et al. (MRN; 1977). The type of silicates provides a better fit to the observed shape of the absoprtion feature than MRN DL grain-mixture (Draine & Lee 1984), in particular to the blue wing (see paper I, and see also Capps et al. 1978; Gürtler & Henning 1986). The centrifugal radius is set at 33 AU which is comparable to the dust sublimation radius. TSC envelopes make a transition from a pure infall, radial density law to a shallower rotating, law at the centrifugal radius. A TSC envelope with an centrifugal radius smaller than the sublimation radius is dominated by the infalling part of the envelope’s structure solution, i.e. the envelope is quite spherically symmetric apart from the outflow cavities. The shape of the outflow cavities is polynomial (see Whitney et al. 2003), which in the presence of a stellar wind could be a more appropriate geometry than a conical streamline. The density in the outflow cavity is chosen to be typical of MYSO outflows, i.e. between and a few times (see Beuther et al. 2002). The cavity material consists of gas and dust. We initially base the outer edge of the envelope on 350 m observations by van der Tak et al. (2000). The radial intensity profile shows a downturn of submm emission at a radial distance of , or . We require a posteriori that the model densities at the outer edge are similar to that of the large scale molecular cloud material in which W33A is embedded, viz. .
4.1.2 Cavity opening angle
One can exploit the observed shape of the near-IR scattering nebula to constrain the opening angle of the outflow. To this end we use the less computationally intensive scattering-only version of the dust RT code (Whitney & Hartmann 1992, 1993). The scattering code provides images at ten inclination angles simultaneously, which one can readily compare to the observations. We model the near-IR nebula under the assumption that the emission is free from direct thermal emission. We put particular emphasis on matching the outflow opening angle with the observed one and constraining the inclination angle. Model input parameters are conform the fixed parameters discussed in the previous subsection, except for the dust properties. The detailed dust properties are not important for the goal to constrain the geometrical parameters of the W33A system from the near-IR nebula. For completeness, the scattering dust used here is coated with a small layer of water ice. The dust sizes follow a distribution that fits the extinction curve from Cardelli et al. (1989) for a prescription of . This distribution is not a single power law, and it is presented in Kim et al. (1994). For more details on the dust properties see Fig. 1 in Whitney et al. (2003a).

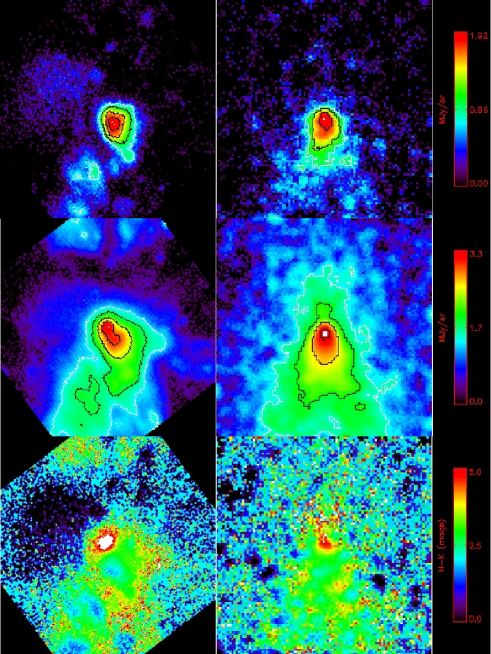
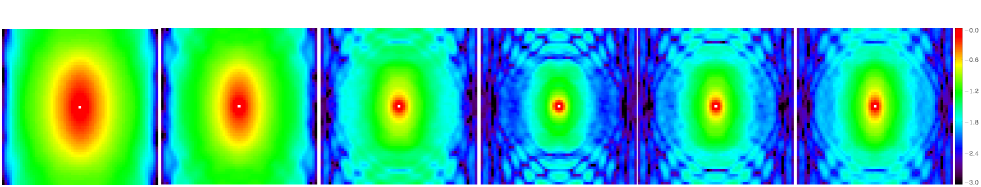
Fig. 4 compares the and -band images of a model run with the W33A scattering nebula. The images of the observed nebula have been rotated by . The observed and model images are in the same units (MJy sr-1). Model images are convolved with a Gaussian point spread function that simulates the one derived from the UKIDSS images and Gaussian noise derived from the observed images is added to the model ones. The outflow angle measured from the images directly would be , however the presented model has an envelope geometry with a full cavity opening angle of less than half that, viz. . In our fitting procedure, attention is devoted to the absence of an -band counterpart of the central source. Whether or not a central source is detectable depends on the system inclination. The model that is presented in Fig. 4 has an inclination of . An inclination less than or more than are excluded. In the former case the central star is visible in the -band, whereas in the latter case the redshifted outflow lobe becomes prominent. These features are not present in the UKIDSS near-IR images.
Although the shape on the sky can be reproduced reasonably well, not a single model run reproduces the observed colour of . Photometry done on the model images shows that they produce colours that are much bluer instead. The model images of Fig. 4 match the colour of the observed images, but additional foreground extinction of is required. The model and -band fluxes need to be scaled up accordingly. The central source visible in the -band constitutes only a minor contribution to the total observed flux density at this wavelength. We note that MYSO models invariably have problems matching especially the short wavelength fluxes of MYSO scattering nebulae (e.g. Alvarez et al. 2004). The deviant model colours might be rectified by the inclusion of a clumpy structure within the outflow cavity (Indebetouw et al. 2006) and/or very small dust particles that are transiently heated to high temperatures. We find that the introduction of an outflow cavity with a smooth density distribution into an infalling envelope cannot be the only physical element determining the observed near-IR emission of MYSOs. Whichever the solution, a deeper investigation of this problem is beyond the purpose of the paper. Nonetheless, a comparison of near-IR images with scattering RT models has led to relatively stringent constraints on the outflow opening angle, and comparatively less stringent limits on the inclination.
4.1.3 Methodology
The prime model parameters which remain to be determined are the density as parametrized by the envelope mass infall rate, the presence of an accretion disk (and its properties), and the outer radius. They determine the peak of the SED, and depending on inclination angle, the depth of the silicate feature, and the dominant emission regions on scales of 100 AU. The RT code is computationally demanding which excludes a grid search for the optimum value for the decisive model parameters. Building on a simple fiducial model, we try to find a model that fits the SED and MIDI visibilities simultaneously. One run delivers the SEDs at 10 inclinations simultaneously, evenly spaced in . Model images are produced for a single inclination at a time but for any number of desired wavelengths/filters. A total of ”photons” are used to produce images, for SED-only-runs the code uses four times less. We divided the -band up in 6 square filters of 1 m width, running from 7.5 m to 12.5 m. The resulting narrow-band model images are multiplied with a Gaussian model for the VLT-UT Airy disk. This represents the aperture field of view with a FWHM appropriate for the particular wavelength. The resulting image is then Fourier transformed and the visibilities extracted for the projected interferometer baseline and position angle. The model images have a pixel size of which is less than half the angular resolution (0.024″) at the longest baseline for the shortest wavelength. The SED is matched from 8 m to 1 mm. The input data are the MIDI flux spectrum, the slope of the SED around 40 m determined from the ISO-SWS spectrum (see Paper I) and the MIPS 70 m flux density. At the longer wavelengths, the integrated fluxes from the following observations are used: 350 m from with the CSO/SHARC instrument (van der Tak et al. 2000), 850 m with JCMT/SCUBA (Di Francesco et al. 2008), and 1.2 mmm with SEST/SIMBA (Faúndez et al. 2004). The far-IR and (sub)mm observations are compared to model SEDs representing all the emitted energy at each wavelength, whilst the MIDI flux spectrum is compared to the model SED with an aperture of 0.6″ corresponding to the MIDI slit width. Matching of the SED and visibilities is performed by eye.
4.2 Preferred model fit
With the parameter values described in the previous section, a model is obtained that produces a reasonable match to both the SED and the visibilities. We have run a total of some 30 models in order to narrow down the parameter values varying the mass infall rate, inclination angle, and the outer radius. A satisfactory model is presented in Figs. 5 and 6. The parameter values of this particular model can be found in Table 2. The figures show that the model fits both the SED and visibilities reasonably. A discrepancy between model and observed SED is found in the near-IR, as expected (see Sect. 4.1.2). The model reproduces quite well the spectral trend of smaller visibilities in the wings of the silicate feature, especially clear on the blue wing. Fig. 6 also displays the visibilities from the spherically symmetric solution that matches the SED and visibilities of configuration D only (from Paper I). Each panel shows the spherically symmetric model visibilities calculated for the appropriate baseline length. It is clear that they provide a considerably worse fit to the visibilities obtained on the additional configurations A, B and C, illustrating the need for multiple baselines.
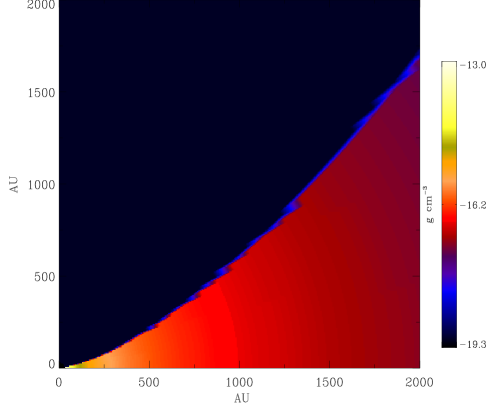
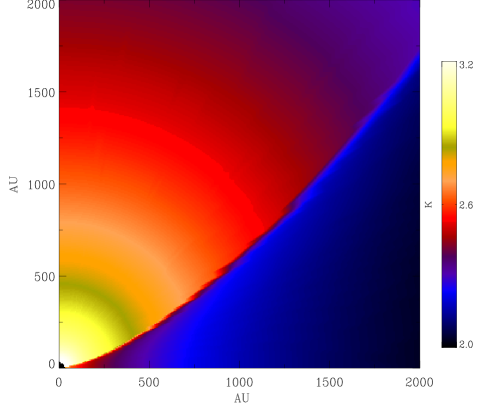
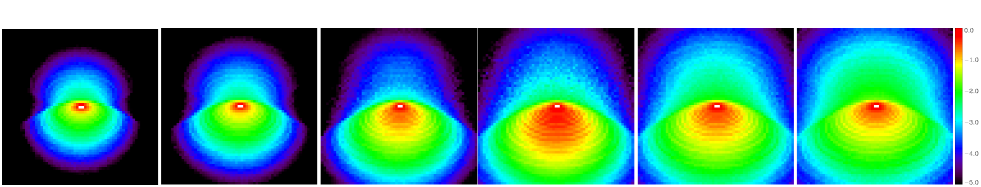
The actual model images of the preferred model are shown in Fig. 8, along with a slice through the spatial temperature and density distribution in Fig. 7. They make clear that the dominant emission regions in the -band at a few 100 AU scale are the envelope regions close to the surface of the outflow cavity. These envelope regions are warmed up due to irradiation by the star. We refer to these regions as “cavity walls” for brevity. The density distribution in Fig. 7 illustrates that the density of the paraboloidal cavity is a few order of magnitude less than that of the envelope. The cavity itself is hotter than the bulk of the envelope but contributes very little to the -band emission due to the low density. Fig. 8 shows that the emission is relatively extended on the probed scales and produces consequently very low visibilities. An increase in optical depth, by either probing a higher inclination angle or increasing the mass infall rate, extinguishes the warmest, inner part of the irradiated walls. As a result visibilities generally decrease with an optical depth increase. However the extremely deep silicate absorption feature of W33A requires a large optical depth. This is the trade off in order to obtain a decent fit. We find that for an inclination angle larger than the mass infall rate needs to be smaller than in order to see the warm cavity wall regions and avoid spatially resolving the -band emission out. The increase in optical depth due to the silicate absorption has a similar effect. Fig. 8 makes clear that the warm inner regions of the cavity walls become progressively fainter with wavelength causing an increase of the typical emitting size and hence lower visibilities.
The same effect is found when one increases the centrifugal radius. The preferred model with an increased to a value of 300 AU shows that the density in the equatorial region increases but the increase is confined to within a fraction of a degree of the equator. The density actually decreases away from the equator allowing a larger area of the cavity walls to be heated up. Visibilities drop therefore with increasing . Further fine tuning of the model parameters would require additional observations at preferentially shorter baselines.
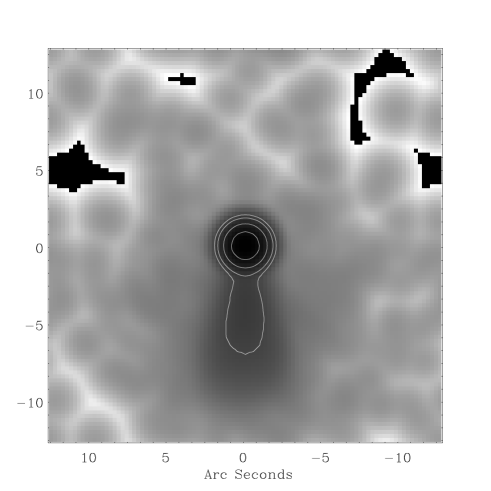
In summary, MIDI visibilities and SED of W33A can be matched with a simple geometry that consists of a protostellar envelope with a radial density distribution that has polar outflow cavities with a opening angle. We note that the modelling of the MIDI data is not very sensitive to the exact density powerlaw in the envelope within the framework of the applied RT model. The density powerlaw in this case is effectively governed by the centrifugal radius. Spherical models as applied to W33A in de Wit et al. (2007) are inadequate in modelling structure on 100 AU scales as Fig. 5 illustrates. On the other hand, resolved observations of MYSOs at m at average inclination angles (de Wit et al. 2009) and at m (van der Tak et al. 2000) provide insight into the density law starting at radii of 1000 AU and indicate a radial density law of . Matching images of W33A with model images at these respective wavelengths will provide much stronger constraints on the centrifugal radius. For now we show in Fig. 9 the 350 m morphology of our model. We have convolved the model image with a 10″ beam appopriate for comparison with the CSO observations presented in van der Tak et al. (2000). The latter observations show a structure more flattened than the model image, however the FWHM of the model image of 16″ is bracketed by the observed FWHM range of 14.4″19.4″, showing a good correspondance. The density at the outer radius of the model complies with expected densities of molecular clouds. Observations in the submm give a lower limit to the size, while in reality the outer parts of the envelope may become even steeper than (e.g. Mueller et al 2002). The outer radius is therefore uncertain by a factor of 2. The best matching RT model presented does not need contributions to the emission from other components within the MYSO environment, instead -band emission on 100 AU scale is completely dominated by the warm cavity walls.
5 Discussion
In several studies the accretion based formation scenario for massive stars has been forwarded partially based on observations with 1″ angular resolution and/or SED studies of MYSOs (e.g. De Buizer et al. 2005). If MYSOs are to be considered young massive stars still in their accretion phase, and this accretion occurs in a similar fashion as in low-mass stars, then circumstellar accretion disks ought to be present. The MYSO accretion disk is expected to be luminous (approaching that of the star itself), and estimated to have a size a few times 100 AU. Our presented analysis prompts the question to what degree an accretion disk can contribute to the mid-IR emission.
5.1 The contribution of an accretion disk
The dust RT code allows the inclusion of a dust disk truncated at the 25 AU dust sublimation radius. As a first step we consider the effect on the model fit by adding such a dusty disk to the preferred model presented previously (Table 2). We emphasize that the disk is directly irradiated by the star, as the space between disk and star is empty in the model. The mass of the dusty disk is initially chosen to be 1% of the stellar mass, i.e. 0.25 . The radial density law of the disk concurs with that expected of an -type disk (i.e. a power law exponent of 1.875, Frank et al. 1985). Due to the large inner truncation radius, the actual accretion luminosity generated by the dust disk is marginal and on the order of 1% of the stellar luminosity (see eq. 6 in Whitney et al. 2003a). The formal accretion rate (see eq. 5 in Whitney et al. 2003a) for is then . We note that the accretion luminosity inside the dust sublimation radius, where no actual disk structure is present in the RT code, is emitted with the stellar spectrum (see Whitney et al. 2003a). The disk has a constant opening angle, i.e. the scaleheight increases linearly with radius. The model disk outer radius is arbitrary because it does not emit in the -band, and is better constrained by millimetre data; for now, it is set to 500 AU.
The resulting model visibilities of a protostellar envelope plus dust disk are shown in Fig. 10. It is clear that such a model violates the observed MIDI visibilities shortward of the silicate absorption feature. At these wavelengths the dust disk contributes to the total flux density, and one can deduce that the disk has a visibility of approximately 70%. In order for this model to be consistent with the observations, we compute that the fractional contribution to the total 8 m flux by the dust disk should be at most 1%, if the disk emission at this wavelength is fully unresolved. If it is marginally resolved (as it is) the 1% upper limit becomes smaller. By running models with increasingly smaller disk masses, we find that this flux fraction is reached for a total mass of the dusty disk of 0.01 , or equivalently . The SED of W33A is still fitted well by the dust diskenvelope model. We thus find that the disk mass is very small compared to the envelope mass, and for reasonable values of that the dust disk accretion rate is more than three orders of magnitude smaller than the envelope mass infall rate. These results on the disk masses are in accordance with other studies of MYSOs (e.g. Murakawa et al. 2008) and also with some evolved early-type Herbig Be stars (Alonso-Albi et al. 2009). Would the disk outer radius be much smaller than the assumed 500 AU, and similar to the small outer radii found for the Herbig Be stars, then the disk mass should be scaled down accordingly; a 50 AU outer radius results in a disk mass of . A small disk mass may imply that such a dust disk is not present, or that it is simply extremely faint in the mid-IR due to the absence of gas and dust opacities in the model disk, which would lead to strong shielding from the stellar radiation field.


Most of the accretion luminosity however would be released within the 25 AU dust sublimation radius by the hot gaseous extension of the dust disk. Due to self-shielding, such a disk probably contains dust at smaller radii than the 25 AU sublimation radius determined from direct irradiation. Inclusion of a self-luminous accretion disk within the dust sublimation radius is required to fit the SED and the near-IR interferometric data of the Herbig B6e star MWC 147 (Kraus et al. 2008). Accretion luminosity generated by an accretion rate of for this particular object is however not essential to model the star’s mid-IR interferometry, which is already reasonably well reproduced by a passive disk. We explore to what extent the mid-IR interferometry of W33A is affected by the inclusion of an optically thick accretion disk. We approximate the reslulting fluxes and visibilities with an optically thick, geometrically thin disk model (see Malbet & Bertout 1995; Malbet et al. 2007) and add these to the preferred envelope model in Table 2. The disk is heated by stationary accretion only and for an accretion rate equalling the mass infall rate () the generated accretion luminosity is for our adopted central star. The spatial properties of the optically thick disk emission is such that 99% of the -band is emitted within 50 AU. Most of the 8 m flux is emitted at 20 AU. The disk thus remains largely unresolved on the employed VLTI baselines with MIDI. Disk accretion at a slower rate than the one assumed are cooler and thus more compact. We choose the inner radius of the disk to be at . The disk temperature falls below 1500 K at 2.5 AU, beyond which the disk opacity is given by both gas and dust.
As in the previous paragraph, if the preferred model visibilities are to be affected by the optically thick disk, the ratio of disk emission to the emerging envelope emission should be at least 1% at 8 m. We calculate the resulting disk spectrum for the said disk accretion rate and apply an extinction of =230 due to the overlying envelope, as found in the line-of-sight to W33A from the preferred model. We show the resulting visibilities in Fig. 10. The figure shows that an disk model embedded in a protostellar envelope is compatible with the observed MIDI visibilities. The model SED does not differ from the envelope only SED, provided that the total luminosity of each model is chosen the same. The disk contributes less than 1% to the total 8 mflux, despite its high luminosity. The envelope of W33A is simply too opaque for any disk emission to be directly observed. MIDI observations of MYSOs with less massive envelopes or at smaller inclinations however may well disclose the presence of an accretion disk in such systems. The expected visibilities would be much larger than the ones observed for W33A (depending on distance and accretion rate), considering the compactness and brightness of the 8 m emission in accretion disks.
The popular YSO SED model grid developed by Robitaille et al. (2006)222URL: http://caravan.astro.wisc.edu/protostars/index.php allows an estimate of the extent to which MYSO SEDs are dominated by dust disk emission. This YSO SED grid makes use of the same 2-D axi-symmetric RT calculations as we use in this paper (Whitney et al. 2003), and the disks in the SED model grid are therefore dust disks. We extract all (135) SEDs corresponding to ZAMS hot stars with a luminosity of and an envelope mass infall rate of at least . Inspection of the fractional disk flux contribution at 8 m (just short of the extended wings of the silicate absorption feature) shows that all except three of the extracted models have a fractional contribution larger than 15%, and half of the models have a contribution larger than 70%. The geometry of the accretion disk determines the total visibility at these wavelengths. The SED model grid thus contains a preponderance of MYSO models with relatively high visibilities, similar to the envelope plus dust disk model presented in Fig.10. At present, the MIDI observations of MYSOs demonstrate the opposite trend however. Visibilities presented for W33A are in line with the low -band visibilities observed for other MYSOs (see Linz et al. 2008; Vehoff et al. 2008; de Wit et al. in prep.). The latter could equally well be explained in the context of cavity wall emission as proposed here for W33A. If verified, then MIDI has not (yet) revealed the presence of a MYSO accretion disk on size scales of AU, but has certainly the potential to do so.
5.2 SED model grid fits
To what extent are models obtained from SED fits consistent with the spatial information on milli arcsecond scales? To address this question, we apply the web-based SED fitter procedure developed by Robitaille et al. (2007) to the W33A SED data shown in Fig. 12. The procedure returns a ranking on the basis of a minimization method, and we discuss the grid models following this ranking.
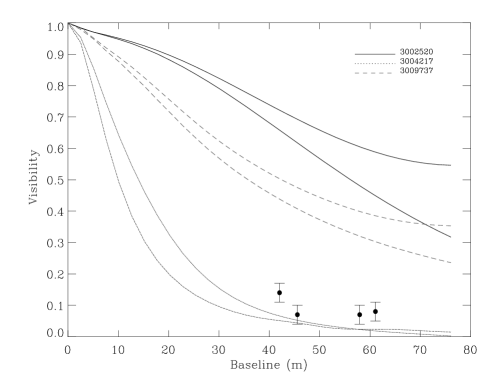
The procedure delivers as best-fit a model consisting of a central hot star and a dust disk (model grid number 3002520, see Table 3). We see from Fig. 12 that the grid model fit to the SED is acceptable, as expected. This particular grid model has a system inclination of , consistent with the one of the reflection nebula. The best-fit model consists of a protostellar envelope with a cavity opening angle relatively large compared to the one derived from the scattering nebula. Moreover a fit of the model to the observed SED requires a distance of 1 kpc, which is a factor too small. The discrepancy between the modelled and observed SED is mainly at the depth of the silicate feature. This depth is better accounted by dust partially consisting of “warm silicates” (see Ossenkopf et al. 1992) as discussed previously; the appropriate set of optical constants is not used in the SED model grid. Broken down in its various contributing components, we find that the grid model SED is completely dominated by disk emission at wavelengths shortward of the silicate absorption feature. The emission accounts for the relatively high flux levels observed shortward of the silicate feature. This is a common property of MYSO SEDs. Spherical and indeed 2D-axisymmetric RT codes for the protostellar envelope are unable to reproduce these high flux levels (see e.g. de Wit et al. 2009). Contrary to the good SED fit, Fig. 13 shows that the corresponding visibilities are far too large. The visibilities are obtained by producing images with the dust RT code using the same parameter file that produced the SED. The grid model visibilities are inconsistent simply because of the dominance of the (compact) disk emission. Clearly, a good model fit to the SED does not guarantee a proper description of the object in consideration; the best-fit grid model violates the spatial information delivered by MIDI.
If we use the known properties of W33A and limit the model distance to be between 3.0 and 4.6 kpc with a maximum foreground extinction of , then we find that the returned fitting models have a strong preference for small inclinations. In the best 10 models, 7 have an inclination of 18.19 degrees (the smallest present within the grid), also the best fit grid model (number 3004217). In addition, the visibilities fit the MIDI observations reasonably well (Fig. 13). The model is characterized by a central cool star with a large stellar radius. Such a description of the MYSO M8E-IR is preferred in Linz et al. (2009). In the case of W33A, the small inclination angles are inconsistent with the allowed range we derived from the scattering nebula. The predicted -band morphology of this model is shown in Fig. 11, and is strongly dominated by the central source which is in contradiction with the observations of W33A (Fig. 4). The ranked fourth model however has a more reasonable inclination angle of (number 3009737). The latter model consists of a hot star and an accretion disk and encounters the previously discussed problems in fitting the visibilities (Fig. 13). If we would apply in selecting a model from the grid all the W33A fiducial parameters (, cavity opening angle ) for a hot star () without a dust disk then the model complying with these constraints is ranked 245th (model number 3003047).
It is clear that the SED model grid can deliver models that fit the SED, but all the SED fitting models presented in this section violate the MIDI visibilities. Regarding W33A, the SED grid does not provide a fit to both SED and visibilities simply because the appropriate models are not present in the grid (see also the discussion in Robitaille 2008; Linz et al. 2009).
| Model | |||||||||
|---|---|---|---|---|---|---|---|---|---|
| () | (kpc) | (kK) | () | () | ( yr-1) | () | () | ||
| 3002520 | 50 | 1.0 | 4.5 | 27.8 | 0.024 | 6.1 | |||
| 3004217 | 18 | 4.4 | 373 | 2.7 | 0.0 | 9.2 | |||
| 3009737 | 50 | 4.6 | 7.0 | 30.7 | 2.0 | 7.4 | |||
| 3003047 | 41 | 3.0 | 6.6 | 10.7 | 0.0 | 0.0 |

6 Conclusions
Observations with MIDI at the VLTI of the MYSO W33A indicate that -band emission on scales of 100 AU is due to warm parts of the envelope close to the outflow cavity, i.e. the “cavity walls”. The overlying envelope, when described by a TSC type geometry is characterised by an equivalent mass infall rate of order and is quite massive. We find that the presence of a dust disk located beyond the dust sublimation radius violates the observed visibilities. In order to make the model consistent with the observations the dust disk is required to be marginal in mass. In contrast, the addition of an optically thick accretion disk interior to the dust sublimation radius has little effect on the visibilities, even when the disk dominates the luminosity. The disk emission is highly extincted by the massive overlying protostellar envelope. MYSOs viewed at smaller inclination and/or with less massive protostellar envelopes have the potential to reveal such accretion disks.
Acknowledgements.
We would like to thank O. Chesneau for his prompt advices, and T. Fujiyoshi for the W33A COMICS data. It is a pleasure to thank B. Whitney for discussions on the subject, and an anonymous referee for his clear remarks that improved this manuscript.References
- Alonso-Albi et al. (2009) Alonso-Albi, T., Fuente, A., Bachiller, R., et al. 2009, A&A, 497, 117
- Alvarez et al. (2004) Alvarez, C., Hoare, M., & Lucas, P. 2004, A&A, 419, 203
- Beltrán et al. (2004) Beltrán, M. T., Cesaroni, R., Neri, R., et al. 2004, ApJ, 601, L187
- Beltrán et al. (2005) Beltrán, M. T., Cesaroni, R., Neri, R., et al. 2005, A&A, 435, 901
- Beuther et al. (2002) Beuther, H., Schilke, P., Sridharan, T. K., et al. 2002, A&A, 383, 892
- Bronfman et al. (1996) Bronfman, L., Nyman, L.-A., & May, J. 1996, A&AS, 115, 81
- Bunn et al. (1995) Bunn, J. C., Hoare, M. G., & Drew, J. E. 1995, MNRAS, 272, 346
- Capps et al. (1978) Capps, R. W., Gillett, F. C., & Knacke, R. F. 1978, ApJ, 226, 863
- Cardelli et al. (1989) Cardelli, J. A., Clayton, G. C., & Mathis, J. S. 1989, ApJ, 345, 245
- Casali et al. (2007) Casali, M., Adamson, A., Alves de Oliveira, C., et al. 2007, A&A, 467, 777
- Cesaroni et al. (2007) Cesaroni, R., Galli, D., Lodato, G., Walmsley, C. M., & Zhang, Q. 2007, in Protostars and Planets V, ed. B. Reipurth, D. Jewitt, & K. Keil, 197–212
- Chesneau et al. (2005) Chesneau, O., Verhoelst, T., Lopez, B., et al. 2005, A&A, 435, 563
- Cohen et al. (1999) Cohen, M., Walker, R. G., Carter, B., et al. 1999, AJ, 117, 1864
- Cyganowski et al. (2008) Cyganowski, C. J., Whitney, B. A., Holden, E., et al. 2008, AJ, 136, 2391
- Davies et al. (2010) Davies, B., Hoare, M. G., Lumsden, S. L., Oudmaijer, R. D., & de Wit, W. J. 2009, arXiv, 0911.4592
- De Buizer (2006) De Buizer, J. M. 2006, ApJ, 642, L57
- De Buizer et al. (2005) De Buizer, J. M., Osorio, M., & Calvet, N. 2005, ApJ, 635, 452
- de Wit et al. (2009) de Wit, W. J., Hoare, M. G., Fujiyoshi, T., et al. 2009, A&A, 494, 157
- de Wit et al. (2007) de Wit, W. J., Hoare, M. G., Oudmaijer, R. D., & Mottram, J. C. 2007, ApJ, 671, L169
- Di Francesco et al. (2008) Di Francesco, J., Johnstone, D., Kirk, H., MacKenzie, T., & Ledwosinska, E. 2008, ApJS, 175, 277
- Draine & Lee (1984) Draine, B. T. & Lee, H. M. 1984, ApJ, 285, 89
- Dutrey et al. (1996) Dutrey, A., Guilloteau, S., Duvert, G., et al. 1996, A&A, 309, 493
- Faúndez et al. (2004) Faúndez, S., Bronfman, L., Garay, G., et al. 2004, A&A, 426, 97
- Frank et al. (1985) Frank, J., King, A. R., & Raine, D. J. 1985, Accretion power in astrophysics, ed. J. Frank, A. R. King, & D. J. Raine
- Furuya et al. (2008) Furuya, R. S., Cesaroni, R., Takahashi, S., et al. 2008, ApJ, 673, 363
- Gibb et al. (2000) Gibb, E. L., Whittet, D. C. B., Schutte, W. A., et al. 2000, ApJ, 536, 347
- Grady et al. (1999) Grady, C. A., Woodgate, B., Bruhweiler, F. C., et al. 1999, ApJ, 523, L151
- Guertler & Henning (1986) Guertler, J. & Henning, T. 1986, Ap&SS, 128, 163
- Hoare (2006) Hoare, M. G. 2006, ApJ, 649, 856
- Hoare & Franco (2007) Hoare, M. G. & Franco, J. 2007, Massive Star Formation, ed. T. W. Hartquist, J. M. Pittard, & S. A. E. G. Falle, 61–+
- Hosokawa & Omukai (2009) Hosokawa, T. & Omukai, K. 2009, ApJ, 691, 823
- Hummer & Storey (1987) Hummer, D. G. & Storey, P. J. 1987, MNRAS, 224, 801
- Indebetouw et al. (2006) Indebetouw, R., Whitney, B. A., Johnson, K. E., & Wood, K. 2006, ApJ, 636, 362
- Jaffe (2004) Jaffe, W. J. 2004, in Society of Photo-Optical Instrumentation Engineers (SPIE) Conference Series, Vol. 5491, Society of Photo-Optical Instrumentation Engineers (SPIE) Conference Series, ed. W. A. Traub, 715–+
- Jiménez-Serra et al. (2007) Jiménez-Serra, I., Martín-Pintado, J., Rodríguez-Franco, A., et al. 2007, ApJ, 661, L187
- Keto (2002) Keto, E. 2002, ApJ, 580, 980
- Kim et al. (1994) Kim, S., Martin, P. G., & Hendry, P. D. 1994, ApJ, 422, 164
- Koehler (2005) Koehler, R. 2005, Astronomische Nachrichten, 326, 563
- Kraus et al. (2008) Kraus, S., Preibisch, T., & Ohnaka, K. 2008, ApJ, 676, 490
- Krumholz et al. (2009) Krumholz, M. R., Klein, R. I., McKee, C. F., Offner, S. S. R., & Cunningham, A. J. 2009, Science, 323, 754
- Leinert et al. (2003) Leinert, C., Graser, U., Richichi, A., et al. 2003, The Messenger, 112, 13
- Leinert et al. (2004) Leinert, C., van Boekel, R., Waters, L. B. F. M., et al. 2004, A&A, 423, 537
- Linz et al. (2009) Linz, H., Henning, T., Feldt, M., et al. 2009, ArXiv e-prints
- Linz et al. (2008) Linz, H., Henning, T., Stecklum, B., et al. 2008, in Astronomical Society of the Pacific Conference Series, Vol. 387, Massive Star Formation: Observations Confront Theory, ed. H. Beuther, H. Linz, & T. Henning, 132–+
- Lucas et al. (2008) Lucas, P. W., Hoare, M. G., Longmore, A., et al. 2008, MNRAS, 391, 136
- Malbet et al. (2007) Malbet, F., Benisty, M., de Wit, W.-J., et al. 2007, A&A, 464, 43
- Malbet & Bertout (1995) Malbet, F. & Bertout, C. 1995, A&AS, 113, 369
- Martins et al. (2005) Martins, F., Schaerer, D., & Hillier, D. J. 2005, A&A, 436, 1049
- Mathis et al. (1977) Mathis, J. S., Rumpl, W., & Nordsieck, K. H. 1977, ApJ, 217, 425
- Matsuura et al. (2006) Matsuura, M., Chesneau, O., Zijlstra, A. A., et al. 2006, ApJ, 646, L123
- Mueller et al. (2002) Mueller, K. E., Shirley, Y. L., Evans, II, N. J., & Jacobson, H. R. 2002, ApJS, 143, 469
- Murakawa et al. (2008) Murakawa, K., Preibisch, T., Kraus, S., & Weigelt, G. 2008, A&A, 490, 673
- Ossenkopf et al. (1992) Ossenkopf, V., Henning, T., & Mathis, J. S. 1992, A&A, 261, 567
- Osterbrock (1989) Osterbrock, D. E. 1989, Astrophysics of gaseous nebulae and active galactic nuclei, ed. D. E. Osterbrock
- Padgett et al. (1999) Padgett, D. L., Brandner, W., Stapelfeldt, K. R., et al. 1999, AJ, 117, 1490
- Przygodda et al. (2003) Przygodda, F., Chesneau, O., Graser, U., Leinert, C., & Morel, S. 2003, Ap&SS, 286, 85
- Rengarajan & Ho (1996) Rengarajan, T. N. & Ho, P. T. P. 1996, ApJ, 465, 363
- Robitaille (2008) Robitaille, T. P. 2008, in Astronomical Society of the Pacific Conference Series, Vol. 387, Massive Star Formation: Observations Confront Theory, ed. H. Beuther, H. Linz, & T. Henning, 290–+
- Robitaille et al. (2007) Robitaille, T. P., Whitney, B. A., Indebetouw, R., & Wood, K. 2007, ApJS, 169, 328
- Robitaille et al. (2006) Robitaille, T. P., Whitney, B. A., Indebetouw, R., Wood, K., & Denzmore, P. 2006, ApJS, 167, 256
- Tamura et al. (1991) Tamura, M., Gatley, I., Joyce, R. R., et al. 1991, ApJ, 378, 611
- Terebey et al. (1984) Terebey, S., Shu, F. H., & Cassen, P. 1984, ApJ, 286, 529
- Ulrich (1976) Ulrich, R. K. 1976, ApJ, 210, 377
- Urquhart et al. (2008) Urquhart, J. S., Hoare, M. G., Lumsden, S. L., Oudmaijer, R. D., & Moore, T. J. T. 2008, in Astronomical Society of the Pacific Conference Series, Vol. 387, Massive Star Formation: Observations Confront Theory, ed. H. Beuther, H. Linz, & T. Henning, 381–+
- van der Tak & Menten (2005) van der Tak, F. F. S. & Menten, K. M. 2005, A&A, 437, 947
- van der Tak et al. (2000) van der Tak, F. F. S., van Dishoeck, E. F., Evans, II, N. J., & Blake, G. A. 2000, ApJ, 537, 283
- Vehoff et al. (2008) Vehoff, S., Nürnberger, D. E. A., Hummel, C. A., & Duschl, W. J. 2008, in Astronomical Society of the Pacific Conference Series, Vol. 387, Massive Star Formation: Observations Confront Theory, ed. H. Beuther, H. Linz, & T. Henning, 444–+
- Walmsley (1995) Walmsley, M. 1995, in Revista Mexicana de Astronomia y Astrofisica, vol. 27, Vol. 1, Revista Mexicana de Astronomia y Astrofisica Conference Series, ed. S. Lizano & J. M. Torrelles, 137
- Warren et al. (2007) Warren, S. J., Hambly, N. C., Dye, S., et al. 2007, MNRAS, 375, 213
- Whitney & Hartmann (1992) Whitney, B. A. & Hartmann, L. 1992, ApJ, 395, 529
- Whitney & Hartmann (1993) Whitney, B. A. & Hartmann, L. 1993, ApJ, 402, 605
- Whitney et al. (2004) Whitney, B. A., Indebetouw, R., Bjorkman, J. E., & Wood, K. 2004, ApJ, 617, 1177
- Whitney et al. (2003a) Whitney, B. A., Wood, K., Bjorkman, J. E., & Cohen, M. 2003a, ApJ, 598, 1079
- Whitney et al. (2003b) Whitney, B. A., Wood, K., Bjorkman, J. E., & Wolff, M. J. 2003b, ApJ, 591, 1049