Spectral evolution of bright NS LMXBs with INTEGRAL: an application of the thermal plus bulk Comptonization model
Abstract
Aims. The aim of this work is to investigate in a physical and quantitative way the spectral evolution of bright Neutron Star Low-Mass X-ray Binaries (NS LMXBs), with special regard to the transient hard X-ray tails.
Methods. We analyzed INTEGRAL data for five sources (GX 5–1, GX 3492, GX 131, GX 31, GX 91) and built broad-band X–ray spectra from JEM–X1 and IBIS/ISGRI data. For each source, X-ray spectra from different states were fitted with the recently proposed model .
Results. The spectra have been fit with a two- model. In all cases the first describes the dominant part of the spectrum that we interpret as thermal Comptonization of soft seed photons (1 keV), likely from the accretion disk, by a 3–5 keV corona. In all cases, this component does not evolve much in terms of Comptonization efficiency, with the system converging to thermal equilibrium for increasing accretion rate. The second varies more dramatically spanning from bulk plus thermal Comptonization of blackbody seed photons to the blackbody emission alone. These seed photons (R12 km, kT1 keV), likely from the neutron star and the innermost part of the system, the Transition Layer, are Comptonized by matter in a converging flow. The presence and nature of this second component (be it a pure blackbody or Comptonized) are related to the inner local accretion rate which can influence the transient behaviour of the hard tail: high values of accretion rates correspond to an efficient Bulk Comptonization process (bulk parameter ) while even higher values of accretion rates suppress the Comptonization, resulting in simple blackbody emission ().
Conclusions. The spectral evolution of the sources has been successfully studied in terms of thermal and Bulk Comptonization efficiency, in relation to the physical conditions in the Transition Layer.
Key Words.:
Stars: individual: GX 5–1, GX 131, GX 31, GX 91, GX 3492 – X-rays: binaries – binaries: close – stars: neutron – accretion1 Introduction
Low-Mass X-ray Binaries (LMXBs) are systems where a compact object, either a neutron star (NS) or a black hole candidate (BHC), accretes matter via Roche lobe overflow from a normal companion of mass ; a peculiar characteristic to this type of system is the formation of an accretion disk in the orbital plane near the compact object. In this paper we studied persistently bright NS LMXBs ( erg sec-1) granting long-lasting observability with instruments operating in the soft/hard X-ray range. The spectra of these sources are usually described as the sum of two components (e.g Mitsuda et al. 1984; White et al. 1988; Barret 2001): a soft component often likely associated with the accretion disk or NS and a hard component interpreted as thermal Comptonization of soft seed photons from the disk and/or the NS by high temperature plasma of electrons near the compact object (so-called corona). The advent of broad-band X-ray missions, such as BeppoSAX, RXTE, INTEGRAL, revealed the presence of a spectral hardening (so-called “hard tails”) above 30 keV on top of otherwise soft spectra (e.g Di Salvo & Stella 2002; Paizis et al. 2006, hereafter P06, and references therein). These hard tails, mostly fit with phenomenological models such as a power-law, have been detected in Z sources (e.g. Frontera et al. 1998; Di Salvo et al. 2002) and also in the bright Atoll source GX 131 (P06).
To explain the origin of these hard tails, different models have been proposed across the years, such as direct synchrotron emission from a jet (Markoff et al. 2005), hybrid thermal/non-thermal Comptonisation (Coppi 1999; Di Salvo et al. 2006) or, more recently, bulk motion Comptonisation (Titarchuk et al. 1997; Farinelli et al. 2008, hereafter TMK97 and F08, respectively). The adoption of different models which satisfactorily fit the hard X–ray component in NS LMXBs clearly shows that it is necessary to look for other observable quantities in these systems, such as their timing properties or correlation among the spectral parameters.
For black-hole sources, a fundamental step forward came with the unambiguous discovery of the saturation of the spectral index (as a function of either the low QPO frequency or seed photon BB normalization) when sources moves from the low/hard to the high/soft state (e.g. Shaposhnikov & Titarchuk 2009, and references therein). Such a saturation can be naturally explained in terms of the presence of a converging flow close to the compact object.
For NS systems, the situation is more complex because of the presence of a firm surface in the compact object that plays a fundamental role in determining the hydrodynamical and radiative system configuration with, in turn, a different spectral appearance. However, given that a PL-like emission can be seen in both BH and NS systems and on the basis of the above reported results for BHs, it is a reasonable working hypothesis that converging flow (with unavoidable qualitative and quantitative differences) is a characteristic of NS systems too, at least in some particular accretion rate states. Close to the NS surface, the radial component of the velocity of matter () dominates over the azimuthal one and it is straightforward to find that 0.56 c at , factor that is actually reduced by the presence of pressure gradients (due to radiation, gas and magnetic field). Our interpretation is that multiple thermal plus bulk Compton scatterings, that occur in a high optical depth environment, are at the origin of the hard tails observed in NS LMXBs, extending over the thermal continuum up to at least 100 keV. A self-consistent physical treatment of the innermost region in the case of neutron stars is presently being developed by Titarchuk & Farinelli (in preparation, see Sect. 4.1). In this paper we adopt the bulk motion Comptonization scenario which also enables a homogeneous interpretation with previous works (e.g. P06, Farinelli et al. 2007, 2008, 2009).
P06 proposed for the first time a unified physical scenario to explain the spectral evolution of NS LMXBs, including the peculiar transient hard tail. All the observed spectral states could be well fit in terms of the interplay of thermal and bulk Comptonization (TC and BC, respectively) using the model (Titarchuk et al. 1996, 1997, hereafter TMK96 and TMK97) in xspec. Thermal Comptonization operates in a region where a hot plasma is present and acts on a population of soft seed photons, hardening the injected seed photon spectrum (from the accretion disk, Fig. 1); the resulting spectrum is extended to higher energies depending on the Comptonization efficiency. Bulk Comptonization operates in the inner part of the system between the Keplerian accretion disk and the NS surface, the Transition Layer, hereafter TL (Fig. 1).
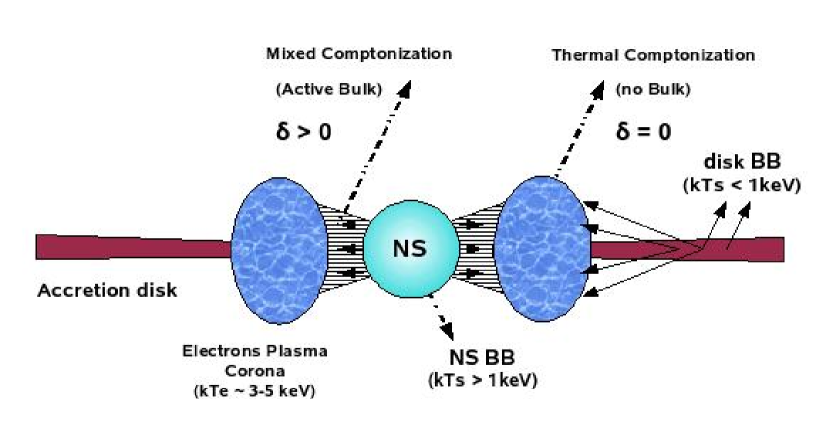
In the inner part of the TL, matter falls towards the NS surface with a preferred (bulk) motion, acting on the inner seed photons of the system; the result is a power-law-shape spectrum at high energies due to the energy transfer from the matter kinetic energy to the photon field (TMK96, TMK97). P06 found evidence that bulk motion is always present and its strength is related to the accretion rate and is suppressed only in the presence of high local luminosity. This scenario has been confirmed also by (Farinelli et al. 2007, hereafter F07), who re-analyzed broad-band BeppoSAX data, applying the model to GX 172.
In the quest to study in a quantitative way the evolution of the parameters describing the innermost physical conditions of NS LMXBs, Farinelli et al. (2008) (hereafter F08), developed a new Comptonization model, 111http://heasarc.gsfc.nasa.gov/docs/xanadu/xspec/models/comptb.html. We recall here the basics of this recent model, referring the reader to F08 for a more detailed description.
The total emerging spectrum is given by
| (1) |
where is the normalization constant, is the illumination factor, is the seed photon spectrum directly seen by the observer and not modified by Comptonization processes. is the Comptonized spectrum obtained by convolution of a seed photon spectrum (blackbody, BB) with the Green’s Function222The Green’s Function, , is the response of the system to the injection of a monochromatic line, see F08 for details., in order to evaluate the effect of TC and BC on the seed photon field.
Parameters of the xspec model are the seed photon temperature , the electron plasma temperature , the spectrum energy slope (i.e. overall Comptonization efficiency) (photon index ), the bulk parameter that quantifies the efficiency of BC over TC and , which assigns a different weight to the two components and . This model enables the co-existence of the direct seed photon component and its Comptonized part, all obtained in a self-consistent way. In Eq.[1] we note that for , we have only , i.e. the direct seed photon component, while for , the direct component is no longer visible and we have only thermal plus bulk Comptonization. In the case of , the BC contribution is neglected, retaining only the TC effects (equivalent to compTT, Titarchuk 1994).
The first application of the model and of the proposed physical scenario to the spectral evolution of a single NS LMXB, to trace in a quantitative way the evolution of the physical parameters, was presented in Farinelli et al. (2009) (hereafter F09) on Cyg X–2, using BeppoSAX data. F09 fitted the spectra of the source with two models. The first one, with bulk parameter =0, was the dominant component and described a pure thermal Comptonization process. This component, due to the Comptonization of cold disk photons by the outer TL, is roughly constant with time and the accretion rate. The second model describes the overall Comptonization (thermal plus bulk, variable parameter) of hotter seed photons close to the neutron star surface by the inner region of the TL (Fig. 1). This component is highly variable with time (and local accretion rate) ranging from significant Comptonization of the hot seed photons (thermal and bulk) to a simple blackbody-like spectrum.
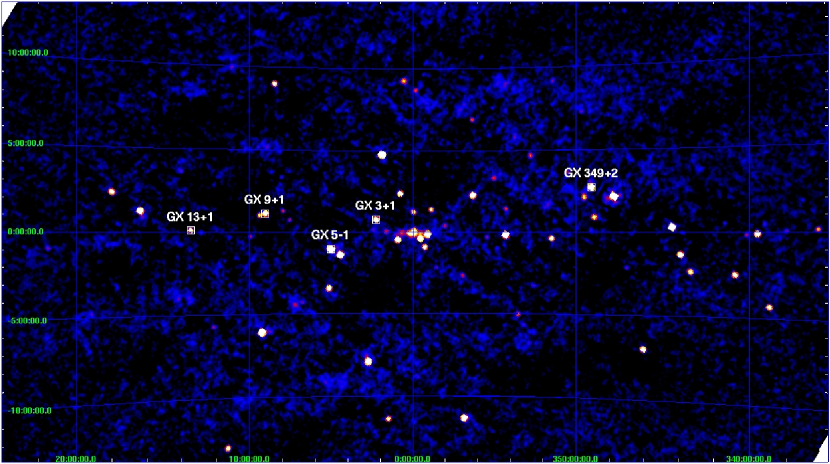
In this work, we extend the above study to five persistently bright NS LMXBs (GX 5–1, GX 3492, GX 131, GX 31 and GX 91). The choice of sources was driven by the validity range of the model (diffusion regime, see F08), associated to a high accretion rate where the transient hard tail can be appreciated. The selected sources are located in the Galactic Centre where, because of the presence of a large number of X–ray sources, angular resolution is an issue. The imager IBIS (Ubertini et al. 2003) and the X-ray instrument JEM–X (Lund et al. 2003) on-board INTEGRAL (Winkler et al. 2003) have the necessary angular resolution to disentangle the different contributions, allowing to build good quality broad-band X-ray spectra (3–200 keV).
| Source | Da | pointings # | |
| Z sources | |||
| GX 5–1 | 7.2 | 2.8 | 137 |
| GX 3492 | 9.2 | 0.77 | 51 |
| Atoll sources | |||
| GX 131 | 7 | 3.2 | 35 |
| GX 31 | 5 | 1.66 | 166 |
| GX 91 | 5 | 0.8 | 87 |
| a The distance is in kpc. | |||
| b In units of cm-2. | |||
2 Observations and data analysis
2.1 Analysis process
The sample of the NS LMXB chosen is given in Tab. 1 and comprises five bright (“GX”) bulge sources. We have analyzed INTEGRAL pointings collected from September 2006 to September 2007 from the AO4 and AO5 INTEGRAL Key Programmes. The exposure time for each pointing is variable (sec). The selected pointings satisfy the condition that every source is from the pointing direction. Analysis was performed on JEM-X1 and IBIS/ISGRI (Lebrun et al. 2003) data with the software package OSA, version 7.0.
The energy bands selected for JEM-X1 imaging analysis are: 3–10 keV and 10–20 keV while the energy band selected for IBIS/ISGRI imaging analysis is: 20–40 keV. The mosaic of the Galactic Centre (Fig. 2) was constructed using all available pointings in the IBIS/ISGRI energy band: as expected, all the sources studied were active and detectable. We used the official INTEGRAL catalog to extract spectra for the single sources and the JEM-X default response matrix (256 bins) and a new re-binned (57-bins) IBIS/ISGRI response matrix.
2.2 Spectral classification with HR
In order to study the spectral evolution of the sources, we associated a numeric parameter to the spectrum of each pointing, the Hardness Ratio (hereafter HR). The HR is computed from the counts per second extracted from the two energy bands of JEM-X analysis as follows:
| (2) |
where S (soft) is the count rate for the 3–10 keV energy band while H (hard) is the count rate for the 10–20 keV energy band. HR is an indicator of the source spectral state: the lower the HR the harder the spectrum. Despite its unusual/counterintuitive form, we adopted the definition (2) because the good statistics showed by JEM-X granted us integer values for a more hand-light management of HR boundaries and, as explained in section 4.1, we wanted to connect the increase of HR with the increase of the accretion rate.
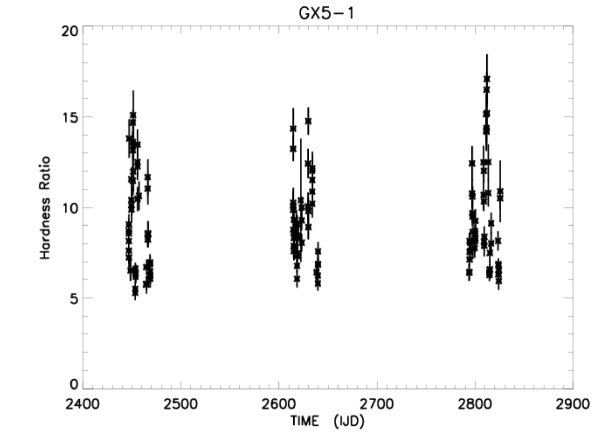
Considering the overall behaviour, each source presents a characteristic HR variability spanning wide ranges (for example see Fig. 3 for GX 5–1). From a morphological evaluation of the spectral characteristics together with HR values, we classified every spectrum and averaged similar spectra to improve the overall statistics.
2.3 The spectral fitting
Before spectral fitting, all the spectra were re-binned so as to contain at least 25 counts in every channel; we considered only the counts within the interval 5–18 keV for JEM-X1 spectra and the counts starting at 22 keV for IBIS/ISGRI. Systematic errors of for IBIS/ISGRI data and for JEM-X1 data were added. Instrumental cross-calibration factors were allowed to vary between 0.8 and 1.2 (IBIS/ISGRI) with JEM-X1 frozen at 1. In all cases the value of the constant stabilized itself at the maximum value, 1.2. For the spectral analysis, we used xspec version 12.
In all cases we started the fitting process with the simplest general model considering only one and then in more complex cases, we added a second , as in F08. Hence (excluding the cross-calibration constant), in the most complex cases, we used:
| (3) |
where (Morrison & McCammon 1983) is the multiplicative model that takes into account the interstellar absorption at low X-ray energies; the column-density, , was fixed during the fitting to the values shown in Table 1, as the absence of data below 5 keV does not allow the correct determination of this parameter through the fitting process.
We note that , with parameters set to and , is a thermal accounting only for TC processes (equivalent to ). Instead, , when present, is either a mixed (shape-wise equivalent to , where we consider both TC and BC processes), or a (neither TC nor BC setting ). For the cases in which the fit required two components, a single temperature of the plasma was considered (see section 3 for details).
2.4 Other parameters
Some other quantities can be obtained from the fit processes in order to have more information about the system and the environment around the NS:
-
•
: the unabsorbed total flux (erg sec-1 cm-2) in the interval 0.1–200 keV and relative luminosity (using distances in Table 1);
-
•
CAF: the Compton Amplification Factor that allows us to evaluate the total energy gain of the seed photons through the TC process. It is defined as , where flux1 (erg sec-1 cm-2) is the unabsorbed energy flux associated to the thermally Comptonized photons (calculated on compTB[1] with ), and flux2 (erg sec-1 cm-2) is the unabsorbed energy flux associated to the seed photons (calculated on compTB[1] with and ) in the energy interval 0.1–200 keV;
-
•
The optical depth : the Comptonization parameter from the fit is linked to and as:
(4) where for a spherical geometry with optical radius , while for a “slab” geometry (Titarchuk & Lyubarskij 1995). In this paper we presumed a slab geometry corresponding to a not very extended corona (see also F08);
-
•
: the blackbody radius of , computed using .
3 Results
The detailed results per source are given in the next subsections while here we note a few general trends and issues. Each source shows a given range of variability for HR values which enabled us to identify a different number of intervals (see Table 2) and spectral states per source . Our sources showed all types of behaviours, and hence we used a model with: two s in which the first is thermal and the second mixed (GX 5–1 and GX 131); two s in which the first is thermal and the second a blackbody (GX 91 and GX 3492); one thermal (GX 31). The absence of data below 5 keV led to a high uncertainty in determining in the component (the softest). In fact, for the majority of cases only an upper limit could be determined.
As already experienced in F08 and F09, in the cases where we applied a mixed , the lack of an observable
cut-off prevented us to allow
, and to be free during the fit: indeed if the number of the free parameters exceeds the number of the observable quantities (normalization, cut-off and the PL slope), a degeneration of model parameters
occurs and hence more than one model solution can be obtained. The degeneration
can be reduced: as in F08, the value for was set equal to the one, considering a single plasma temperature (indeed a preliminary fit provided similar values for both ). Furthermore, we fixed (GX 5–1) or (GX 131) to the values corresponding to a minimum (chosen inside an interval calculated with the xspec command steppar). We left free during the fit to evaluate the bulk efficiency.
| Interval | pointings | Texp (ksec) | |
| N | JEM-X | ISGRI | |
| GX 5–1 | |||
| HR7 | 36 | 102 | 69 |
| 7HR10 | 52 | 155 | 106 |
| 10HR12 | 23 | 58 | 38 |
| HR12 | 26 | 80 | 53 |
| GX 131 | |||
| HR10 | 11 | 29 | 18 |
| 10HR13 | 10 | 26 | 17 |
| HR13 | 14 | 35 | 23 |
| GX 91 | |||
| HR7.5 | 19 | 50 | 34 |
| 7.5HR8.5 | 47 | 119 | 79 |
| HR8.5 | 21 | 54 | 37 |
| GX 3492 | |||
| HR7 | 20 | 52 | 35 |
| HR7 | 31 | 82 | 53 |
| GX 31 | |||
| HR8 | 37 | 107 | 70 |
| 8HR9.5 | 103 | 323 | 210 |
| HR9.5 | 26 | 78 | 52 |
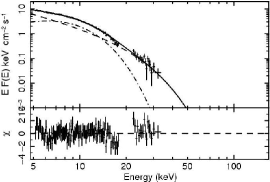
3.1 GX 5–1
The variability range of HR (definition [2]) spans between 5–18 (as shown in Fig. 3). By classifying the spectral shapes, we obtained four mean spectra : the first spectrum, the hardest one, corresponding to HR7, shows, as expected, a hard tail between 40 and 150 keV. Indeed a hard tail in the spectra of GX 5–1 had already been detected by previous observations (Asai et al. 1994; Paizis et al. 2005, P06). The second spectrum (7HR10) shows a weaker hard tail between 40 and 150 keV; the third one (10HR12) does not show a hard tail and is soft; the last spectrum is the softest (HR12), again with no hard tail (see also Kuulkers et al. 2007; Paizis et al. 2005, on the variability of GX 5–1).
As required by the data, we used the two-component model for all spectra in the fitting process and obtained the following results (see Table 3):
-
•
with the component, we describe the presence of the TC process as the dominant mechanism in all the four spectra. For higher values of HR, we observe that the CAF decreases, while increases. This is consistent with a reduction in the efficiency of the TC process;
-
•
the seed photon temperatures of the two components are different: in the thermal , remains always below 1 keV while in the mixed it has higher values keV;
-
•
considering the errors associated, the plasma temperature remains within the interval 3–4 keV;
-
•
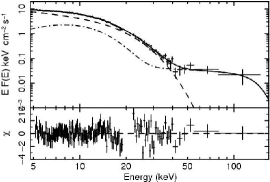
with in all spectra, we describe an additional component that shows a specific evolution: in the first two spectra (HR7, 7HR10) we obtained a mixed that allows us to evaluate the BC contribution with the parameter . The spectra are representative of the intermediate state (according to the definition given by P06). For increasing values of HR, shows a decreasing trend that assigns less importance to the mixed component. In fact, in the third and fourth spectra (10HR12, HR12), we found a best-fit using the in the blackbody mode ( );
-
•
with increasing values of HR, the size of the blackbody-emitting region, in , increases, remaining compatible with the NS and/or TL dimensions.
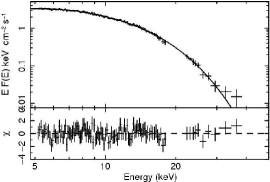
In Fig. 4 we show the EF(E) spectra (keV cm-2 sec-1) of GX 5–1 for two of the four selected HR intervals (corresponding to the hardest and the softest case).
| parameter | HR7 | 7HR10 | 10HR12 | HR12 |
| ( thermal: , ) | ||||
| a | ||||
| a | ||||
| d | 3.6 | 3.8 | 2.6 | 2.1 |
| CAF d | 1.6 | 1.5 | 1.4 | 1.3 |
| a | ||||
| b,d | ||||
| a | - | - | ||
| - | - | |||
| - | - | |||
| c,d | 2.5 | 2.5 | 3.5 | 3.5 |
| c,d | 0.3 | 0.3 | 0.4 | 0.5 |
| (12) | (12) | (11) | (14) | |
| 133/130 | 101/118 | 82/114 | 96/109 | |
| a In keV. | ||||
| b In km. | ||||
| c In units of erg sec-1, in the 0.1–200 keV energy range. | ||||
| d Computed as reported in section 2.4. | ||||
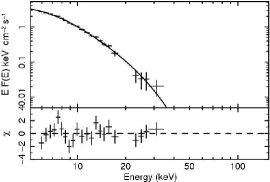
3.2 GX 131
Examining the shape of the GX 131 JEM-X1 and IBIS/ISGRI spectra, we identified three intervals in which we recognized different phases of the spectral evolution and so we obtained three mean spectra : the first mean spectrum corresponding to HR10 shows a hard tail between 30 and 150 keV characterizing an intermediate state. A hard tail in the spectra of GX 131 had been discovered using INTEGRAL data by P06. The mean spectrum corresponding to 10HR13 shows a high/soft state, deprived of the hard tail, similar to the mean spectrum corresponding to HR13. Spectral analysis was carried out using a double-component model only for the HR10 spectrum, while the other two were fit with one thermal (see Table 4, Fig. 5). Looking at the parameters we note:
-
•
the component, present in all spectra, describes the TC process. Again, for increasing values of HR we observe a strong decrease of CAF values and increase of , a signature of decreasing efficiency of the TC process;
-
•
the seed photon temperatures in the two components are different in the first spectrum (in the other two spectra only one thermal was needed);
-
•
the plasma temperature remains within the range of 3–4 keV;
-
•
we applied the component only to the first spectrum as a mixed : we detected a hard tail and an active BC process with ; the value was fixed to a value that corresponds to a minimum (see section 3);
-
•
the luminosity of the blackbody is very low with respect to the total X-ray luminosity of the source; the dimension of the blackbody emission region, 2 km, is compatible with part of the NS surface and/or TL dimensions.
| parameter | HR10 | 10HR13 | HR13 |
|---|---|---|---|
| ( thermal: , ) | |||
| a | |||
| a | |||
| d | 3.8 | 2.4 | 1.7 |
| CAF d | 1.8 | 1.2 | 1.1 |
| a | - | - | |
| b,d | - | - | |
| a | - | - | |
| - | - | ||
| - | - | ||
| - | - | ||
| c,d | 1.8 | 0.6 | 0.5 |
| c,d | 0.03 | - | - |
| (1.7) | - | - | |
| 14/20 | 32/19 | 22/19 | |
| a In keV. | |||
| b In km. | |||
| c In units of erg sec-1, in the 0.1–200 keV energy range. | |||
| d Computed as reported in section 2.4. | |||

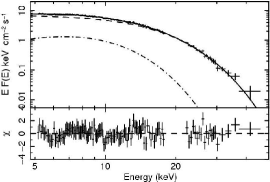
3.3 GX 91
We classified every JEM-X1 and IBIS/ISGRI spectrum of GX 91 according to their shape and identified three HR intervals (HR7.5, 7.5HR8.5 and HR8.5) obtaining three mean spectra. All spectra showed the high/soft state, in fact, the spectral analysis was carried out with a double-component model using a thermal plus a second as a pure blackbody (see Table 5, Fig. 6):
-
•
the TC process was described with in all three spectra;
-
•
similarly to the previous cases, the seed photon temperatures differ in the two components: about 0.6 keV for the first one and near 2 keV for the second one;
-
•
in this case, the plasma temperature is not well constrained by the data;
-
•
the presence of the second component reveals a constant blackbody contribution. Below 20 keV the blackbody emission is more important than the TC one. The size of the blackbody-emitting region is nearly constant (3.4 km), as is the corresponding X-ray luminosity ( erg sec-1). Despite the different HR selection, these spectra do not show a dramatic evolution, as shown in the previous cases.
| parameter | HR7.5 | 7.5HR8.5 | HR8.5 |
|---|---|---|---|
| ( thermal: , ) | |||
| a | |||
| a | |||
| d | 2.5 | 2.0 | 1.9 |
| CAF d | 1.5 | 1.4 | 1.4 |
| ( blackbody: ) | |||
| a | |||
| b,d | |||
| a | - | - | - |
| - | - | - | |
| - | - | - | |
| c,d | 1.1 | 1.3 | 1.1 |
| c,d | 0.2 | 0.2 | 0.2 |
| (18) | (15) | (18) | |
| 67/106 | 83/103 | 79/105 | |
| a In keV. | |||
| b In km. | |||
| c In units of erg sec-1, in the 0.1–200 keV energy range. | |||
| d Computed as reported in section 2.4. | |||
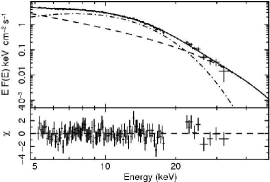
3.4 GX 3492
For GX 3492, we identified two intervals (HR7 and HR7) showing similar spectra from which we obtained two mean spectra: both are of the high/soft state well described with a double-component model consisting of a thermal and a second as blackbody. We obtained the following results (see Table 6, Fig. 7):
-
•
with , we describe the TC process; for higher values of HR we do not observe the typical growth but instead it is constant, which brings to a constant CAF value and invariant TC efficiency;
-
•
similarly to previous sources, the seed photon temperatures are different when two components are taken into consideration: keV for the thermal , higher temperature for the blackbody photons;
-
•
the plasma temperature stays always around 3 keV;
-
•
using , we detected the presence of a blackbody component: the blackbody luminosity does not vary ( erg sec-1) and its emission region is of a dimension compatible with the NS and/or TL.
| parameter | HR7 | HR7 |
|---|---|---|
| ( thermal:, ) | ||
| d | 5.0 | 5.2 |
| CAF d | 2.1 | 2.0 |
| ( blackbody: ) | ||
| b,d | ||
| - | - | |
| - | - | |
| - | - | |
| c,d | 3.4 | 2.2 |
| c,d | 0.3 | 0.3 |
| (9) | (14) | |
| 104/115 | 76/114 | |
| a In keV. | ||
| b In km. | ||
| c In units of erg sec-1, in the 0.1–200 keV energy range. | ||
| d Computed as reported in section 2.4. | ||
3.5 GX 31
In the case of GX 31, we identified three intervals of HR in which we recognized different phases of spectral evolution in the JEM-X1 and IBIS/ISGRI spectra: the three mean spectra obtained (HR8, 8HR9.5 and HR9.5) all represent the high/soft state. The spectral fitting was carried out on all spectra with a single component model, a thermal (see Table 7, Fig. 8):
-
•
as usual with we describe the TC process; similarly to previous sources, for increasing HR values, we see a decreasing of the TC efficiency (decrease of CAF and increase of );
-
•
the seed photon temperature is of the order 1 keV;
-
•
the plasma temperature is of the order 3–4 keV.
| parameter | HR8 | 8HR9.5 | HR9.5 |
| ( thermal: , ) | |||
| a | |||
| a | |||
| c | 4.4 | 3.2 | 1.9 |
| CAF c | 1.4 | 1.2 | 1.1 |
| b,c | 0.3 | 0.2 | 0.2 |
| 65/106 | 116/114 | 100/108 | |
| a In keV. | |||
| b In units of erg sec-1, in the 0.1–200 keV energy range. | |||
| c Computed as reported in section 2.4. | |||
4 Discussion
In this work we have studied the spectral evolution of five NS LMXBs using the new Comptonization model (Farinelli et al. 2008). The model is formed by two components: one component is a pure blackbody directly seen by the observer while the other one takes into account the contribution of thermal and bulk Comptonization of the blackbody seed photons. To fit the INTEGRAL broad band spectra we applied two models.
Every source has shown a different spectral evolution: for GX 5–1 and GX 131 increasing values of the HR correspond to spectral changes from the intermediate state (high-energy hard tail), to the high/soft state (no hard tail) while in the other three sources we did not observe dramatic spectral changes despite a progressive softening for increasing accretion rate (i.e. HR, see below).
In all sources, regardless of HR, the total energetic budget is dominated by the thermal Comptonization component of keV BB-like seed photons off warm electrons with temperature typically of 3–4 keV and optical depth of a few (). This component, described with a thermal (equivalent to a ) is likely associated to the region
between the geometrically thin accretion disk and the NS surface, the so-called Transition Layer, where most of the gravitational energy release takes place (Titarchuk & Fiorito 2004, F08).
When a second model is required by the data, a second hotter seed photon population ( 1–2 keV) can be identified, interpreted as the BB-like contribution, from the innermost region of the system, the NS and the inner TL (Fig. 1).
A rough estimation of the apparent emitting radius of this BB region provides in fact results which are consistent with a NS and/or TL radius, with 2–12 km. In the case of GX 5–1 for which we have the best statistics, we can see (Table 3) an increase of the emitting BB region with the HR (hence , see next section).
Where a single model has been applied, we observe that has values very near to 1 keV, unlike the other cases where is either below this energy ( 0.6 keV) or higher (always keV). In the single model case, it is likely that a part of the seed photons come from the disk (very soft photons 0.5 keV) but emission from the TL and NS surface can contaminate the seed photon population increasing its overall temperature (1 keV). As none of the observed sources reached the hard state (see, e.g. Fig. 2 in P06) where an increased height-scale of the TL may provide a high geometrical coverage of the central compact object, the lack of a second component in the case of a single component in the fit is likely due to poor statistics in addition to small energy coverage in the band where most of the BB-like emission is present.
In terms of the observable quantities which may trace the source spectral evolution, it is important to focus on the -parameter, related to the slope of the Green’s function of the Comptonization region. As already pointed out in F08, for intermediate state sources, we are dealing in fact with two observable indexes, one related to the pure TC process, while the second one related to the TC+BC efficiency. The first index, only depends on the system temperature and optical depth and is actually directly related to the Comptonization parameter 333The Comptonization parameter is defined as where the optical depth of the scattering region in NS LMXBs is typically ., while the second index contains an additional dependence on the bulk parameter (see Eq.[23] in TMK97). In both cases, the slope of the Green’s function depends on the first eigenvalue of the spatial problem for a bounded medium. In fact, when BC is present, it is possible somewhat to treat the two regions (internal bulk-dominated TL, external TC dominated TL plus innermost accretion disk) in a separate way, each one with its own spatial configuration and associated eigenvalue problem and derived spectral index. This translates into two different observable quantities (the thermal index , plus the TC+BC index). For systems where BC is suppressed, or strongly reduced, goes to zero, and according to Eq.[13] in TMK97, the two indexes tend to be coincident and one single TC component is observed.
The parameter measures the slope of the spectrum and can quantify the effective efficiency of the overall Comptonization processes i.e. how much energy has been exchanged between the photon field and the electrons. In the first (the thermal one), becomes higher as HR increases: we can always observe the spectral evolution in the direction of a progressive softening, a smaller quantity of energy is gained by the photon field reducing the maximum energy of the spectra. Indeed, the energy gained by thermal Comptonization, CAF, decreases as increases, giving a physical evaluation of the energy gain through the TC process. The value related to the mixed is generally higher with respect to the thermal one. It encloses both the BC and TC contributions coming from the TL, the NS itself and possibly the inner accretion disk.
4.1 The transient nature of the hard tail
Bulk Comptonization acts in the TL, where the orbits of the in-falling matter deviate from the Keplerian behaviour to adjust to the NS rotation speed.
Here the matter, during its bulk motion (, Titarchuk Farinelli in prep.), interacts with the photon field that
originates in the inner disk, in the TL itself and from the impact of matter onto the NS.
Since the physical conditions of the interaction region strongly influence the BC, this produces the transient high energy hard tail behaviour.
Indeed the local accretion rate of the source determines the resulting radiation pressure in the inner TL
and in turn influences its hydrodynamical configuration.
At very high values of accretion rate, the radiation pressure behaves like an intense photon wind (Bradshaw et al. 2007) able to break efficiently the accreting matter, abating the , hence suppressing (or strongly reducing) the Fermi first-order process in photon energy gain which is responsible for generation of the hard X-ray tail. In the model, the quantity that allows us to evaluate the hard tail- link is the bulk parameter which is defined as
| (5) |
where and are local luminosity and accretion rate in Eddington’s units, respectively, and
is the adimensional electron temperature444We note that the correct expression of the parameter is the one
written in the text. In Farinelli et al. (2008), Eq.[2] erroneously indicates a square root in the right term..
Increasing the accretion rate leads the system to a state closer to thermal equilibrium between electrons and the background radiation field, through a more efficient Compton cooling of the electrons themselves (lower average energy gain of the photons and CAF decreasing).
In this work this spectral evolution has been observed for increasing values of HR with a slow spectral softening starting from the intermediate state (low HR) to the high/soft state (high HR values). Given the spectral evolution observed in all the sources, we can reasonably associate the increase of HR to an increasing accretion rate. As already pointed out by previous authors (e.g. Homan et al. 2007; Lin et al. 2009; van der Klis 2001), the role of in the spectral evolution of these sources is not straightforward. Furthermore, from the observational results of a detailed time-resolved BeppoSAX spectral analysis of the Z source Cyg X–2, F09 proposed to split the general definition of the accretion rate , into two quantities, and , obeying the condition . The reason for this resides in the fact that the total measured source bolometric luminosity does not follow the expected trend from the source position in the hardness intensity diagram, and thus cannot be used as a tracer of the total mass accretion rate. Moreover, as also reported in Bradshaw et al. (2007), for high (Eddington-like) accretion rates, a strong radiation pressure may originate in the accretion disk, which may eventually eject part of the accreting material, so that the mass flow at the disk/TL radius is actually lower than the one flowing trough the Roche lobe. In this picture, the key role in the innermost system is played by .
We can thus read the observed spectral variability of our sources as the interplay of TC and BC processes according to the aforementioned considerations and increasing HR:
-
1.
for a low , the hard tail results to be absent or too weak because of a lack of a sufficiently high number of BC scatterings able to elevate the hard tail contribution over the sensitivity instrument threshold. The observed spectrum is due mainly to the TC of soft seed photons from the disk and NS in the hot corona plasma (tens of keV). This is the case of low-dim Atolls not considered here (see F08);
-
2.
for higher , the corona starts to be efficiently cooled and the overall spectrum is dominated by TC in a cold corona (kTe of a few keV). BC may not be strong enough to be detected (GX 31, GX 91, GX 3492, but see also point 4);
-
3.
for increasing , we can observe the intermediate state (GX 5–1, GX 131 in this work), in which the hard tail is visible. Its importance and intensity are strongly influenced by the accretion rate value. Indeed only within a narrow range of , the number of BC interactions is high enough to produce the hard tail and at the same time the radiation pressure is not too high to reduce the BC efficiency. The fine tuning of these two quantities could be the reason why we observe a little number of sources hosting NS displaying hard tails, and even more, only a given spectral state within a given source (the intermediate state, corresponding to the so-called Horizontal Branch of Z sources);
-
4.
in case of very high values of , the hard tail disappears or its contribution results to be negligible being under the sensitivity threshold. The pressure in the TL increases because a large amount of matter releases a lot of energy at the impact onto the NS or within the TL itself and this can inhibit the bulk motion. The source moves to the high/soft spectral state in which the spectrum is mainly defined by the TC process plus eventually a variable contribution of a blackbody component emitted from the TL and/or the NS surface (GX 31, GX 91, GX 3492).
In the case of GX 5–1 for which we have the best statistics and HR evolution, we can relate the increasing trend of the value (size of the BB emitting region) to the increasing values of HR/: at large values of local accretion rates, i.e. radiation pressure, bulk motion is inhibited and the matter falls at lower speed, following a complex behaviour for which it may arrive on the NS surface spreading over a larger area (Inogamov & Sunyaev 1999). The large amount matter covering the NS can produce a layer able to suppress the radio emission (P06).
4.2 The absence of the hard tail in most bright Atoll ”GX” sources
From the spectral states observed and the information obtained by the fitting process, it is difficult to say whether the permanent absence of hard X-ray tail in sources like GX 31, GX 91 is due to a locally high-enough accretion rate which is able to suppress BC or in fact to the opposite case, where BC is present but too low to be detected. In these sources such a transient feature has in fact never been observed, even with the past missions.
In GX 5-1, a transient hard X-ray tail was instead previously detected by Ginga (Asai et al. 1994) and INTEGRAL (Paizis et al. 2005), in GX 13+1 it was detected for the first time by INTEGRAL (P06), while in GX 3492, the feature was observed by BeppoSAX (Di Salvo et al. 2001) when the source was out-of-flare. Also taking into account previous results on other Z sources (GX 172, Sco X–1, GX 3400, see e.g. P06 for a complete list of references) it is currently difficult to provide a global self-consistent picture which may explain this variate phenomenology. We still do not have an observable parameter which may help to unambiguously determine, at least phenomenologically, which is the threshold for triggering the hard X-ray tail.
In the accretion scenario where the production of high-energy photons is inhibited by high local levels of the accretion rate (bulk stopping through radiation pressure), one should look with particular care at the contribution of the BB-like emission to the total luminosity. If this BB-like emission is due to energy release of the accreting matter both to the NS surface and in the TL (through viscous dissipation), one would expect that hard tail quenching would be correlated to higher percentage of the BB contribution to the total luminosity.
Using as a possible tracer of the local accretion rate, and thus of the BC efficiency, would have the advantage of being distance-independent, a not secondary issue when comparing the estimated luminosity among sources. Such a quantity may however be significantly different among sources which show a hard X-ray tail, ranging from 2% (in GX 131, this work) to 25% in Cyg X–2 (F08). Of course, a satisfactory energy coverage below 1 keV is of prime importance to give unbiased estimations of this contribution. In this sense the reported values of and in the present work must be treated very cautiously, as the energy band covered by JEM-X1 starts from 5 keV, thus above the threshold where most of BB energy is emitted.
With this prescriptions in mind, following the spectral evolution of GX 5–1 with increasing HR, we note that the presence of the hard X-ray tail is anti-correlated with the total source luminosity and the percentage of the energetic budget carried-out by the BB-like component, even though the latter change is marginal (see Fig. 4 and Table 3). The other sources for which we can detect two components in the spectrum along the observed HR range, but with no bulk contribution detected, unlike for GX 5–1, are GX 91 and GX 3492 (see Figs. 6 and 7). In this case case the BB-like component contributes about 20% and 10% of the source luminosity, respectively. Little can be said though for GX 31 or GX 131 for which we do not have the double component evolution along with HR.
5 Conclusions
Despite an increasing amount of theoretical and observational results, the picture giving rise to the presence of variable PL-like hard X-ray emission in NS LMXBs is far from being completely clear. Investigating the physical conditions of the innermost region of these sources is very critical. The bulk Comptonization approach, together with the physical scenario proposed, can be considered an important step forward in trying to understand what is at the origin of the transient hard tail behaviour. Nevertheless, it is currently not easy to satisfactorily explain why sources like GX 91 and GX 5–1 that do have a similar X-ray spectrum and related parameters (kTe, kTs of the disk and NS-TL, ) yet differ for such an important feature as the presence of the transient hard tail.
Even if we were able to quantify (disentangling it from the overall ) we would face the problem of understanding what makes change in the different cases i.e. what is the origin of the inflow anisotropy. In fact, a theoretical and/or observational quantity which may unambiguously trigger or dump the hard X-ray emission has not been identified yet. Of course it is possible that we are dealing with a multi-parametric problem.
A possible highly speculative explanation could reside in the different composition of the disk: in Atoll sources the orbital period is in general relatively short (5 hr) and in the Z sources for which it is known it is long (10 hr). This would indicate that Z sources may contain an evolved companion star (e.g. Cyg X–2, GX 14 Liu et al. 2007, and references therein) while Atolls contain a main sequence star (e.g. Aql X–1, Ser X–1 Liu et al. 2007, and references therein). This is consistent with the fact that the number of known Atoll sources (25) is higher than the number of known Z sources (8, Liu et al. 2007) since the main sequence phase of a star is much longer than the one of an evolved star making the detection of Atolls more likely (Verbunt & van den Heuvel 1995). The accretion disk coming from an evolved companion (Z-like system) would be Helium-rich (i.e. heavier) hence a higher luminosity would be required to stop the bulk flow, making the detection of BC more likely.
The chemical composition of the disc could be inferred by the duration of type I X-ray bursts: long bursts are thought to be due to mixed H/He burning, triggered by thermally unstable He ignition, expected at inferred near-Eddington accretion rates (Kuulkers et al. 2007). However the observed behaviour is far from being interpreted within the current bursting theory due to the presence of unexpected short burst or even absence thereof, in a regime where long bursts would be expected (Kuulkers et al. 2007). The reason of this could reside in the fact that in the case of high accretion rates, accretion is unlikely through a plain disc and the TL configuration may also have an effect on the bursting behaviour.
Additional or concurring effects could reside in the presence of a counter-rotating NS with respect to the Keplerian disk rotation, whose main effect could be the presence of a higher level of gravito-kinetic energy release in the TL, in the region where the angular velocity adjusts from the Keplerian regime to that of the slowly spinning NS. Such higher energy release would in turn produce a higher local radiation pressure gradient, more efficient in stopping bulk. Unfortunately, this is highly speculative and currently difficult to prove. A first approach to tackle the problem would be a more detailed study of the spectral evolution together with the long-term behaviour of these sources (Savolainen et al, in prep.).
Understanding the origin of the hard tails in NS LMXBs is important to make a decisive step forward, from phenomenology (power-laws) to physics. This step forward will not make us understand hard tails alone, on the contrary, hard tails could be the observational feature that gives us the means to understand the mechanism of accretion flows in general, see e.g Shrader & Titarchuk (1998) and Ferrigno et al. (2009) for an application of bulk motion Comptonization in Black Hole LMXBs and High Mass X-Ray Binaries, respectively.
Acknowledgements.
Based on observations with INTEGRAL, an ESA project with instruments and science data centre funded by ESA member states (especially the PI countries: Denmark, France, Germany, Italy, Spain, and Switzerland), Czech Republic and Poland, and with the participation of Russia and the USA.LM, AP and RF acknowledge L. Titarchuk for useful discussions. AP acknowledges the Italian Space Agency financial and programmatic support via contract I/008/07/0. This work has been partially supported by the grant from Italian PRIN-INAF 2007, ”Bulk motion Comptonization models in X-ray Binaries: from phenomenology to physics”, PI M. Cocchi.
References
- Asai et al. (1994) Asai, K., Dotani, T., Mitsuda, K., et al. 1994, PASJ, 46, 479
- Bandyopadhyay et al. (1999) Bandyopadhyay, R. M., Shahbaz, T., Charles, P. A., & Naylor, T. 1999, MNRAS, 306, 417
- Barret (2001) Barret, D. 2001, Advances in Space Research, 28, 307
- Bradshaw et al. (2007) Bradshaw, C. F., Titarchuk, L., & Kuznetsov, S. 2007, ApJ, 663, 1225
- Chenevez et al. (2006) Chenevez, J., Falanga, M., Brandt, S., et al. 2006, A&A, 449, L5
- Coppi (1999) Coppi, P. S. 1999, in ASP Conf. Ser. 161: High Energy Processes in Accreting Black Holes, ed. J. Poutanen & R. Svensson
- Di Salvo et al. (2002) Di Salvo, T., Farinelli, R., Burderi, L., et al. 2002, A&A, 386, 535
- Di Salvo et al. (2006) Di Salvo, T., Goldoni, P., Stella, L., et al. 2006, ApJ, 649, L91
- Di Salvo et al. (2001) Di Salvo, T., Robba, N. R., Iaria, R., et al. 2001, ApJ, 554, 49
- Di Salvo & Stella (2002) Di Salvo, T. & Stella, L. 2002, in Proc. of the XXXVIIth Rencontres de Moriond, The Gamma-Ray Universe, Ed. A. Goldwurm, Doris N. Neumann and Jean Tran Thanh Van, 67
- Farinelli et al. (2009) Farinelli, R., Paizis, A., Landi, R., & Titarchuk, L. 2009, A&A, 498, 509 (F09)
- Farinelli et al. (2007) Farinelli, R., Titarchuk, L., & Frontera, F. 2007, ApJ, 662, 1167 (F07)
- Farinelli et al. (2008) Farinelli, R., Titarchuk, L., Paizis, A., & Frontera, F. 2008, ApJ, 680, 602 (F08)
- Ferrigno et al. (2009) Ferrigno, C., Becker, P. A., Segreto, A., Mineo, T., & Santangelo, A. 2009, A&A, 498, 825
- Frontera et al. (1998) Frontera, F., dal Fiume, D., Malaguti, G., et al. 1998, in The Active X-ray Sky: Results from BeppoSAX and RXTE, ed. L. Scarsi, H. Bradt, P. Giommi, & F. Fiore, 286
- Grimm et al. (2002) Grimm, H.-J., Gilfanov, M., & Sunyaev, R. 2002, A&A, 391, 923
- Homan et al. (2007) Homan, J., van der Klis, M., Wijnands, R., et al. 2007, ApJ, 656, 420
- Iaria et al. (2004) Iaria, R., di Salvo, T., Robba, N. R., et al. 2004, Nuclear Physics B Proceedings Supplements, 132, 608
- Iaria et al. (2005) Iaria, R., di Salvo, T., Robba, N. R., et al. 2005, A&A, 439, 575
- Inogamov & Sunyaev (1999) Inogamov, N. A. & Sunyaev, R. A. 1999, Astronomy Letters, 25, 269
- Kuulkers et al. (2007) Kuulkers, E., Shaw, S. E., Paizis, A., et al. 2007, A&A, 466, 595
- Kuulkers & van der Klis (2000) Kuulkers, E. & van der Klis, M. 2000, A&A, 356, L45
- Lebrun et al. (2003) Lebrun, F., Leray, J. P., Lavocat, P., et al. 2003, A&A, 411, L141
- Lin et al. (2009) Lin, D., Remillard, R. A., & Homan, J. 2009, ApJ, 696, 1257
- Liu et al. (2007) Liu, Q. Z., van Paradijs, J., & van den Heuvel, E. P. J. 2007, A&A, 469, 807
- Lund et al. (2003) Lund, N., Budtz-Jørgensen, C., Westergaard, N. J., et al. 2003, A&A, 411, L231
- Markoff et al. (2005) Markoff, S., Nowak, M. A., & Wilms, J. 2005, ApJ, 635, 1203
- Mitsuda et al. (1984) Mitsuda, K., Inoue, H., Koyama, K., et al. 1984, PASJ, 36, 741
- Morrison & McCammon (1983) Morrison, R. & McCammon, D. 1983, ApJ, 270, 119
- Paizis et al. (2005) Paizis, A., Ebisawa, K., Tikkanen, T., et al. 2005, A&A, 443, 599
- Paizis et al. (2006) Paizis, A., Farinelli, R., Titarchuk, L., et al. 2006, A&A, 459, 187 (P06)
- Shaposhnikov & Titarchuk (2009) Shaposhnikov, N. & Titarchuk, L. 2009, ApJ, 699, 453
- Shrader & Titarchuk (1998) Shrader, C. & Titarchuk, L. 1998, ApJ, 499, L31
- Titarchuk (1994) Titarchuk, L. 1994, ApJ, 434, 570
- Titarchuk & Fiorito (2004) Titarchuk, L. & Fiorito, R. 2004, ApJ, 612, 988
- Titarchuk & Lyubarskij (1995) Titarchuk, L. & Lyubarskij, Y. 1995, ApJ, 450, 876
- Titarchuk et al. (1996) Titarchuk, L., Mastichiadis, A., & Kylafis, N. D. 1996, A&AS, 120, 171
- Titarchuk et al. (1997) Titarchuk, L., Mastichiadis, A., & Kylafis, N. D. 1997, ApJ, 487, 834 (TMK97)
- Ubertini et al. (2003) Ubertini, P., Lebrun, F., Di Cocco, G., et al. 2003, A&A, 411, L131
- Ueda et al. (2005) Ueda, Y., Mitsuda, K., Murakami, H., & Matsushita, K. 2005, ApJ, 620, 274
- Ueda et al. (2004) Ueda, Y., Murakami, H., Yamaoka, K., Dotani, T., & Ebisawa, K. 2004, ApJ, 609, 325
- van der Klis (2001) van der Klis, M. 2001, ApJ, 561, 943
- Verbunt & van den Heuvel (1995) Verbunt, F. & van den Heuvel, E. P. J. 1995, in X-ray binaries, p. 457 - 494, ed. W. H. G. Lewin, J. van Paradijs, & E. P. J. van den Heuvel, 457–494
- White et al. (1988) White, N. E., Stella, L., & Parmar, A. N. 1988, ApJ, 324, 363
- Winkler et al. (2003) Winkler, C., Courvoisier, T. J.-L., Di Cocco, G., et al. 2003, A&A, 411, L1