Mid-Infrared diagnostics of metal-rich H ii regions from VLT and Spitzer Spectroscopy of Young Massive Stars in W31††thanks: Based on observations made with ESO telescopes at the Paranal Observatory under programme ID 077.C-0550(A) and the Spitzer Space Telescope which is operated by the Jet Propulsion Laboratory, California Institute of Technology under NASA contract 1407
Abstract
We present near-IR VLT/ISAAC and mid-IR Spitzer/IRS spectroscopy of the young massive cluster in the W31 star-forming region. –band spectroscopy provides refined classifications for four cluster members O stars with respect to Blum et al. In addition, photospheric features are detected in the massive Young Stellar Object (mYSO) #26. Spectroscopy permits estimates of stellar temperatures and masses, from which a cluster age of 0.6 Myr and distance of 3.3 kpc are obtained, in excellent agreement with Blum et al. IRS spectroscopy reveals mid-infrared fine structure line fluxes of [Ne ii-iii] and [S iii-iv] for four O stars and five mYSOs. In common with previous studies, stellar temperatures of individual stars are severely underestimated from the observed ratios of fine-structure lines, despite the use of contemporary stellar atmosphere and photoionization models. We construct empirical temperature calibrations based upon the W31 cluster stars of known spectral type, supplemented by two inner Milky Way ultracompact (UC) H ii regions whose ionizing star properties are established. Calibrations involving [Ne iii] 15.5m/[Ne ii] 12.8m, [S iv] 10.5m/[Ne ii] 12.8m or [Ar iii] 9.0m/[Ne ii] 12.8m have application in deducing the spectral types of early- to mid- O stars for other inner Milky Way compact and UC H ii regions. Finally, evolutionary phases and timescales for the massive stellar content in W31 are discussed, due to the presence of numerous young massive stars at different formation phases in a ‘coeval’ cluster.
keywords:
(Galaxy:) open clusters and associations: individual: W31 (G10.2–0.3) – (ISM:) HII regions – Stars: early-type; – Stars: fundamental parameters – Infrared: ISM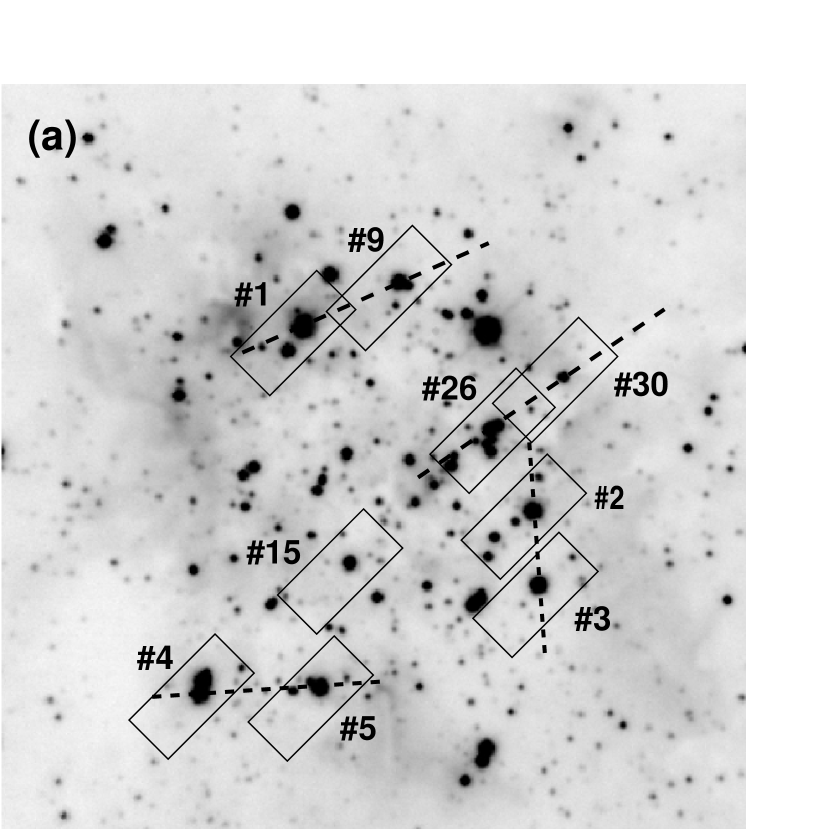
1 Introduction
The formation of high mass stars remains an unsolved astrophysical puzzle (Zinnecker & Yorke, 2007; Clarke & Bonnell, 2008). Unlike the situation for low mass stars, for which multiwavelength observations are plentiful, very massive stars (25M⊙) are born within compact, deeply embedded star-forming regions, severely restricting observations to either the far-infrared where heated dust dominates their appearance, or radio wavelengths where gas ionized by the central star(s) can be characterised. Either way, high mass stars themselves cannot be seen directly within these ultracompact (UC) Hii regions (Churchwell, 2002) until the column density of dust along our line of sight falls below 2–4 magnitudes in the -band. To date, only a few such cases have been identified – G23.96+0.15 (Hanson, Luhman & Rieke, 2002; Crowther & Furness, 2008), G29.96–0.02 (Watson & Hanson, 1997; Hanson et al., 2005), G45.45+0.06 (Blum & McGregor, 2008), W51d (Barbosa et al., 2008) – with the stellar content of other UC H ii regions reliant upon indirect far-IR or radio continuum techniques (Wood & Churchwell, 1989; Kurtz et al., 1994).
Fortunately, the advent of efficient mid-infrared imaging and spectroscopy from space with Infrared Space Observatory (ISO, Kessler et al., 1996) and Spitzer (Werner et al., 2004), plus ground-based 8–10m telescopes has opened up a further window to study such embedded regions. Specifically, a number of fine-structure lines from ionized regions are seen in the mid-infrared, notably [Ne ii-iii], [S iii-iv], which albeit indirect, provide information upon the hardness of the extreme ultraviolet (EUV) radiation from their constituent O stars. Such diagnostics, analogous to the optical forbidden lines of [O ii-iii] and [S ii-iii], may allow the ‘inverse problem’ of establishing properties of the ionizing stars of ultra-compact and compact H ii regions (see Okamoto et al., 2003). Alternatively, indirect approaches based upon near-IR hydrogen and helium nebular lines are also employed (e.g. Lumsden et al., 2003; Blum & McGregor, 2009).
To date, tests of photoionization and stellar atmosphere models using these mid-IR line diagnostics have been rather unsatisfactory. Firstly, this is because H ii regions are usually ionized by multiple early-type stars in compact clusters, and secondly the strength of mid-IR fine structure lines is affected both by the energetic photons from OB stars and nebular properties. The most comprehensive study of a UC H ii region attempted to date has been by Morisset et al. (2002) for G29.96–0.02 whose results suggested a temperature of kK for the ionizing star, in contrast to kK from a non-LTE analysis of near-IR spectroscopy for the star (Hanson, Puls & Repolust, 2005).
Photoionization models are widely used to infer the stellar properties of both embedded H ii regions (Sellmaier et al., 1996; Giveon et al., 2002; Simón-Díaz & Stasińska, 2008; Pérez-Montero & Vílchez, 2009) and entire galaxies from mid-IR fine structure lines (Lutz et al., 1996; Rigby & Rieke, 2004). If the highly discrepant effective temperatures obtained for G29.96–0.02 using indirect techniques were repeated for other, single, embedded O stars, then previously published results from mid-IR diagnostics may be called into question, especially those at high metallicity (e.g. Thornley et al., 2000).
The focus of the present study is the Galactic Giant HII region (GHR) W31, specifically the young star cluster (10.2–0.3, hereafter W31) discussed by Blum, Damineli & Conti (2001). This cluster, for which Blum et al. (2001) established a distance of 3.4 kpc and extinction of = 1.7 mag, hosts a minimum of four ‘naked’ O-type stars, as deduced from near-IR spectroscopy, plus a number of massive stars which are still embedded at near-IR wavelengths (hereafter massive YSOs) plus numerous UC H ii regions (Ghosh et al., 1989). As such, this cluster provides an excellent opportunity to study the different early evolutionary phases of massive star formation. In addition, it possesses an unusual morphology, in that the highest mass stars are located at the periphery of the cluster, in contrast to the mass segregated morphology of most other young clusters (de Grijs et al., 2002; Allison et al., 2009). We shall exploit this unusual geometry through spectroscopy of individual early-type stars in W31 with the Infrared Spectrograph(IRS, Houck et al., 2004) aboard Spitzer, supplemented with and band VLT observations with the Infrared Spectrograph and Array Camera(ISAAC, Moorwood & Cuby, 1998).


Our aim is to compare photoionization model predictions of individual H ii regions with stellar temperatures obtained directly from near-IR spectroscopic analysis. We are thus able to significantly increase the statistics of H ii regions for which mid-IR diagnostics are available, whose ionizing stars are well constrained. Our results are of potential application in deducing ionizing stars of UC H ii regions within the inner Milky Way based upon fine structure diagnostics available from ground-based telescopes, namely [S iv] 10.5m and [Ne ii] 12.8m (Zhu et al., 2008). The diffraction limit of 8–10m telescopes in the N-band is 0.4 arcsec, equivalent to a physical scale of 0.01 pc at a distance of 5 kpc, well below the 0.1 pc size of typical UC H ii regions (Okamoto et al., 2003).
The present paper is structured as follows. § 2 detail the VLT and Spitzer observations, while §3 presents refined spectral classification of naked O stars in W31. § 4 presents the mid-IR fine structure lines from W31 sources, including predictions from photoionization models and empirical calibrations. A discussion of mid-IR fine structure lines is presented § 5 together with the massive star content of W31. Brief conclusions are drawn in § 6.
2 Observations and Data Reduction
Two main observational datasets are used in the present study, obtained with the VLT ISAAC near-IR spectrograph and Spitzer IRS mid-IR spectrograph.
2.1 VLT ISAAC spectroscopy
Long-slit - and -band near-infrared spectroscopy of sources in W31 were obtained with the ISAAC instrument mounted at the Very Large Telescope between 4th April–17th June 2006 (Programme 077.C-0550(A), P.I. Crowther). Four slit positions were used, as illustrated in Fig. 1(a). Each included two or more targets of interest, namely the naked O stars and massive YSO’s from Blum et al. (2001).
The detector was the 10241024 Hawaii Rockwell array, while three medium resolution grating settings (0.775Å/pixel) were obtained, centred at 1.71, 2.09 and 2.20 m. These observations were obtained at low airmass during variable seeing conditions using a 0.6 arcsec wide slit, and reduced using standard iraf packages. We observed using ABBA nod-cycles, a standard infrared A number of AB pairs were obtained for each grating setting with wavelength solutions achieved from comparison XeAr arc images. From these, the observations covered 1.671–1.751 m, 2.029–2.155 m and 2.140–2.265 m at spectral resolutions of 3.8Å, 6.0Å and 6.0Å respectively, as measured from arc lines.
| EW (Å) | Spectral Type | |||||
|---|---|---|---|---|---|---|
| He ii (1.692m) | He i(1.700m) | log | This Work | Blum et al. | Further Comments | |
| #2 | 0.59 0.08 | 0.2 | 0.470.06 | O3–4 V | O5.5 V | N iii, C iv in emission |
| #3 | 0.40 0.08 | 0.27 0.07 | 0.170.20 | O5 V | O5.5 V | N iii, C iv in emission |
| #4 | 0.58 0.06 | 0.87 0.06 | –0.170.07 | O5.50.5 V | O5.5V | N iii, C iv in emission |
| #5 | 0.68 0.05 | 0.96 0.04 | –0.150.05 | O5.50.5 V | O5.5V | N iii, C iv in emission, nebular |
| emission from Br, He i 2.058m | ||||||
Telluric correction was achieved by spectroscopy of early-G dwarfs observed at similar airmass to W31, corrected for their spectral features using high resolution observations of the Sun, adjusted for the radial velocity and spectral resolution of the template stars. An extensive discussion of telluric correction for medium resolution near-IR spectroscopy of early-type stars is provided by Hanson et al. (2005). The 2.09m setup suffered from low-level variable structure which was accentuated upon flat-fielding, arising from a 50 Hz pickup inherent to the instrument. Only the two other settings were flat-fielded. Consequently, the continuum S/N achieved was lower for this grating position (100) than the other settings (200).
2.2 Spitzer IRS spectroscopy
W31 was observed with the mid-IR spectrograph IRS in GO #3337 (W31CLUST, P.I. Crowther) between 14-16 September 2005 using all four modules, sampling the short wavelength region at low and high resolution (SL and SH), plus the long wavelength region at low and high resolution (LL and LH). In addition, W31 was imaged with the IRAC instrument (Fazio et al., 2004) at 3.6, 4.8, 5.8 and 8.0m, using HDR mode, with 12 s exposures in a 12 position, Reuleaux dither pattern. Unfortunately, the IRAC 5.8 and 8.0m imaging and long wavelength IRS observations were heavily saturated, so our analysis largely focuses upon the SH, staring mode (30 sec, 6 cycles) observation with IRS, obtained at two nod positions. The spectral range covered was 9.9–19.6m, at a resolution of R600.
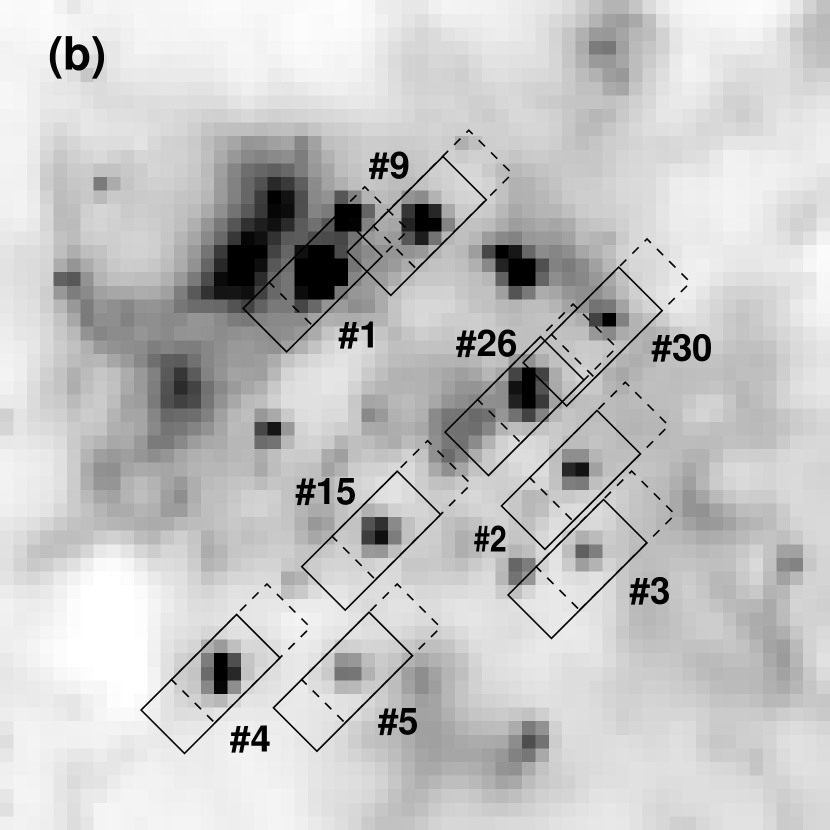
The individual 4.711.3 arcsec2 (25 pix) apertures from the first nod position are superimposed upon a band image of W31 in the Fig 1(a). Fig 1(b) shows both IRS nod positions together with the IRAC 3.6m image of W31. A background subtraction was applied to these two dimensional IRS datasets – prior to extraction – using a dedicated OFF position at 18:09:30.4 –20:20:00 (J2000) from a second set of cluster positions which are not presented in this paper. This pointing gives a correction for nebular emission in the extended H ii region, including the PAH’s. However, it does not correct for emission from the dense material close to each of the targeted stars.
Observations have been processed and calibrated in the standard IRS pipeline to basic calibrated data products (BCDs), using a version which is compatible with S16.2. Multiple exposures at the same position have been co-added at the BCD (2 dimensional) level, and the OFF position has been used to correct rogue pixels and subtract the extended background. Then the spectra were extracted with the offline S16.2 post-BCD pipeline. Spectra from the two staring-mode nods were averaged, except for cases for which a single nod was used to minimise contamination. Specifically, only nod 1 was used for #1 and #26 and only nod 2 was used for #2 and #30. This is to avoid contamination from potentially interloping sources during extraction of the spectra (recall Fig. 1(b)). These sources are identified within the nods from any of the available imaging observations, including unsaturated regions of the IRAC datasets.
Since the width of the full width at half maximum of the central Airy pattern of the IRS point source function is comparable to the size of the SH slit itself, the full slit is extracted, so it is not possible to extract (or even easily identify) separate sources or the background.
Each of the echelle spectral orders were trimmed at the red edges, corresponding to the lower part of the array where photometric response sharply drops. Final spectra have been created by merging the orders into single spectra, with excellent inter-order agreement when the point-source flux calibration is applied, with only minor offsets (well within the photometric uncertainties of 15%), indicating that the dominant source signal from each of the intended targets behave more consistently as point sources than extended sources. Formally, a 1 absolute flux calibration of 10% was achieved, except for the raw 18.7m [S iii] line which was saturated in a few cases. These were corrected by linearization and extrapolation, from which an additional 5% uncertainty resulted.
Finally, we should note that these observations have been obtained when the SH array was relatively undamaged by the cumulative effects of space weather, thus receive good correction for rogue pixels with data at the OFF position. Furthermore, these observations are not affected in the calibrations or data quality by more recent versions of the pipelines (through S18.x) which mainly benefit the IRS peak up imaging AOT and data obtained with more aged arrays.
3 Properties of early-type stars in W31 from near-IR spectroscopy
3.1 Near-IR classification of W31 O stars
In Figure 2 we present our - and -band ISAAC spectroscopy of naked O stars in W31, together with spectra of template O stars from the high resolution atlas of Hanson et al. (2005). Crowther & Furness (2008) have recently presented a method of determining O dwarf subtypes from the ratio of the observed He ii 1.692m to He i 1.700m equivalent widths. These were measured from the emission line fitting (ELF) suite of routines in the starlink spectroscopic analysis programme dipso and are presented in Table 1 together with inferred spectral types.
Stars #3, #4 and #5 all show clear He i and He ii absorption features, from which O5 V, O5.50.5 V and O5.50.5 V classifications are obtained, according to Fig. 3 of Crowther & Furness (2008), in close agreement with Blum et al. (2001). -band spectroscopy reveals C iv, N iii emission features, plus Br and He ii 2.189m absorption, the core of the former filled-in by nebular Br emission.
In the case of #2, negligible He i 1.700m is observed, from which an O3–4 V classification is inferred. If we had classified #2 on the basis of its -band spectrum, the presence of significant C iv emission would have suggested a spectral type of O4V or later (Hanson et al., 2005).
| W31 | MK | ||||||
|---|---|---|---|---|---|---|---|
| # | mag | mag | mag | mag | mag | mag | |
| 2 | 10.02 | 1.16 | –0.10 | 1.26 | 2.29 | -4.98 | 12.71 |
| 3 | 10.30 | 1.06 | –0.10 | 1.16 | 2.11 | -4.39 | 12.58 |
| 4 | 10.34 | 0.88 | –0.10 | 0.98 | 1.78 | -4.27 | 12.83 |
| 5 | 10.37 | 1.26 | –0.10 | 1.36 | 2.47 | -4.27 | 12.17 |
| Average | 2.16 | 12.57 | |||||
| 0.29 | 0.29 |

| W31 | Sp. | Teff | log g | M | ||||
|---|---|---|---|---|---|---|---|---|
| # | Type | kK | yr-1 | cgs | km s-1 | mag | ||
| 2 | O3–4 V | 45 | 5.79 | –5.5 | 4.00 | 100 | 61 | –4.84 |
| 3 | O5 V | 43 | 5.56 | –5.8 | 4.04 | 200 | 46 | –4.38 |
| 4 | O5.50.5 V | 41 | 5.36 | –6.1 | 4.04 | 200 | 36 | –4.01 |
| 5 | O5.50.5 V | 41 | 5.62 | –5.9 | 3.94 | 100 | 45 | –4.67 |
3.2 Distance and Age of W31
Armed with our refined spectral types, we now use the near-IR photometry from Blum et al. (2001) and observational absolute magnitude calibration of Martins & Plez (2006) to obtain a revised distance to W31. This is presented in Table 2, in which observed colours of O stars provide a direct measurement of interstellar extinction from from Indebetouw et al. (2005). For #4 and #5 uncertainties in subtypes have little influence upon absolute magnitudes, while subtype uncertainties formally introduce absolute magnitude uncertainties of up to 0.3 mag for #2 and #3. These are mitigated somewhat by the typical spread of 0.5 mag in absolute magnitudes for individual spectral types.
Overall, we obtain a higher interstellar extinction of = 2.16 0.29 mag towards W31 than Blum et al. (2001) on the basis of updated intrinsic colours, but this is largely cancelled out by the revised absolute magnitude calibration. As such, we obtain a very similar overall distance (3.3 kpc) to the 3.4 kpc distance obtained by Blum et al. (2001).
For an adopted Galactic Centre distance of 8.0 kpc (Reid, 1993) for the Sun, our preferred distance to W31 suggests that it lies 4.8 kpc from the Galactic Centre. The Galactic oxygen metallicity gradient is (O/H) = –0.044 0.010 dex kpc-1 (Esteban et al., 2005), from which we anticipate that W31 is 40% more metal-rich than H ii regions within the Solar circle, i.e. O/H +12 8.81, compared to 8.65 for the Orion Nebula at a Galactocentric distance of 8.4 kpc (Esteban et al., 2005; Simón-Díaz et al., 2006). We are unable to derive a neon or sulphur abundance for W31 from the IRS spectroscopy since the nebular electron temperature is unknown.

Having established a slightly refined cluster distance, we now estimate stellar temperatures (and in turn luminosities) from spectroscopic fits to the near-IR diagnostics with the non-LTE CMFGEN code of Hillier & Miller (1998). CMFGEN solves the radiative transfer equation in the co-moving frame, under the additional constraint of statistical equilibrium. Since CMFGEN does not solve the momentum equation, a density or velocity structure is required. For the supersonic part, the velocity is parameterized with a classical -type law, with an exponent of =1 adopted. This is connected to a hydrostatic density structure at depth, such that the velocity and velocity gradient match at the interface. The subsonic velocity structure is set by a corresponding fully line-blanketed plane-parallel TLUSTY model (v.200, see Lanz & Hubeny, 2003). The atomic model is similar to that adopted in Hillier et al. (2003), including ions from H, He, C, N, O, Ne, Si, S, Ar, Ca and Fe, with metal abundances increased by a factor of two relative to those of the Sun from Asplund et al. (2004) for O, Ne and Ar, or Cox (2000) otherwise.


We have assumed a depth-independent Doppler profile for all lines when solving for the atmospheric structure in the co-moving frame, while in the final calculation of the emergent spectrum in the observer’s frame, we have adopted a uniform turbulence of 50 km s-1. Incoherent electron scattering and Stark broadening for hydrogen and helium lines are adopted. Finally, we convolve our synthetic spectrum with a rotational broadening profile. In view of the quality of our observations, rotational velocities should be reliable to km s-1.
For an adopted (uniform) terminal wind velocity of 2000 km s-1, surface gravity of and abundance ratio of He/H=0.1 by number, we varied the stellar radius and (non-clumped) mass-loss rate until an acceptable match to the He ii 1.692m, He i 1.700m, Br and He ii 2.189m was achieved. For the case of #2 (O3–4 V), for which negligible He i 1.700m absorption is detected, we favour a temperature of 45 kK since higher temperatures produce too weak Br absorption. Spectroscopic fits are presented in Fig. 3 while resulting physical and wind properties are shown in Table 3. Fits to diagnostic lines are generally satisfactory with the exception of #3 for which He ii 2.189m suffers from low S/N, such that we rely upon the weaker 1.692m line in this instance. Note that prominent nebular emission features are seen in the hydrogen Brackett series, with the possible exception of #2.
Our spectroscopic analysis did not yield a precise measurement of surface gravities (and in turn masses), so having established temperatures and luminosities, we overplot 2 theoretical isochrones from Lejeune & Schaerer (2001) in Figure 4, from which an age of 0.6 Myr was obtained, together with corresponding surface gravities and mass estimates (see Table 3). Three of the four O stars lie along a common isochrone of 0.5 Myr, although from Fig. 4 #5 suggests a greater age of 1 Myr. However, it is possible that this source is a close double with equal mass components, whose absolute magnitudes would have = –3.9 mag for a distance of 3.3 kpc. In this case, individual components would have properties similar to those of #4 in Table 3, reducing the inferred cluster age to 0.5 Myr.
3.3 Near-IR spectroscopy of massive YSOs
In addition to the naked O stars, we have obtained ISAAC spectroscopy of four massive YSOs in W31 - high mass stars whose photospheric features are veiled by circumstellar dust with IR excesses due to hot dust. We observed #1, #9, #26 and #30 from Blum et al. (2001) at both grating settings in the -band spectra, but only #26 and #30 were observed in the -band. These datasets are shown in Figure 5. In general, our observations confirm the lower quality datasets of Blum et al. (2001), with nebular Brackett emission lines, plus nebular He i 1.700, 2.058m for #30.

Uniquely among the massive YSOs, #26 shows clear photospheric Br absorption in addition to weak nebular Br emission, plus He ii 2.189m, 1.692m and He i 1.700m absorption. From the observed H-band classification diagnostics in the H-band we estimate an approximate spectral type of O6, since (He ii 1.692)/ (He i 1.700) –0.26. This star appears to be at the point of revealing its photosphere, despite the presence of a strong IR dust excess ( = 2.72 mag from Blum et al., 2001).
In principle, we could estimate the physical properties of #26, by combining an estimate of its stellar temperature (36 kK) with the -band photometry from Blum et al. (2001), the mean -band extinction for the naked O stars ( 3.4 mag) and the adopted distance of 3.3 kpc. For this star the -band is selected on the basis of significant dust emission in the -band. Unfortunately, the resulting parameters for #26 are unphysical since would be obtained, i.e. mass of only 4(!) for an assumed surface gravity of = 4.0. More plausibly, #26 may possess a small dust excess, i.e. a large colour excess due to extreme extinction. Recall that this source lies close to the reddening line in the colour-magnitude diagram (Blum et al., 2001). If the color were to arise solely from line-of-sight extinction, mag, from which = 6.2 would be obtained. In reality, the physical properties of #26 will lie between these two extreme cases. Regardless, this star warrants further study since it uniquely displays both stellar and circumstellar features amongst early-type stars in W31.
| Line Fluxes (Intensities) | ||||||||
| Object | AK | [SIV] | [NeII] | [NeIII] | [SIII] | log | log | log |
| 10.5µm | 12.8µm | 15.5µm | 18.7µm | |||||
| W31 #1 | 0.1380.002 | 9.660.10 | 1.190.01 | 11.40.1 | ||||
| 2.1 | 0.4730.006 | 12.70.1 | 1.460.02 | 13.70.1 | -0.940.01 | –0.460.01 | –1.460.01 | |
| W31 #2 | 0.4520.004 | 7.430.07 | 3.960.03 | 12.70.1 | ||||
| 2.1 | 1.550.01 | 9.780.1 | 4.860.04 | 15.40.1 | –0.300.01 | -1.000.01 | -0.800.01 | |
| W31 #3 | 0.1930.002 | 5.440.05 | 1.610.02 | 8.70.1 | ||||
| 2.1 | 0.660.01 | 7.20.1 | 2.00.02 | 10.50.1 | -0.560.01 | -1.200.01 | -1.030.01 | |
| W31 #4 | 0.3650.003 | 7.340.07 | 3.140.04 | 11.60.1 | ||||
| 2.1 | 1.250.01 | 9.660.1 | 3.850.05 | 14.00.1 | -0.400.01 | -1.050.01 | -0.890.01 | |
| W31 #5 | 0.0100.0001 | 5.860.7 | 1.060.01 | 6.800.1 | ||||
| 2.1 | 0.3410.003 | 7.710.08 | 1.300.01 | 8.20.1 | -0.770.01 | -1.380.01 | -1.350.01 | |
| W31 #9 | 0.0620.001 | 7.060.11 | 0.800.01 | 8.00.1 | ||||
| 2.1 | 0.2110.003 | 9.30.1 | 0.990.01 | 9.70.1 | -0.970.01 | -1.660.01 | -1.640.01 | |
| W31 #15 | 0.3010.002 | 8.040.08 | 3.020.03 | 12.80.1 | ||||
| 2.1 | 1.030.01 | 10.60.1 | 3.710.04 | 15.40.1 | -0.460.01 | -1.180.01 | -1.010.01 | |
| W31 #26 | 0.3960.004 | 13.50.1 | 3.920.03 | 15.20.2 | ||||
| 2.1 | 1.360.01 | 17.80.2 | 4.810.04 | 18.30.2 | -0.570.01 | -1.130.01 | -1.120.01 | |
| W31 #30 | 0.2860.002 | 12.40.2 | 3.150.02 | 14.50.1 | ||||
| 2.1 | 0.980.01 | 16.30.2 | 3.870.03 | 17.50.2 | -0.630.01 | -1.250.01 | -1.220.01 | |
| G23.96+0.15 | 0.330.08 | 341 | 2.40.2 | 25.60.4 | ||||
| 2.0 | 1.30.2 | 461 | 3.00.3 | 31.70.5 | -1.190.06 | -1.370.05 | -1.540.05 | |
| G29.960.02 | 4.20.4 | 997 | 27 1 | 461 | ||||
| 1.6 | 10.71 | 1229 | 321 | 531 | -0.580.05 | -0.690.05 | -1.060.06 | |
4 Indirect properties of early-type stars in W31 from IRS spectroscopy
4.1 Mid-IR fine structure line ratios
We present the Spitzer IRS short high medium resolution observations of the naked O stars and massive YSOs in Fig 6. Although these datasets are background subtracted, no allowance for extended nebular emission close to each source is made. Their continua are dominated by warm dust emission, while the solid state Polycyclic Aromatic Hydrocarbon (PAH) features at 11.3m, 13.6m and 16.5m – previously known as Unidentified Infrared (UIR) emission – are also seen (the 16.5m PAH feature is not detected in #2). There is also a tentative detection of 15.2m absorption by icy CO2 mantles on the silicate dust grains (van Dishoeck, 2004). Shallow profiles with a soft blue wing starting near 14.9m are reminiscent of the W33A massive YSO (Gibb et al., 2004), although we have no confirmation of the associated 4.3m CO2 absorption which is strong in massive protostars.

We have measured the observed fluxes of the fine structure lines in all IRS sources, using the ELF routine in DIPSO, which are presented in Table 4. Other, weaker features are observed in the SH module, including Hu (H i 7–6) at 12.37m111At the spectral resolution of IRS/SH the 12.37m feature is actually a blend of H i (7–6) and (11–8) for which (11–8)/(7–6) = 0.123 according to Case B recombination theory at = 7,500 K and 104 cm-3 (Storey & Hummer, 1995)., for which (Hu )/([Ne ii] 12.8m)] = –1.92 0.04. Where appropriate, we include de-reddened line intensities in Table 4, obtained from mean -band extinctions measured previously together with the mid-IR extinction law of Morris et al. (2000), namely
Of the mid-IR diagnostics, the [S iv] line at 10.51 m is significantly affected by the 9.7m silicate feature. The 11.3m PAH emission feature spans a range of equivalent widths, typically = 600300 Å, with the exception of two massive YSOs, #1 ( 2500Å) and #9 ( 2100Å). Weak UIR emission a 12.7m can be seen in these two sources (see Fig. 6).
In addition to the W31 sources, we also present mid-IR fine structure line fluxes for selected UC H ii regions in Table 4. Of these, G23.96+0.15 and G29.96–0.02 lie within the inner Milky Way and possess both mid-IR spectroscopy from Infrared Space Observatory (Peeters et al., 2002) and near-IR spectroscopy of the ionizing star (Hanson et al., 2005; Crowther & Furness, 2008). Interstellar extinction for these were taken from Crowther & Furness (2008) and Martín-Hernández et al. (2002a), respectively.
In Fig. 7 we compare the intensity ratios of [Ne iii]/[Ne ii] and [S iv]/[S iii] for the W31 sources plus selected compact and UC H ii regions. The former lie close to the best fit of observed ratios in H ii regions in the Milky Way and Magellanic Clouds (Martín-Hernández et al., 2002b), based on observations presented by Peeters et al. (2002) and Vermeij et al. (2002). The compact and UC H ii regions are apparent outliers, but Fig. 1 from Martín-Hernández et al. (2002b) reveals a typical scatter of 0.2 dex and they did not correct line ratios for interstellar extinction. Physically, these are probably amongst the highest density (ionization parameter) H ii regions of the full Martín-Hernández et al. (2002b) sample.
The W31 sources with the highest ionization are the naked O stars #2 (O3–4 V) and #4 (O5.50.5 V) with massive YSOs #1 and #9 possessing the lowest ionization nebulae, with a mixture of naked O stars and massive YSOs at intermediate ionization. From these observations, #15, #26 and #30 could be interpreted as possessing similar stellar properties to #3 (O5 V) and #5 (O5.50.5 V) with later subtypes for #1 and #9, although we defer a formal estimate of their temperatures until § 4.2. Despite this overlap, it may be significant that the naked O stars tend towards higher ionization nebulae, i.e. higher temperatures (larger stellar masses).
| Star | Sp. Type | Teff | log | log | log | log | log | |||||
|---|---|---|---|---|---|---|---|---|---|---|---|---|
| kK | kpc | cm-3 | pc | |||||||||
| W31 #2 | O3–4 V | 45 | 3.3 | 49.6 | 6,500 | (0.24) | –1.6 | 1.01 | 0.42 | 0.52 | 1.22 | –0.01 |
| W31 #3 | O5 V | 43 | 3.3 | 49.3 | 6,500 | (0.19) | –1.7 | 0.65 | 0.23 | 0.28 | 0.81 | –0.28 |
| W31 #4 | O5.50.5 V | 41 | 3.3 | 49.0 | 6,500 | (0.15) | –1.8 | 0.24 | 0.01 | 0.05 | 0.39 | –0.52 |
| W31 #5 | O5.50.5 V | 41 | 3.3 | 49.3 | 6,500 | (0.19) | –1.7 | 0.31 | 0.09 | 0.08 | 0.49 | –0.48 |
| G29.96–0.02 | O4–5 V | 41 | 7.4 | 49.6 | 20,000 | 0.13 | –1.5 | 0.95 | 0.60 | 0.49 | 1.06 | 0.00 |
| G23.96+0.15 | O7.5 V | 38 | 4.7 | 49.2 | 70,000 | 0.05 | –1.4 | 0.02 | 0.46 | –0.06 | 0.02 | –0.52 |
4.2 Photoionization Modelling
The primary aim of our study is to compare the direct near-IR stellar signatures of O stars in W31 (and UC H ii regions) with the indirect mid-IR nebular lines through predictions from photoionization models. We use version 08.00 of the photoionization code cloudy, last described by Ferland et al. (1998). This solves the equations of thermal and statistical equilibrium for a model nebula, represented by a sphere of gas with uniform density and filling factor with a small central cavity which is ionized and heated solely by the UV radiation of a single central star.
Nebular fluxes are predicted, given input abundances, ionizing flux distributions and physical parameters, most important of which is the ionization parameter
and is the number of ionizing photons below the H-Lyman edge at 912Å. Here, is the radius of the Strömgren sphere. Alternatively,
where is the Case B recombination coefficient. For a given energy distribution of the ionizing radiation field, any combination of parameters which keeps constant will result in an identical ionization structure of the gas (see Stasińska & Leitherer, 1996).
Morisset et al. (2004) have compared a number of stellar atmosphere codes to mid-IR observations of Milky Way H ii regions, concluding that the non-LTE codes CMFGEN and WM-Basic (Pauldrach et al., 2001) provide the best match to observations (see also Simón-Díaz & Stasińska, 2008). We therefore utilise CMFGEN to provide the ionizing flux distributions, as discussed above.
Ideally, one would employ compact and ultra-compact H ii regions that were both spherical and ionized by a single dominant source for such a study. However, such cases are incredibly rare, due to the lack of accurate subtypes for the ionizing stars and scarcity of space bourne mid-IR observations. G29.96–0.02 satisfies the ideal criteria relatively well, but G23.96+0.15 is irregular (Wood & Churchwell, 1989), and there is ionized gas throughout the W31 cluster. Fortunately, the O stars within W31 are relatively uniform in their ionizing output. In contrast to the ONC, where Ori C dominates the extreme UV radiation field, we assume that the ionized gas within IRS apertures centred upon individual O stars are dominated by these stars. In reality, the diffuse radiation field likely reflects a combination of the ionizing photons from multiple cluster members, a considerations which should be bourne in mind in the following analysis.
4.2.1 Nebular densities
For the stars whose near-IR spectra enables a spectral type to be determined, we can obtain empirical ionization parameters if the distance and electron density is known. Table 5 provides ionizing parameters for the two UC H ii regions whose ionizing stars have been determined from near-IR spectroscopy, G29.96–0.02 and G23.96+0.15, implying in both cases.
Specifically, for G29.96–0.02, Hanson et al. (2005) estimated = 49.6 for a kinematic distance of 7.4 kpc, which together with a radio-derived Strömgren radius of 3.5′′ (0.13 pc Wood & Churchwell, 1989) requires a high electron density of 20,000 cm-3. This is typical of UC H ii regions, but is significantly higher than the density of 817 cm-3 obtained from ISO observations using [O iii] 88/52m by Martín-Hernández et al. (2002a). For G23.96+0.15, we adopt the kinematic distance of 4.7 kpc for which Crowther & Furness (2008) obtained = 49.4 and we adopt a Strömgren radius of 2′′ (0.025 pc) from Wood & Churchwell (1989), although this UC H ii region has an irregular radio morphology. Again, the corresponding electron density of 70,000 cm-3 is much higher than the average density of 1543 cm-3 obtained by Martín-Hernández et al. (2002a), arising in part due to the large aperture of ISO/LWS.
It was our intention that the IRS/LH spectroscopy of W31 would have enabled us to deduce electron densities. Unfortunately, due to severe saturation because of the bright dust continuum this was not possible (§ 2.2). We have therefore combined the radio-derived ionizing flux of = 50.4 from Conti & Crowther (2004) with the 30′′ (0.5 pc) radius of the H ii region from diffuse Br emission (recall Fig. 1) to estimate an electron density of 6,500 cm-3. The ionization parameter implied in all cases is close to = –1.5, albeit slightly lower than for the UC H ii regions, with similar values anticipated for the massive YSOs in W31. For comparison, Baldwin et al. (1991) also derived for the Orion Nebula Cluster (ONC).


4.2.2 Predicted mid-IR fine structure line ratios
Table 5 includes predicted mid-IR fine structure line ratios for each case using cloudy. These were obtained with stellar models for individual stars from either Hanson et al. (2005), Crowther & Furness (2008) or the present study and were calculated with abundances scaled to 1.5 times the Solar value, with dust neglected. From a comparison between the observed line ratios in Table 4 and predicted values in Table 5 it is apparent that agreement is very poor. For example, the [Ne iii] 15.5m/[Ne ii] 12.8m and [S iv] 10.5m/[S iii] 18.7m ratios differs by 1.50.5 dex in all cases. This suggests either that the stellar or photoionization models are at fault, or the problem arises from local background variations close to individual W31 sources. The former would appear to be more plausible, since the latter explanation would not reconcile differences between ISO observations of UC H ii regions and predictions.
Regardless of the origin for the discrepancy, we have calculated a grid of photoionization models for three ionization parameters, = –1, –2 and –3 using stellar atmospheric models appropriate for solar metallicity O dwarfs, as listed in Table 6. These were obtained from the O star calibration from Conti et al. (2008) together with the Vink, de Koter & Lamers (2001) mass-loss prescription. A uniform rotational broadening of 200 km s-1 was applied to synthetic spectra. Dust was not included, but has little effect upon the predicted line intensities with Orion-like dust grain compositions for dust-to-gas mass ratios of 0.1–2%. In the unlikely case of Milky Way ISM dust grains with a dust-to-gas mass ratio of 2%, line intensity ratios may be affected by up to factor of two.
Observed line intensities are intrinsically linked to both ionization parameter, , and stellar temperature, . One means of isolating the form of the radiation field is through the ionization softness parameter = ([O ii]/[O iii])/([S ii]/[S iii]) defined for H ii regions detected optically by Vílchez & Pagel (1988). Analogously, the hardness of mid-IR nebular diagnostics can be characterised by
as discussed by Morisset (2004). Variations in and are broadly independent in a plot of (S–Ne) versus [Ne iii]/[Ne ii]. In Fig. 8 we compare our cloudy predictions for Solar composition nebulae for = –1, –2, –3 to the observed positions of W31 stars and UC H ii regions, together with recent predictions from Simón-Díaz & Stasińska (2008) which are also based on cloudy and CMFGEN models. The W31 sources lie very close together in Fig. 8, with the marginal exception of the massive YSO #9. This source is also an outlier in Fig. 7, possibly as a result of a reduced density (ionization parameter).
G29.96–0.02 lies close to the = (40kK, –2) photoionization model from Simón-Díaz & Stasińska (2008), in reasonable agreement with the empirical properties of (41kK, –1.5) from Table 5. In contrast, our results predict rather poor agreement for G29.96–0.02 since it sits close to the (37kK, –2) photoionization model. The reason for this difference is that Simón-Díaz & Stasińska (2008) adopt a non-standard model dependent definition of ionization parameter, namely
which is based upon the inner radius of the model cloud, for the photoionization calculation rather than the Strömgren radius, . Consequently, the poor agreement for G29.96–0.02 obtained here simply confirms the previous (poor) consistency discussed by Morisset et al. (2002) and Martín-Hernández et al. (2002b). The comparison for G23.96+0.15 fares little better, with ( = (36kK, –2) predicted, in contrast to empirical estimates of (38kK, –1.4) from Table 5. The situation for the W31 O stars is fairly similar, with ionization parameters of –3 predicted in the right panel of Fig. 8, yet –1.7 is more typical of compact and UC H ii regions (Table 5).
In § 3.2, we indicated that W31 is anticipated to be metal-rich with respect to the Solar neighbourhood. Similar arguments apply for G23.96+0.15 and especially G29.96–0.02. For a kinematic distance of 7 kpc to G29.96–0.02, this UC H ii region would lie at = 4 kpc from the Galactic Centre222Sewilo et al. (2004) obtained a distance of 8.9 kpc or = 4.5 kpc to G29.96–0.02., versus 3.7 kpc for G23.96+0.15 for a kinematic distance of 4.7 kpc.
Therefore, we have also calculated a set of super-solar (2 ) cloudy models, based upon O star models that are identical to the solar composition grid except that both metal abundances and mass-loss rates are increased (see Table 6 for the latter). Solely early O stars provide significant numbers of extreme UV photons capable of producing [Ne iii] and [S iv] nebular emission while [Ne ii] and [S iii] emission is expected to cease beyond O9.5V.
Predictions from photoionization models are presented in Fig. 9. In general, from a comparison with the Solar models, these yield slightly higher stellar temperatures and ionization parameters. G29.96–0.02 lies close to = (38kK, –2), representing a slight improvement with respect to the empirical temperature. Similar comments apply for G23.96+0.15, although predicted temperatures remain too low, and ionization parameters are offset by –1.0 to –1.5 dex for G23.96+0.15 and the O stars in W31.

| Subtype | Teff | |||||
|---|---|---|---|---|---|---|
| kK | km s-1 | yr-1 | ||||
| O3 V | 45 | 5.88 | 74 | 49.65 | 3200 | –5.41 (–5.15) |
| O4 V | 43 | 5.77 | 64 | 49.5 | 3000 | –5.55 (–5.30) |
| O5 V | 41 | 5.57 | 51 | 49.25 | 2900 | –5.86 (–5.61) |
| O6 V | 39 | 5.39 | 41 | 49.0 | 2600 | –6.12 (–5.86) |
| O7 V | 37 | 5.25 | 36 | 48.8 | 2300 | –6.33 (–6.07) |
| O8 V | 35 | 5.10 | 31 | 48.55 | 1750 | –6.49 (–6.23) |
| O9 V | 33 | 4.91 | 25 | 48.2 | 1500 | –6.79 (–6.53) |
| O9.5 V | 31.5 | 4.78 | 23 | 48.0 | 1200 | –6.97 (–6.72) |

| Source | IRAS | Alias | Ref | Sp Type | Sp Type | ||||||||
|---|---|---|---|---|---|---|---|---|---|---|---|---|---|
| km s-1 | kpc | kpc | mag | kK | kK | ||||||||
| G1.13–0.11 | 17455–2800 | Sgr D | –17.1 | 8.0 | 0.2 | a | 1.8 | –0.36 | 43 | O4 V | –0.69 | 43 | O4 V |
| W31 #1 | 3.3 | 4.8 | k | 2.1 | –0.94 | 39.5 | O6 V | –1.46 | 39 | O6 V | |||
| W31 #9 | 3.3 | 4.8 | k | 2.1 | –0.97 | 39.5 | O6 V | –1.64 | 38 | O6.5 V | |||
| W31 #15 | 3.3 | 4.8 | k | 2.1 | –0.46 | 42.5 | O4 V | –1.01 | 41.5 | O5 V | |||
| W31 #26 | 3.3 | 4.8 | k | 2.1 | –0.57 | 42 | O4–5 V | –1.12 | 41 | O5 V | |||
| W31 #30 | 3.3 | 4.8 | k | 2.1 | –0.63 | 41.5 | O5 V | –1.22 | 40 | O5.5 V | |||
| G33.91+0.11 | 18502+0051 | –100.0 | 6.6 | 4.5 | b, c | 1.6∗ | –0.66 | 42 | O4–5 V | –1.18 | 41 | O5 V | |
| G49.20–0.35 | 19207+1410 | –67.9 | 5.2 | 6.1 | d | 1.6∗ | +0.03 | 45 | O3 V | –0.23 | 45 | O3 V | |
| G301.11+0.97 | 12331–6134 | –40.8 | 4.1 | 6.8 | h | 1.6∗ | –0.16 | 44 | O3–4 V | –0.38 | 44 | O3–4 V | |
| G326.44+0.91 | 15384–5348 | –41.0 | 2.5 | 6.1 | h | 1.3 | –0.55 | 42 | O4–5 V | –0.86 | 42 | O4–5 V | |
| G328.31+0.43 | 15502–5302 | –91.7 | 5.4 | 4.4 | h | 2.7 | –0.63 | 42 | O4–5 V | –1.18 | 41 | O5 V | |
| G332.15–0.45 | 16128–5109 | –55.7 | 3.5 | 5.2 | h | 1.6∗ | –0.26 | 43.5 | O4 V | –0.66 | 43 | O4 V | |
| G351.46–0.44 | 17221–3619 | –22.3 | 3.3 | 4.8 | h | 1.8 | –1.41 | 39 | O6 V | –1.54 | 40 | O5.5 V |
4.3 [Ne iii]/[Ne ii] calibrations
Let us now focus upon the predicted [Ne iii]/[Ne ii] ratio versus stellar temperature, which is presented in Fig 10 for the Solar and 2 metallicity grids at . We have selected this value for the ionization parameter since this is characteristic of compact and especially UC H ii regions in our sample. Empirical results are also shown, with stellar temperatures drawn from Table 5, quantifying earlier discrepancies with respect to the predictions. An explanation for the disagreement is not readily apparent, although it may involve incomplete line blanketing in current non-plane parallel model atmospheres at high energies. Nevertheless, observations allow us to estimate the temperatures of the ionizing O stars in other dense H ii regions (for which ) within the inner Milky Way, to within 2 kK (i.e. one spectral subtype) in principle. A first order fit to the empirical datasets using IDL’s polyfit routine reveals
O subtypes may then be estimated from the recent calibration of Martins, Schaerer & Hillier (2005). Of course, this approach is only practical for compact and UC H ii regions ionized by early- and mid- O stars, in view of the weakness of [Ne iii] 15.5m for late O-types.
To illustrate its potential diagnostic role, in Table 7 we provide stellar temperatures derived from extinction corrected [Ne iii]/[Ne ii] ratios for compact and ultra-compact H ii regions from ISO/SWS observations (Peeters et al., 2002), plus the massive YSO’s in W31 from the present study. Extinctions are either taken from Martín-Hernández et al. (2002a), or = 1.6 mag is adopted otherwise. We omit the peculiar compact H ii region G93.53+1.47 (M1–78) from this sample (Martín-Hernández et al., 2008). For the massive YSO’s in W31, Table 7 presents spectral types inferred from the mean interstellar extinction obtained from the naked W31 O stars. In reality, higher extinctions may be expected for these cases (recall § 3.3). Fortunately, the use of a higher extinction does not affect the resulting stellar temperatures/subtypes. For #26, a subtype of O4–5V is obtained, versus an approximate subtype of O6V from its H-band ISAAC spectrum (§ 3.3).
Since our calibration has been established using solely compact H ii regions within the inner Milky Way - with super-solar elemental abundances – one should consider separately the case of H ii regions close to, or exterior to, the Solar circle. Of course, metal content is very relevant to gas cooling and metal-line blanketing of the extreme UV energy distributions of O stars. Unfortunately, among the compact H ii regions close to the Solar circle, very few possess both mid-IR spectroscopy and well determined properties for the dominant ionizing star. The ONC – for which Ori C (HD 37022, O6-7 Vp) is the dominant source of ionizing radiation – is one such case in that it possesses both mid-infrared spectroscopy Simpson et al. (1998) and a contemporary analysis of its stellar content by Simón-Díaz et al. (2006).
Other examples are generally complicated by the presence of multiple ionizing stars of uncertain spectral type (e.g. NGC 7538) or mid-IR spectroscopy is lacking. The only other case for which mid-IR spectroscopy is available together with a well determined spectral type of the ionizing star is G110.10+0.05 (IC 1470, Sh 2–156) for which Hunter & Massey (1990) derived O6.5 V for its ionizing star. Therefore, we refrain from attempting a solar metallicity calibration at this time. However, we are able to compare the ONC with the cloudy predictions, recalling that Baldwin et al. (1991) derived a value of = –1.48 for the ONC. In contrast to the metal-rich H,ii regions, the observed neon ratio for the ONC is in better agreement with the solar-metallicity predictions for = 391 kK for Ori C (Simón-Díaz et al., 2006).
4.4 [S iv]/[Ne ii] and [Ar iii]/[Ne ii] calibrations
Of course, neither (S–Ne) nor [Ne iii]/[Ne ii] are available from ground-based observations. In such cases, only [Ar iii] 8.9m, [S iv] 10.5m and [Ne ii] 12.8m are accessible. In Figure 11 we compare the [S iv]/[Ne ii] ratio versus stellar temperature for sources in W31, G29.96–0.02 and G23.96+0.15, plus cloudy predictions for 2Solar stellar models.

The comparison between the predicted [S iv]/[Ne ii] ratio and empirical results is much poorer than for the [Ne iii]/[Ne ii] ratio. As such, one might conclude that no straightforward means of determining temperatures exists from ground-based data alone. However, it has been established that there is a reasonably tight correlation between the [S iv]/[Ne ii] and [Ne iii]/[Ne ii] ratios, as shown by Groves, Nefs & Brandl (2008). For the sample of Milky Way compact H ii regions observed by Peeters et al. (2002) we obtain a linear, least-squares fit
after correcting line fluxes for extinction (as discussed above). This is presented in Fig. 12. For comparison, Groves et al. (2008) obtained coefficients 0.74 and 0.42 for 65 Galactic H ii regions from Giveon et al. (2002), neglecting interstellar extinction.

We use this conversion to apply our empirical [Ne iii]/[Ne ii] temperature calibration to [S iv]/[Ne ii]. This is also presented in Fig. 11, from which similar consistency with empirical results to that achieved for [Ne iii]/[Ne ii] is obtained, revealing
for the super-solar case. Again, we include the predicted subtypes of Galactic compact H ii regions from our empirical [S iv]/[Ne ii] calibrations in Table 7. Since [S iv] is relatively sensitive to extinction, if we were to use extinctions inferred from their H–K colours (e.g. = 4.9 mag for W31 #26) rather than the average of the naked O stars, we would obtain temperatures up to 3kK higher. It is likely that their actual extinctions lie between these two extremes due to the contribution of hot circumstellar dust.

In principle, either the [Ne iii]/[Ne ii] or [S iv]/[Ne ii] calibration may be applied to H ii regions ionized by early or mid-type O stars, since late-type O stars possess too low photon fluxes at the energies required to produce either Ne2+ ( 41eV) or S3+ ( 35eV). Therefore, we have also considered the potential role of [Ar iii] 9.0m from the two UC H ii regions (this line was not covered by IRS/SH datasets). For the Peeters et al. (2002) sample of H ii regions as discussed above, we obtained [Ar iii] line intensities using an extinction correction of
and obtained a similar quality fit to that of I[S iv]/I[Ne ii] above (see Fig. 12), namely
allowing estimates of temperatures to be made from the [Ar iii]/[Ne ii] ratio. Unfortunately, this is relatively insensitive to temperature and so should only be considered if neither of the primary calibrations are available. Nevertheless, the comparison between empirical results for G23.96+0.15 and G29.96–0.02 and our metal-rich calibration, presented in Fig. 13, is reasonable. For completeness, the super-solar calibration may be expressed as:
It should be re-emphasised that these calibrations are solely intended for compact and ultra-compact H ii regions for the inner Milky Way, and are liable to revision once additional empirical results become available. Nevertheless, it is apparent that the use of any mid-IR nebular diagnostics to establish properties of metal-rich O stars will lead to stellar temperatures that are too low, by as much as 5 kK or 10%.
5 Discussion
5.1 Massive Star Content of W31
Let us now return to W31 itself, and specifically its massive star content. From Fig. 7, the highest ionization stars are naked O stars including the highest mass star in W31 #2, while the lowest ionization stars (#1, #9) are massive YSOs with presumably the lowest masses.
Ideally, one would like to comment upon differences in timescales over which circumstellar material is destroyed by young O stars of different masses, but the range of masses exhibited by our sample is likely to be relatively modest (with the exception of #2) and the unusual geometry of W31 suggests that massive star formation across this cluster was not necessarily coeval. The only naked O star from Fig. 4 suggesting an age spread is #5. However, as discussed in § 3.2 it is plausible that #5 is a close binary with similar mass components from which a uniform cluster age would be obtained.
For the case of a genuinely coeval cluster, it is likely that stars with the highest luminosities – and hardest extreme UV photon fluxes – destroy circumstellar dust more rapidly than lower luminosity, softer extreme UV stars, which are conceivably the massive YSOs. From Table 7 stellar subtypes of O4–6V are obtained from our [Ne iii]/[Ne ii] calibration (Table 7), i.e. comparable to the naked O stars.
W31 #26, in particular, appears to be in the process of actively clearing its circumstellar dust, revealing photospheric absorption lines, consistent with a subtype of O6V, slightly later than the indirect calibration. #15 and #30, on the basis of similar neon ratios to #26 its mid-IR neon lines likely possess similar subtypes, with O6–6.5 subtypes for #1 and #9. The lowest (current) mass estimated amongst the naked O stars is for the O5.5V star #4 (Table 3). Consequently, it is likely that the massive YSO’s possess stellar masses of order 30–35 . Recall also that W31 also hosts a number of UC H ii regions (Ghosh et al., 1989). Such sources are still too deeply embedded to be detected at near–IR wavelengths, most likely as a result of still lower luminosities/masses (late O subtypes?). If the UC H ii regions are genuinely coeval with the naked O stars and massive YSO’s in W31, a timescale in excess of 0.5 Myr is required for late O stars to sufficiently clear their environment to be detected at near-IR wavelengths.
5.2 Analysis of embedded stellar populations from mid-IR fine structure lines.
Our study has focused upon compact and ultra-compact H ii regions within the inner Milky Way. We find that all mid-IR nebular diagnostics will lead to stellar temperatures that are too low, by as much as 5 kK or 10%. However, mid-IR fine structure lines also have application in external galaxies, ranging from metal-rich H ii regions in spiral galaxies (Rubin et al., 2007), starbursts (Thornley et al., 2000; Verma et al., 2003; Brandl et al., 2006) and ultraluminous infrared galaxies (ULIRGs Lutz et al., 1998).
Within this diverse sample, the mid-IR has the greatest diagnostic role for the highly obscured cases, either young, embedded massive clusters within metal-poor starbursts such as NGC 5253 (Crowther et al., 1999), He 2–10 (Vacca et al., 2002), or metal-rich ULIRG’s (Genzel et al., 1998).
Of course, the aim of studies of starbursts is generally to obtain ages and/or stellar content (mass, Initial Mass Function) yet similar approaches to the present study are usually followed, involving photoionization models and ionizing flux distributions from stellar atmosphere models coupled to evolutionary predictions through population synthesis codes (e.g. Pindao et al., 2002).
Problems highlighted here and elsewhere (Morisset et al., 2002; Martín-Hernández et al., 2002a; Martín-Hernández et al., 2002b) for H ii regions in the inner Milky Way probably have their origins in both (i) incomplete opacities from all relevant ions in stellar atmosphere models allowing for non-LTE effects and stellar winds; (ii) 1D photoionization models. In principle, the second of these can be tested against 3D photoionization codes such as MOCASSIN (Ercolano, Barlow & Storey, 2005). Until then, similar empirical calibrations of photoionization models across a range of metallicities may be the best approach. It may be significant that the discrepancy for the Orion Nebula Cluster is significantly less severe than for G29.96–0.02 and G23.96+0.15. A further test would be for an extensive sample of H ii regions in the outer Milky Way and the Magellanic Cloud, These could potentially include 30 Doradus (LMC) and/or NGC 346 (SMC). Beyond the Magellanic Clouds, spatial resolution prevents spectroscopy of individual stars within compact star clusters.
6 Summary
We present near-IR (VLT/ISAAC) and mid-IR (Spitzer/IRS) spectroscopy of massive stars within the young Milky Way cluster G10.2–0.3 (W31). Our main results may be summarised as follows:
-
1.
- and -band spectroscopy of naked O stars broadly confirms subtypes from Blum et al. (2001) from which a refined cluster distance (3.3 kpc) and age (0.6 Myr) are obtained.
-
2.
W31 #26, one of the massive YSOs from Blum et al. (2001) is shown to possess photospheric features, consistent with a subtype of O6V, in addition to near-IR circumstellar dust emission. This suggests it is in the very process of clearing its immediate environment.
-
3.
Mid-IR fine-structure line ratios of W31 stars overlap with other Milky Way and Magellanic Cloud H ii regions on a [Ne iii]/[Ne ii] to [S iv]/[S iii] diagram.
-
4.
Following Morisset et al. (2004), a comparison of the mid-IR radiation hardness parameter, (S-Ne) = ([Ne iii]/[Ne ii])/([S iv]/[S iii] versus [Ne iii]/[Ne ii] allows dependencies upon effective temperature and ionization parameter, to be tested. Predicted solar metallicity (stellar and nebular) models differ greatly from empirical and , with small improvements in both for 2 solar grids.
-
5.
Similar studies are planned for metal-poor environments, which should establish whether the problem is most severe at high metallicity. Initial results for the ONC do show an improved agreement between predictions and observations, although larger samples are required for statistically robust results. If the discrepancy were to disappear at lower metallicities it would suggest that either the extreme UV metal line blanketing of early-types stars is incomplete, or there is a problem with photoionization models at high metallicity.
-
6.
We show that an empirical correction to the predicted [Ne iii]/[Ne ii] ratio against for =–1.5 and 2 provides a reasonable match to stellar results for W31 and two inner Milky Way UC H ii regions. Estimates of the O subtypes of the ionizing stars in other inner Galactic H ii regions ( 7 kpc) are obtained. This approach is only practical for early- and mid- O stars, in view of the weakness of [Ne iii] 15.5m for late O-types.
-
7.
For ground-based datasets lacking [Ne iii] observations, we have used a correlation between [Ne iii]/[Ne ii] and [S iv]/[Ne ii] – see also Groves et al. (2008) – to provide a calibration of [S iv]/[Ne ii] against for super-solar compact H ii regions. Since only early- and mid- O stars provide significant [S iv] emission, we have also obtained a similar relation for 9.0m [Ar iii]/12.8m [Ne ii] versus , although this should only be applied when other diagnostics are unavailable, with both [Ar iii] and [Ne ii] expected to be weak in late-type O stars.
Finally, in view of the apparent discrepancy between stellar and nebular results at high metallicity compact H ii regions, studies of more straightforward templates are sought, to enable the present calibration to be put on a more robust footing.
Acknowledgements
JPF would like to acknowledge financial support from STFC, CLB acknowledges financial support from FAPESP and PSC thanks the NSF for continuous support. We wish to thank John Hillier and Gary Ferland for maintaining CMFGEN and CLOUDY. Specific support for this work was partly provided by NASA through an award issued by JPL/Caltech. We appreciate many useful suggestions from an anonymous referee.
References
- Afflerbach et al. (1996) Afflerbach A., Churchwell E., Acord J. M., Hofner P., Kurtz S., Depree C. G., 1996, ApJS, 106, 423
- Allison et al. (2009) Allison R. J., Goodwin S. P., Parker R. J., Portegies Zwart S. F., de Grijs R., Kouwenhoven M. B. N., 2009, MNRAS, 395, 1449
- Araya et al. (2002) Araya E., Hofner P., Churchwell E., Kurtz S., 2002, ApJS, 138, 63
- Asplund et al. (2004) Asplund M., Grevesse N., Sauval A. J., Allende Prieto C., Kiselman D., 2004, A&A, 417, 751
- Baldwin et al. (1991) Baldwin J. A., Ferland G. J., Martin P. G., Corbin M. R., Cota S. A., Peterson B. M., Slettebak A., 1991, ApJ, 374, 580
- Barbosa et al. (2008) Barbosa C. L., Blum R. D., Conti P. S., Damineli A., Figuerêdo E., 2008, ApJ, 678, L55
- Blum et al. (2001) Blum R. D., Damineli A., Conti P. S., 2001, AJ, 121, 3149
- Blum & McGregor (2008) Blum R. D., McGregor P. J., 2008, AJ, 135, 1708
- Blum & McGregor (2009) Blum R. D., McGregor P. J., 2009, AJ, 138, 489
- Brandl et al. (2006) Brandl B. R., Bernard-Salas J., Spoon H. W. W., et al. 2006, ApJ, 653, 1129
- Bronfman et al. (1996) Bronfman L., Nyman L.-A., May J., 1996, A&AS, 115, 81
- Caswell & Haynes (1987) Caswell J. L., Haynes R. F., 1987, A&A, 171, 261
- Churchwell (2002) Churchwell E., 2002, ARA&A, 40, 27
- Clarke & Bonnell (2008) Clarke C. J., Bonnell I. A., 2008, MNRAS, 388, 1171
- Conti & Crowther (2004) Conti P. S., Crowther P. A., 2004, MNRAS, 355, 899
- Conti et al. (2008) Conti P. S., Crowther P. A., Leitherer C., 2008, From Luminous Hot Stars to Starburst Galaxies. Cambridge Astrophysics Series Vol. 45, Cambridge University Press
- Cox (2000) Cox A. N., 2000, Allen’s Astrophysical Quantities, 4th ed.. Springer
- Crowther et al. (1999) Crowther P. A., Beck S. C., Willis A. J., Conti P. S., Morris P. W., Sutherland R. S., 1999, MNRAS, 304, 654
- Crowther & Furness (2008) Crowther P. A., Furness J. P., 2008, A&A, 492, 111
- de Grijs et al. (2002) de Grijs R., Gilmore G. F., Johnson R. A., Mackey A. D., 2002, MNRAS, 331, 245
- Ercolano et al. (2005) Ercolano B., Barlow M. J., Storey P. J., 2005, MNRAS, 362, 1038
- Esteban et al. (2005) Esteban C., García-Rojas J., Peimbert M., Peimbert A., Ruiz M. T., Rodríguez M., Carigi L., 2005, ApJ, 618, L95
- Fazio et al. (2004) Fazio G. G., Hora J. L., Allen L. E., et al. 2004, ApJS, 154, 10
- Ferland et al. (1998) Ferland G. J., Korista K. T., Verner D. A., Ferguson J. W., Kingdon J. B., Verner E. M., 1998, PASP, 110, 761
- Fish et al. (2003) Fish V. L., Reid M. J., Wilner D. J., Churchwell E., 2003, ApJ, 587, 701
- Genzel et al. (1998) Genzel R., Lutz D., Sturm E., et al. 1998, ApJ, 498, 579
- Ghosh et al. (1989) Ghosh S. K., Iyengar K. V. K., Rengarajan T. N., Tandon S. N., Verma R. P., Daniel R. R., 1989, ApJ, 347, 338
- Gibb et al. (2004) Gibb E. L., Whittet D. C. B., Boogert A. C. A., Tielens A. G. G. M., 2004, ApJS, 151, 35
- Giveon et al. (2002) Giveon U., Sternberg A., Lutz D., Feuchtgruber H., Pauldrach A. W. A., 2002, ApJ, 566, 880
- Groves et al. (2008) Groves B., Nefs B., Brandl B., 2008, MNRAS, 391, L113
- Hanson et al. (2005) Hanson M. M., Kudritzki R.-P., Kenworthy M. A., Puls J., Tokunaga A. T., 2005, ApJS, 161, 154
- Hanson et al. (2002) Hanson M. M., Luhman K. L., Rieke G. H., 2002, ApJS, 138, 35
- Hanson et al. (2005) Hanson M. M., Puls J., Repolust T., 2005, in Cesaroni R., Felli M., Churchwell E., Walmsley M., eds, IAU Symposium 227, p. 376
- Hillier et al. (2003) Hillier D. J., Lanz T., Heap S. R., Hubeny I., Smith L. J., Evans C. J., Lennon D. J., Bouret J. C., 2003, ApJ, 588, 1039
- Hillier & Miller (1998) Hillier D. J., Miller D. L., 1998, ApJ, 496, 407
- Houck et al. (2004) Houck J. R., Roellig T. L., van Cleve J., et al. 2004, ApJS, 154, 18
- Hunter & Massey (1990) Hunter D. A., Massey P., 1990, AJ, 99, 846
- Indebetouw et al. (2005) Indebetouw R., Mathis J. S., Babler B. L., Meade M. R., Watson C., Whitney B. A., Wolff M. J., Wolfire M. G., 2005, ApJ, 619, 931
- Kessler et al. (1996) Kessler M. F., Steinz J. A., Anderegg M. E., et al. 1996, A&A, 315, L27
- Kurtz et al. (1994) Kurtz S., Churchwell E., Wood D. O. S., 1994, ApJS, 91, 659
- Lanz & Hubeny (2003) Lanz T., Hubeny I., 2003, ApJS, 146, 417
- Lejeune & Schaerer (2001) Lejeune T., Schaerer D., 2001, A&A, 366, 538
- Lumsden et al. (2003) Lumsden S. L., Puxley P. J., Hoare M. G., Moore T. J. T., Ridge N. A., 2003, MNRAS, 340, 799
- Lutz et al. (1996) Lutz D., Genzel R., Sternberg A., et al. 1996, A&A, 315, L137
- Lutz et al. (1998) Lutz D., Spoon H. W. W., Rigopoulou D., Moorwood A. F. M., Genzel R., 1998, ApJ, 505, L103
- Maciel & Dutra (1992) Maciel W. J., Dutra C. M., 1992, A&A, 262, 271
- Martín-Hernández et al. (2008) Martín-Hernández N. L., Esteban C., Mesa-Delgado A., Bik A., Puga E., 2008, A&A, 482, 215
- Martín-Hernández et al. (2002a) Martín-Hernández N. L., Peeters E., Morisset C., Tielens A. G. G. M., Cox P., Roelfsema P. R., Baluteau J.-P., 2002a, A&A, 381, 606
- Martín-Hernández et al. (2002b) Martín-Hernández N. L., Vermeij R., Tielens A. G. G. M., van der Hulst J. M., Peeters E., 2002b, A&A, 389, 286
- Martins & Plez (2006) Martins F., Plez B., 2006, A&A, 457, 637
- Martins et al. (2005) Martins F., Schaerer D., Hillier D. J., 2005, A&A, 436, 1049
- Mehringer et al. (1998) Mehringer D. M., Goss W. M., Lis D. C., Palmer P., Menten K. M., 1998, ApJ, 493, 274
- Meynet et al. (1994) Meynet G., Maeder A., Schaller G., Schaerer D., Charbonnel C., 1994, A&AS, 103, 97
- Moorwood & Cuby (1998) Moorwood A., Cuby J.-G., 1998, The Messenger, 94, 7
- Morisset et al. (2004) Morisset C., Schaerer D., Bouret J.-C., Martin s F., 2004, A&A, 415, 577
- Morisset et al. (2002) Morisset C., Schaerer D., Martín-Hernández N. L., Peeters E., Damour F., Baluteau J.-P., Cox P., Roelfsema P., 2002, A&A, 386, 558
- Morris et al. (2000) Morris P. W., van der Hucht K. A., Crowther P. A., Hillier D. J., Dessart L., Williams P. M., Willis A. J., 2000, A&A, 353, 624
- Okamoto et al. (2003) Okamoto Y. K., Kataza H., Yamashita T., Miyata T., Sako S., Takubo S., Honda M., Onaka T., 2003, ApJ, 584, 368
- Pauldrach et al. (2001) Pauldrach A. W. A., Hoffman T. L., Lennon M., 2001, A&A, 375, 161
- Peeters et al. (2002) Peeters E., Martín-Hernández N. L., Damour F., et al. 2002, A&A, 381, 571
- Pérez-Montero & Vílchez (2009) Pérez-Montero E., Vílchez J. M., 2009, MNRAS, 400, 1721
- Pindao et al. (2002) Pindao M., Schaerer D., González Delgado R. M., Stasińska G., 2002, A&A, 394, 443
- Quireza et al. (2006) Quireza C., Rood R. T., Balser D. S., Bania T. M., 2006, ApJS, 165, 338
- Reid (1993) Reid M. J., 1993, ARA&A, 31, 345
- Rigby & Rieke (2004) Rigby J. R., Rieke G. H., 2004, ApJ, 606, 237
- Rubin et al. (2007) Rubin R. H., Simpson J. P., Colgan S. W. J., et al. 2007, MNRAS, 377, 1407
- Sellmaier et al. (1996) Sellmaier F. H., Yamamoto T., Pauldrach A. W. A., Rubin R. H., 1996, A&A, 305, L37
- Sewilo et al. (2004) Sewilo M., Watson C., Araya E., Churchwell E., Hofner P., Kurtz S., 2004, ApJS, 154, 553
- Simón-Díaz et al. (2006) Simón-Díaz S., Herrero A., Esteban C., Najarro F., 2006, A&A, 448, 351
- Simón-Díaz & Stasińska (2008) Simón-Díaz S., Stasińska G., 2008, MNRAS, 389, 1009
- Simpson et al. (1998) Simpson J. P., Witteborn F. C., Price S. D., Cohen M., 1998, ApJ, 508, 268
- Stasińska & Leitherer (1996) Stasińska G., Leitherer C., 1996, ApJS, 107, 661
- Storey & Hummer (1995) Storey P. J., Hummer D. G., 1995, MNRAS, 272, 41
- Thornley et al. (2000) Thornley M. D., Schreiber N. M. F., Lutz D., Genzel R., Spoon H. W. W., Kunze D., Sternberg A., 2000, ApJ, 539, 641
- Vacca et al. (2002) Vacca W. D., Johnson K. E., Conti P. S., 2002, AJ, 123, 772
- van Dishoeck (2004) van Dishoeck E. F., 2004, ARA&A, 42, 119
- Verma et al. (2003) Verma A., Lutz D., Sturm E., Sternberg A., Genzel R., Vacca W., 2003, A&A, 403, 829
- Vermeij et al. (2002) Vermeij R., Damour F., van der Hulst J. M., Baluteau J.-P., 2002, A&A, 390, 649
- Vílchez & Pagel (1988) Vílchez J. M., Pagel B. E. J., 1988, MNRAS, 231, 257
- Vink et al. (2001) Vink J. S., de Koter A., Lamers H. J. G. L. M., 2001, A&A, 369, 574
- Watson & Hanson (1997) Watson A. M., Hanson M. M., 1997, ApJ, 490, 165
- Werner et al. (2004) Werner M. W., Roellig T. L., Low F. J., et al. 2004, ApJS, 154, 1
- Wood & Churchwell (1989) Wood D. O. S., Churchwell E., 1989, ApJS, 69, 831
- Zhu et al. (2008) Zhu Q.-F., Lacy J. H., Jaffe D. T., Richter M. J., Greathouse T. K., 2008, ApJS, 177, 584
- Zinnecker & Yorke (2007) Zinnecker H., Yorke H. W., 2007, ARA&A, 45, 481