Measurements of Ice Crystal Growth Rates in Air at -5C and -10C
K. G. Libbrecht and H. M. Arnold
Department of Physics, California Institute of Technology
Pasadena, California 91125
address correspondence to: kgl@caltech.edu
Abstract. We present experiments investigating the growth of ice crystals from water vapor in air using a free-fall convection chamber. We measured growth rates at temperatures of -5 C and -10 C as a function of supersaturation at an air pressure near one bar. We compared our data with numerical models of diffusion-limited growth based on cellular automata to extract surface growth parameters at different temperatures and supersaturations. From these investigations we hope to better understand the surface molecular dynamics that determine crystal growth rates and morphologies.
[The figures in this paper have been reduced in size to facilitate rapid downloading. The paper is available with higher quality figures at http://www.its.caltech.edu/~atomic/publist/kglpub.htm, or by contacting the author.]
1 Introduction
The formation of complex structures during solidification often results from a subtle interplay of nonequilibrium, nonlinear processes, for which seemingly small changes in molecular dynamics at the nanoscale can produce large morphological changes at all scales. One popular example of this phenomenon is the formation of snow crystals, which are ice crystals that grow from water vapor in a background gas. Although this is a relatively simple physical system, snow crystals display a remarkable variety of columnar and plate-like forms, and much of the phenomenology of their growth remains poorly understood [1].
Recent experimental and theoretical work suggests that surface impurities may play an essential role in determining snow crystal growth rates and morphologies under normal atmospheric conditions [2]. To investigate this further we need precision measurements of snow crystal growth dynamics over a range of conditions, especially as a function of the type and concentration of active impurities within an inert background gas. We have constructed a free-fall convection chamber for making such measurements [3], and we recently described ice growth data obtained over a range of temperatures using this chamber [4]. The present paper describes additional experiments using the same apparatus, in which we measured growth rates as a function of supersaturation at -5 C and -10 C.
2 Observations and Modeling
Our experiments were performed in a convection-mixed ice crystal growth chamber containing ordinary air at atmospheric pressure [3]. We used a heated reservoir filled with deionized water inside the chamber to produce a known water vapor supersaturation via evaporation and convective mixing. A number of crystals were nucleated and allowed to grow for several minutes while in free-fall inside the chamber. At various times we briefly opened a shutter that allowed crystals to fall onto a glass substrate at the bottom of the chamber, where we measured their size and thickness using a combination of optical imaging and broad-band interferometry [3]. From observations of a large number of crystals we obtained the average crystal dimensions as a function of growth time under conditions of known temperature and supersaturation, as well as some sense of the distribution of these quantities. Because of outgassing from the chamber walls and other sources, we expect that the background air in our chamber included a number of unknown impurities at the part-per-million level. We now suspect that these impurities may have a substantial effect on the ice growth dynamics [2], and we will be investigating this hypothesis further in future experiments.
2.1 Measurements at -5C
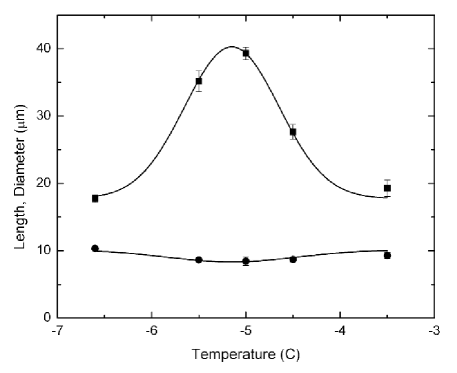
Our first data were taken near the needle peak in the snow crystal morphology diagram [1]. To accurately locate the position of this peak as a function of temperature, we examined crystals grown for 120-180 seconds at different temperatures in air with a supersaturation of percent. The crystal dimensions were approximately proportional to growth time in these measurements, so we fit the data to determine average crystal dimensions after 120 seconds of growth. Results are shown in Figure 1, and a fit to the column length data yields a peak at C.
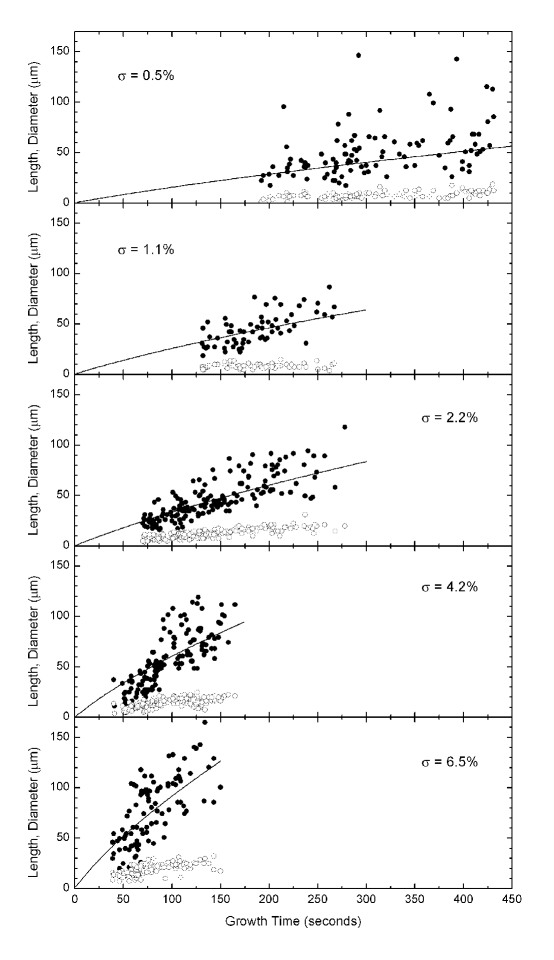
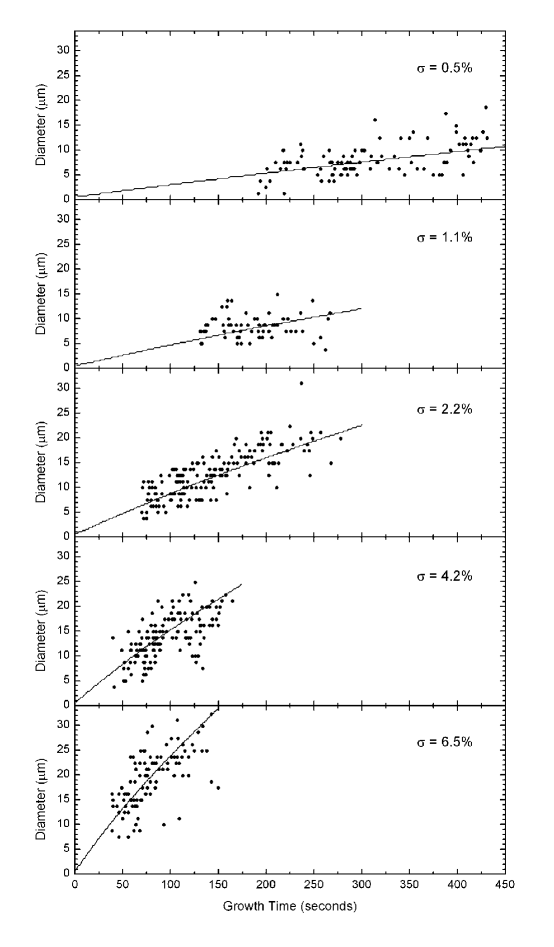
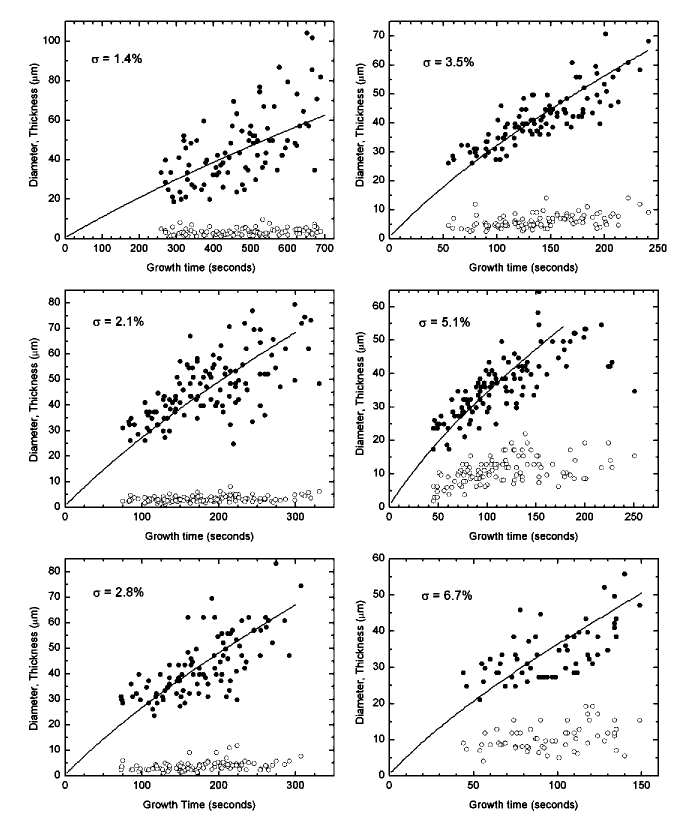
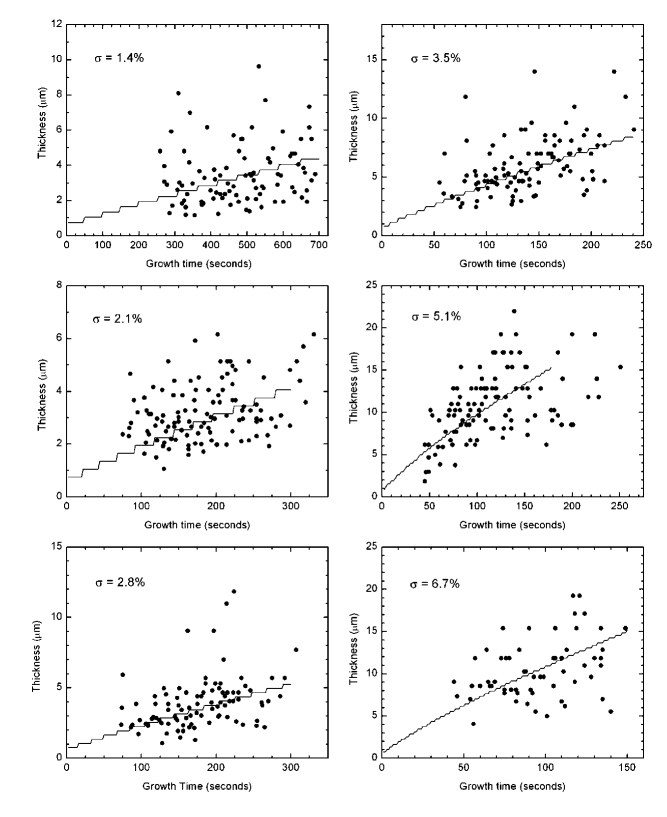
We also observed crystals growing at C at different supersaturations. Once the growth chamber had stabilized, these data were taken by: 1) nucleating crystals near the top of the chamber as described in [3]; 2) waiting some length of time with the shutter closed (so crystals could not fall on the substrate); 3) opening the shutter; and 4) visually scanning the substrate and recording crystals for about 30 seconds. A typical cycle yielded about 5-10 crystal measurements. Using different wait times before opening the shutter, we were able to obtain crystal sizes as a function of growth time (equal to time after nucleation). Results are shown in Figures 2 and 3.
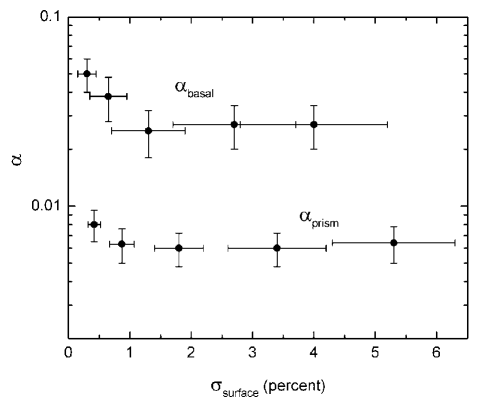
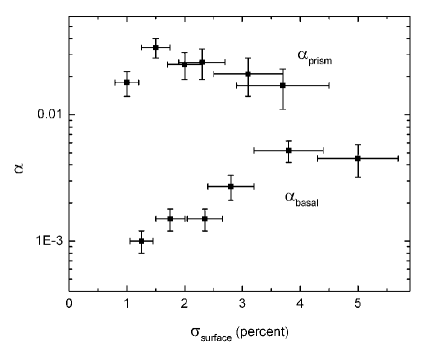
We compared our measurements to cylindrically symmetric numerical models of diffusion-limited growth using a cellular automata method [5, 4]. Input to the models included the attachment coefficients and for the two crystal facets, and these parameters were adjusted to fit the data. The initial crystal size in all cases was 1 m. From the best-fit models we extracted the supersaturation at the crystal surface, as a function of time and location on the surface. For each model we estimated an average value of and the variation in that value, and we interpreted the latter as an estimate of uncertainty in the inferred Figure 4 shows results from this modeling of the data.
2.2 Measurements at -10C
We obtained a second series of measurements at C, following the same procedures described above for the -5 C measurements, and the raw data are shown in Figures 5 and 6. Here we define the effective diameter of a plate-like crystal as , where is the projected basal area of the plate. Most crystals in these data were simple hexagonal plates. Numerical modeling again yielded the attachment coefficients and as a function of at C, shown in Figure 7.
3 Possible Systematic Errors
There are a host of experimental and modeling difficulties associated with measuring ice crystal growth rates and determining surface attachment coefficients, and many earlier experiments have been affected by a variety of systematic errors [7]. We have made substantial efforts to minimize these problems in the present experiments, but it is nevertheless useful to examine a number of possible remaining systematic errors in detail.
3.1 Defining the Environment
We determined the temperature and supersaturation in our growth chamber following the procedures described in [3, 4]. Convective mixing created a surprisingly uniform temperature inside the chamber, even in the presence of the heated water reservoir [3]. By direct measurement we found that the air temperature in the chamber was uniform over most of its volume to C, and we measured the temperature with an accuracy of C. The supersaturation depended on the temperature of the water reservoir, and we described measurements for calibrating in [3]. We estimate that is known in the present experiments to approximately percent. In addition to random errors, we expect there are likely systematic trends in as a function of at the percent level.
3.2 Competition Effects
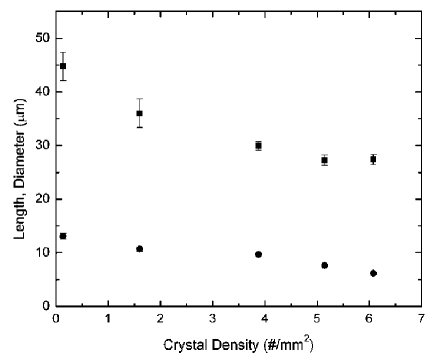
Our calibration of was done with no crystals freely falling in the chamber [3], while our measurements were made with an undetermined number of growing crystals in the chamber. One possible systematic error arises if the number of crystals in the chamber is so large that they collectively remove water vapor from the air faster than it can be replenished, thus effectively reducing We tested this by making measurements using different nucleation pressures (see [3]) to produce different numbers of crystals in the chamber. Figure 8 shows average crystal sizes as a function of the density of crystals found on the substrate after a fixed time. These data were taken at a temperature of C and a background supersaturation of percent.
Extrapolating the points in Figure 8 to zero density would give the limit in which the growing crystals have no effect on the ambient supersaturation in the chamber. We typically operate with low nucleation pressure, essentially at the left-most point in the Figure. The data thus suggest that our inferred supersaturation is not reduced more than perhaps 20 percent by the presence of growing crystals.
3.3 Sampling Errors
Another potential systematic error occurs because crystals are not observed immediately after they land on the substrate, because it takes time to find them as the substrate is scanned. Thus each measurement of a crystal size gives where is the time between nucleation and when the crystal landed on the substrate, and is the time between when the crystal landed and when it was observed. In the present measurements we opened the shutter and scanned the substrate for about 30 seconds, thus ensuring that seconds, and we estimate that typical values were seconds.
In our previous measurements we reported evidence for an initial rapid crystal growth followed by slower growth at C [4]. More careful measurements in the present experiments did not confirm this behavior, and we now believe that sampling errors were distorting our earlier data. In short, we sampled the substrate too long while collecting the -10 C data in [4], and the long produced a signal that mimicked an initial rapid growth period.
3.4 Sedimentation Effects
Our crystals were grown while in free fall inside our chamber, and observed once they landed on the substrate. Thus we only sample crystals that make it to the substrate, which is not a completely unbiased sample. At early times, for example, we expect that the larger and heavier crystals will be oversampled at the substrate. Likewise, at later times most of the crystals will have already fallen, so we will be sampling crystals that fall more slowly than average. We do not believe this was a large effect, but it may have distorted our data somewhat. In our modeling, we tended to give less weight to crystals that fell especially early or especially late in our measurements.
3.5 Substrate Growth Effects
Once a crystal lands on our substrate, it will grow or evaporate with time, depending on the temperature of the substrate relative to the surrounding air. This behavior was easily seen in our experiments, so we took considerable care to minimize any systematic errors that resulted. First, we carefully controlled the substrate temperature and operated near the equilibrium point, where the crystals did not grow or evaporate. And second, we kept small to minimize growth/evaporation effects. Occasionally we made observations as a function of to estimate the size of any residual systematic errors. We believe that substrate growth effects did not alter the measurements more than roughly percent.
3.6 Modeling Errors
Once we have produced trustworthy crystal size measurements as a function of growth time, there are additional errors that may come in when modeling the growth data to yield attachment coefficients. These are much reduced if the observed crystals are small, and they are also reduced when the attachment coefficients are small [1]. Then the growth is limited mainly by attachment kinetics, so there is little difference between and , and the attachment coefficients are easily extracted from the growth data for simple crystals [1]. In our data the differences between and can be seen by comparing the numbers in Figures 3 and 4 for the -5 C data, and likewise from Figures 6 and 7 for the -10 C data. Because the differences are fairly small, we expect that errors introduced by imperfections in our modeling of diffusion-limited growth are likely not substantial.
There is one exception, however, in our inference of in the -5 C data. We observed a substantial degree of hollowing in the columnar crystals at -5 C, especially at the higher supersaturations. Our model crystals, however, showed little hollowing at all supersaturations. The difference probably means that our inferred at -5 C are too high, especially at the higher supersaturations, but even this statement is uncertain. We plan to address the hollowing issue in a future investigation.
It is instructive to compare the present results with similar data from [6], since both experiments included measurements of freely falling crystals in air near C. The raw data in [6] compare reasonably well with the data presented here, and yet the conclusions of the two studies are quite different: Figure 4 shows little variation in and with whereas Figure 4 in [6] shows large reductions in both and for percent. We investigated this discrepancy and found that most of the difference comes from modeling. First, the Green’s function technique used in [6] is not nearly as stable as the cellular-automata method used here, and we believe that the difference introduced errors in the inferred attachment coefficients and surface supersaturations in [6]. Second, the power-law fits assumed in [6] were inappropriate. This functional form fits the data reasonably well only because we have so little data at early times. The cellular automata models shown in Figures 2 and 3, however, are not well described by the power-law behavior assumed in [6]. We were also more careful to record an unbiased sample of growing crystals in the present experiments, but this did not seem to make a large difference compared to the data in [6].
4 Discussion
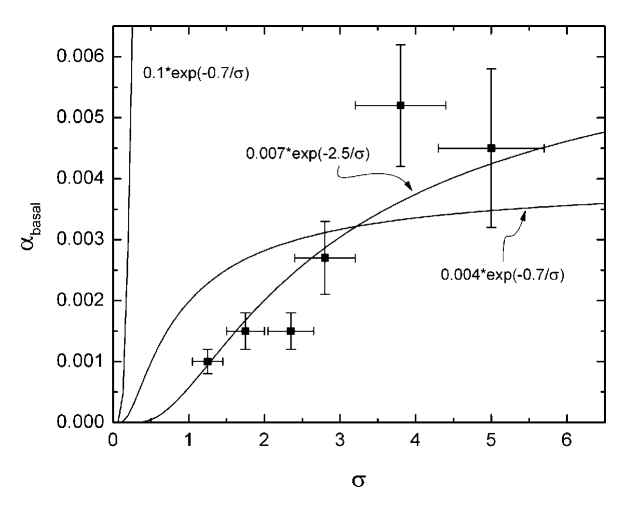
Figure 9 shows a comparison of the present data at -10 C with crystal growth data taken at the same temperature but in a low-pressure environment [8]. The highest curve in Figure 9 shows a fit to measurements of at 0.005 bar, showing that is much higher at low pressure. We have speculated previously that this difference arises from surface impurities impeding ice growth in the 1-bar data [2]. The other two curves show that using percent (from the low-pressure data [8]) yields a poor fit to the 1-bar data, and that the latter suggest a value closer to percent. The assumption of 2D-nucleation-limited growth may not be a good one in the presence of surface impurities, however, and some other growth model may be needed.
At present we have essentially no theory to explain the phenomenology of snow crystal growth as a function of temperature and supersaturation [1]. Basic atomistic crystal growth theory is simply not sufficient to explain the observations, even at a qualitative level. The data presented here and in [4] are but a first step toward collecting precise measurements of and as a function of temperature and supersaturation in air at atmospheric pressure. Additional measurements for crystals grown in different gases with various impurity levels as a function of pressure are also needed. As such measurements accumulate, we hope that the data lead to a better understanding of ice crystal growth, and of crystal growth dynamics in general.
References
- [1] Libbrecht, K. G., “The physics of snow crystals,” Rep. Prog. Phys., 68, 855-895 (2005).
- [2] Libbrecht, K. G., “Crystal growth in the presence of surface melting and impurities: An explanation of snow crystal morphologies,” arXiv:0810.0689 (2008).
- [3] Libbrecht, K. G. and Morrison, H. C., “A convection chamber for measuring ice crystal growth dynamics,” arXiv:0809.4869 (2008).
- [4] Libbrecht, K. G., Morrison, H. C., and Faber, B., “Measurements of snow crystal growth dynamics in a free-fall convection chamber,” arXiv:0811.2994 (2008).
- [5] Libbrecht, K. G., “Physically derived rules for simulating faceted crystal growth using cellular automata,” arXiv:0807.2616 (2008).
- [6] Libbrecht, K.,G., and Yu, H., “Crystal growth in the presence of surface melting: supersaturation dependence of the growth of columnar crystals,” J. Cryst. Growth 222, 822-831 (2001).
- [7] Libbrecht, K. G., “A critical look at ice crystal growth data,” arXiv:0411662 (2004).
- [8] Libbrecht, K. G., “Growth rates of the principal facets of ice between -10C and -40C,” J. Cryst. Growth 247, 530 (2003).