Do black hole masses scale with classical bulge luminosities only? The case of the two composite pseudobulge galaxies NGC 3368 and NGC 3489††thanks: Based on observations at the European Southern Observatory VLT (078.B-0103(A)), and on service observations made with the William Herschel Telescope operated on the island of La Palma by the Isaac Newton Group in the Observatorio del Roque de los Muchachos of the Instituto de Astrofísica de Canarias.
Abstract
It is now well established that all galaxies with a massive bulge component harbour a central supermassive black hole (SMBH). The mass of the SMBH correlates with bulge properties such as the bulge mass and the velocity dispersion, which implies that the bulge and the central black hole of a galaxy have grown together during the formation process. As part of an investigation of the dependence of the SMBH mass on bulge types and formation mechanisms, we present measurements of SMBH masses in two pseudobulge galaxies. The spiral galaxy NGC 3368 is double-barred and hosts a large pseudobulge with a tiny classical bulge component at the very centre. The S0 galaxy NGC 3489 has only a weak large-scale bar, a small pseudobulge and a small classical bulge. Both galaxies show weak nuclear activity in the optical, indicative of the presence of a supermassive black hole. We present high resolution, adaptive-optics-assisted, near-infrared integral field data of these two galaxies, taken with SINFONI at the Very Large Telescope, and use axisymmetric orbit models to determine the masses of the SMBHs. The SMBH mass of NGC 3368, averaged over the four quadrants, is M⊙ with an error of M⊙, which mostly comes from the non-axisymmetry in the data. For NGC 3489, a solution without black hole cannot be excluded when modelling the SINFONI data alone, but can be clearly ruled out when modelling a combination of SINFONI, OASIS and SAURON data, for which we obtain M⊙. Although both galaxies seem to be consistent with the - relation, at face value they do not agree with the relation between bulge magnitude and black hole mass when the total bulge magnitude (i.e., including both classical bulge and pseudobulge) is considered; the agreement is better when only the small classical bulge components are considered. However, taking into account the ageing of the stellar population could change this conclusion.
keywords:
galaxies: kinematics and dynamics — galaxies: bulges — galaxies: individual (NGC 3368, NGC 3489)1 Introduction
| Galaxy | Type | D | PA | (phot.) | (phot.) | (class.) | (class.) | Activity111Ho et al. (1997) | |
|---|---|---|---|---|---|---|---|---|---|
| (Mpc) | () | () | (arcsec) | (arcsec) | |||||
| NGC 3368 | SAB(rs)ab | 10.4 | 172 | 53 | 24.9 | -23.42 | 1.6 | -19.48 | L2 |
| NGC 3489 | SAB(rs)0+ | 12.1 | 71 | 55 | 4.3 | -21.91 | 1.3 | -20.60 | T2/S2 |
Bulges located in the central regions of disc galaxies are commonly identified as the region where the excess light above the outer exponential disc dominates the surface brightness profile. Bulges were generally regarded as scaled-down versions of elliptical galaxies, probably formed via minor galaxy mergers. There is now evidence that there is also a second type of central structure, the so-called pseudobulges, which are more similar to mini-discs than to mini-ellipticals. They were first introduced by Kormendy (1993), and Kormendy & Kennicutt, Jr. (2004) review properties and formation mechanisms and present a number of examples. Pseudobulges are thought to be the result of secular evolution and can be identified e.g. through the presence of disc-like structure (nuclear spirals, bars or rings), flattening similar to that of the outer disc, rotation-dominated kinematics, exponential surface brightness profiles or young stellar populations. As the formation mechanisms of classical and pseudobulges are fundamentally different and can happen independently, galaxies could harbour both types of bulges (Erwin et al., 2003; Athanassoula, 2005; Erwin, 2008). But this fundamental difference between the formation mechanisms also leads to the question whether and how a central black hole grows inside a pseudobulge and how the mass of the black hole relates to pseudobulge properties. Supermassive black holes (SMBHs) in elliptical galaxies and classical bulges are known to follow tight correlations with luminosity (e.g. Kormendy & Richstone 1995; Marconi & Hunt 2003), mass (Häring & Rix, 2004) and velocity dispersion (- relation, Gebhardt et al. 2000b; Ferrarese & Merritt 2000) of the bulge. It is not clear whether pseudobulges follow the same relations, for several reasons: 1. There are only very few direct SMBH mass measurements in pseudobulges. 2. The concept of pseudobulges is relatively new and the classification criteria therefore differ somewhat from author to author. 3. The fact that at least some galaxies could contain both bulge types (composite bulges) makes the classification and correlation studies even more complicated. The composite bulges need to be decomposed properly in order to find out with which property of which bulge component the SMBH mass correlates. Kormendy (2001) did not find any dependence of the - relation on the mechanism that feeds the black hole. In contrast Hu (2008) finds that the black holes in pseudobulges have systematically lower masses than black holes in classical bulges and ellipticals with the same velocity dispersion. Both studies suffer from small number statistics and unclear classification issues. For low-mass galaxies without classical bulge (i.e. likely hosts of a pseudobulge) and with virial SMBH mass estimates Greene, Ho & Barth (2008) found no deviation from the - relation, but a likely disagreement with the - relation. Gadotti & Kauffmann (2009) found for a large number of SDSS galaxies that pseudobulges, classical bulges and ellipticals cannot follow both the - and the - relation at the same time. As they estimated from the - relation by Häring & Rix (2004) it is not clear whether their pseudobulges follow a different - or - relation or both.
In this paper we present a thorough analysis and derivation of the black-hole masses via extensive stellar dynamical modelling of NGC 3368, a double-barred spiral galaxy (Erwin, 2004) of type SAB(rs)ab with a well-defined pseudobulge and a very small classical bulge component, and NGC 3489, a SAB(rs)0+ galaxy with a weak large bar, a small pseudobulge and a similar-sized classical bulge. All important parameters of the two galaxies are listed in Table 1. Using high-resolution imaging we are able to identify and decompose the pseudobulge and classical bulge components. High-resolution adaptive-optics assisted near-IR integral-field spectroscopy enables us to model each quadrant separately. In contrast to our two previous studies of elliptical galaxies (Nowak et al., 2007, 2008), non-axisymmetries may play a larger role due to the barred nature of the galaxies.
The nucleus of NGC 3368 is weakly active and can be classified as a LINER2 based on optical emission line ratios (Ho, Filippenko & Sargent, 1997). Maoz et al. (2005) and Maoz (2007) report long-term UV variations, which suggests the presence of an AGN and thus a SMBH. NGC 3489 has a weak LINER/HII transition type or Seyfert 2 nucleus (Ho et al., 1997).
We adopt a distance to NGC 3368 of Mpc throughout the paper based on surface brightness fluctuation measurements (Tonry et al., 2001). At this distance, 1 arcsec corresponds to pc. For NGC 3489 we adopt a distance of 12.1 Mpc ( pc arcsec-1), also based on the measurements of Tonry et al. (2001). If the - relation (Tremaine et al., 2002) applies, both galaxies are close enough to resolve the sphere of influence of the black hole from the ground with adaptive optics.
This paper is organised as follows: In §2 we discuss the morphology of the two galaxies, including photometric (and spectroscopic) evidence for pseudobulges and classical bulges. The spectroscopic data, including stellar kinematics, gas kinematics and line strength indices are described in §3. The stellar dynamical modelling procedure and the results for the SMBH mass of each galaxy are presented in §4 and §5. §6 summarises and discusses the results.
2 Imaging
2.1 Identifying Discs, Pseudobulges, and Classical Bulges
As mentioned in the Introduction, both NGC 3368 and NGC 3489 have complex morphologies; they are not simply an exponential disc plus a classical bulge. In this section, we explain our approach for analysing the morphology of these galaxies, and how we decompose their surface brightness profiles for purposes of dynamical modelling.
Since discs and bulges can have different mass-to-light ratios , we need to separate these components for modelling purposes. But we also need to ensure that what we call the “bulge” really is distinct from the disc, and not simply a higher-surface-brightness extension of the disc. NGC 3368 has already been classified by Drory & Fisher (2007) as a galaxy where the bulge is a “pseudobulge”, so we need to consider whether this galaxy even has a distinct bulge; if it does have a pseudobulge, we need to identify that.
Our overall approach is as follows: First, we perform a “naive” global bulge/disc decomposition, where we treat the entire surface-brightness profile as the combination of an outer exponential (the “main disc”) and a Sérsic profile. The latter component is the “photometric bulge,” which would traditionally be considered the bulge – i.e., the kinematically hot spheroid – of the galaxy. Second, we focus on the photometric bulge region (that is, where the Sérsic component dominates the modelled global light profile), and examine the morphology and stellar kinematics. In both galaxies, we find evidence that these regions are predominantly disclike and thus not classical bulges. This argues that we should treat most of the photometric bulge region as part of the disc. Finally, we also find evidence that the central few hundred parsecs contain an additional component: a central light excess above the disclike bulge region associated with kinematically hot stellar kinematics and rounder isophotes. It is this last component which we call the “classical bulge,” and which we treat as a separate stellar component in our modelling.
We thus consider both galaxies to be similar to NGC 2787 and NGC 3945, where Erwin et al. (2003) showed that the photometrically defined “bulges” of both galaxies were really bright “inner discs,” with much smaller (and rounder) bulges inside the inner discs. Erwin (2008) and Erwin et al. (2009, in prep) discuss more examples of such “composite bulge” galaxies, and Athanassoula (2005) provides a theoretical context for such systems.
To summarise: Both galaxies appear to consist of a disc with an outer exponential profile222This is a simplification, since the profile of the disc at very large radii may change (Erwin et al., 2008), but this has no effect on our modelling. and a steeper inner profile, along with a small central excess with rounder isophotes and stellar kinematics which we consider to be the (classical) bulge. The steep inner part of the disc can be considered a discy pseudobulge, but for modelling purposes we treat it as just the inner part of the disc.
2.2 Imaging Data and Calibrations
The imaging data we use comes from a variety of sources, including the Two-Micron All-Sky Survey (2MASS; Skrutskie et al., 2006), the Sloan Digital Sky Survey (SDSS; York et al., 2000), and the Hubble Space Telescope archive. We also use near-IR images taken with the Isaac Newton Group Red Imaging Device (INGRID, a near-IR imager with 0.24 arcsec pixels) on the William Herschel Telescope: a -band image of NGC 3368 from Knapen et al. (2003), available via NED, and an -band image of NGC 3489 obtained during service/queue time (February 11, 2003). The seeing for the INGRID images was 0.77 arcsec FWHM for NGC 3368 and 0.74 arcsec FWHM for NGC 3489. Finally, we also use -band images created from our SINFONI datacubes (see Fig. 13).
The SDSS -band images are used for measuring the shape of the outer-disc isophotes, which helps us determine the most likely inclination for each galaxy. The innermost isophote shapes and surface brightness profiles are determined from the HST archival images. For NGC 3368, we choose a NICMOS2 F160W image (PI Mulchaey, proposal ID 7330) for that purpose; with F450W and F814W WFPC2 images (PI Smartt, proposal ID 9042) we construct high-resolution colour maps and attempt to correct the NICMOS2 image for dust extinction. For NGC 3489, we used F555W and F814W WFPC2 images (PI Phillips, proposal ID 5999). We attempted to correct the NICMOS2 F160W image (for NGC 3368) and the WFPC2 F814W image (for NGC 3489) for dust extinction, following the approach of Barth et al. (2001) and Carollo et al. (1997). This involved creating a colourmap for NGC 3368 and a colourmap for NGC 3489, then generating corresponding and extinction maps and correcting the NICMOS2 and WFPC2 F814W images. The results were reasonably successful for NGC 3489, but less so for NGC 3368, perhaps due to the much stronger extinction in the latter galaxy.
The 2MASS images are used primarily to calibrate the INGRID near-IR images. Since the latter suffer from residual sky-subtraction problems, we calibrate them by matching surface-brightness profiles from the INGRID images with profiles from the appropriate 2MASS images (-band for NGC 3368, -band for NGC 3489), varying both the scaling and a constant background offset until the differences between the two profiles are minimized. We then carry over this calibration to surface-brightness profiles from the HST images: i.e., we calibrate the NICMOS2 F160W profile to -band for NGC 3368 by matching it to the (calibrated) INGRID -band profile (including a background offset), and similarly match the WFPC2 F814W profile to INGRID -band profile for NGC 3489. Profiles from the SINFONI -band images are then calibrated by matching them to the appropriate calibrated HST profiles.
2.3 NGC 3368
2.3.1 Morphological overview
NGC 3368 is a relatively complex spiral galaxy, with a number of different stellar components. Erwin (2004) argued that the central regions of NGC 3368 included at least three distinct components: an outer bar with semi-major axis – arcsec (4.4–5.4 kpc, deprojected), an “inner disc” extending to – arcsec (– kpc, deprojected), and an inner bar with – arcsec (200–300 pc, deprojected). As noted above, this set of nested structures is very similar to that of the double-barred galaxy NGC 3945 (Erwin & Sparke, 1999), where Erwin et al. (2003) found that the galaxy’s “photometric” bulge could be decomposed into a bright, kinematically cool disc (first noted by Kormendy 1982) with an exponential profile and a much smaller, rounder object dominating the inner few hundred parsecs – apparently a central, spheroidal bulge.
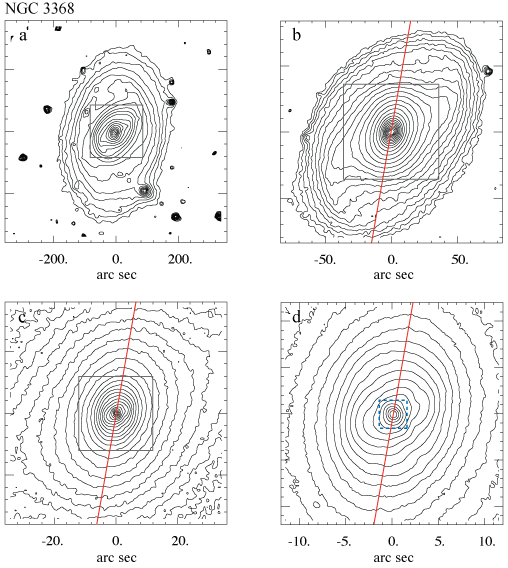
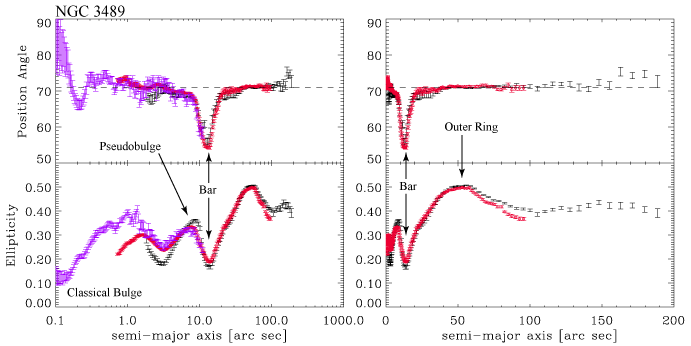
The isophotes of NGC 3368 are shown in Fig. 1 for different scales. The isophotal ellipse fits to ground-based and HST near-IR images are shown in Fig. 2. In the inner region ( arcsec), the ellipticity rises to a local maximum of and the isophotes are closely aligned with the outer disc. Even further in, inside the inner bar (semi-major axis arcsec), the isophotes become quite round, with a mean ellipticity of . The isophotes in this region also twist significantly; inspection of both the NICMOS2 image and our SINFONI datacubes indicate that this twisting is produced by strong dust lanes on either side of the galaxy centre. The true (unextincted) ellipticity in this region is probably close to 0. This suggest that NGC 3368 harbours a small classical bulge, again in analogy to NGC 3945. The size of the classical bulge region is much larger than the NICMOS PSF and is therefore well resolved and an AGN can thus be excluded. In addition we do not find emission lines characteristic for an AGN in our SINFONI spectra (see below).
2.3.2 Bulge-disc decomposition


Fig. 3 shows a global bulge-disc decomposition for NGC 3368, in which the photometric bulge (the Sérsic component of the fit) dominates the light at arcsec.
Fig. 4 shows a Sérsic + exponential decomposition of the inner arcsec region. In this decomposition, we are now treating what we previously identified as the photometric bulge as a disc-like component (i.e. the pseudobulge), which has (compared to the outer disc) a relatively steep exponential profile, plus a central Sérsic excess. Note that we are fitting the inner region of the original data, i.e. we did not subtract the outer exponential disc. The result is a reasonably good fit, suggesting that the inner arcsec region – where, as noted, the isophotes are quite round – is a separate component (best-fit Sérsic parameters: , arcsec, ).
2.3.3 Kinematic structure of the photometric bulge
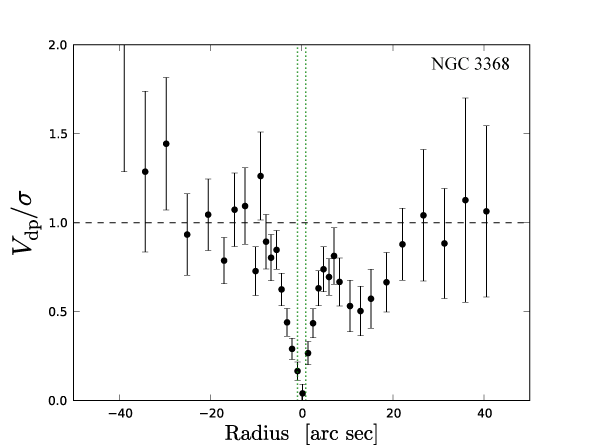
In Fig. 5 we use the long-slit kinematic data of Héraudeau et al. (1999) to show an estimate of the local ratio of ordered to random stellar motions as a function of radius: , which is the observed stellar velocity deprojected to its in-plane value (assuming an axisymmetric velocity field), divided by the observed velocity dispersion at the same radius. Even though the data are all inside the photometric bulge ( arcsec), the ratio of rises above 1 over much of this region. This is certainly higher than one would expect for a classical (kinematically hot) bulge, in which stellar motions are dominated by velocity dispersion. An unpublished spectrum with higher S/N from the Hobby-Eberly Telescope (M. Fabricius, private communication) shows even larger values of for arcsec, as well as on both sides of the centre at –9 arcsec. Our tentative conclusion is that most of the photometric bulge is thus a discy, kinematically cool pseudobulge (in effect, an inward extension of the disc), similar to that found in NGC 3945. We note that the photometric bulge of NGC 3368 has also been classified as a pseudobulge by Drory & Fisher (2007), based on morphological features in HST images. Dynamical modelling of the high-resolution SINFONI data shows that the centre of the photometric bulge harbours a kinematically hot component (see §4.4), thus confirming the presence of a small classical bulge component.
2.3.4 Orientation and inclination of the galaxy
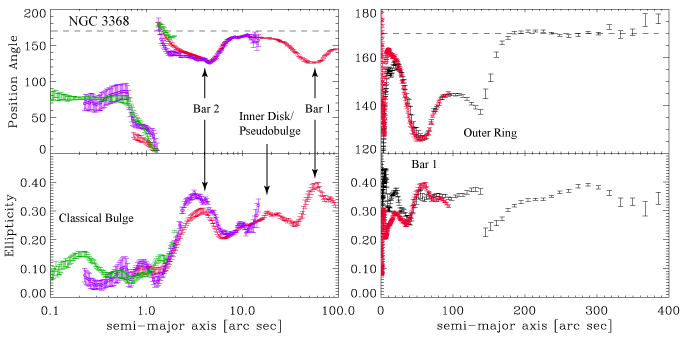
Our ellipse fits of the merged SDSS -band image (black points in Fig. 2) shows a consistent position angle of for the outermost isophotes. These ellipse fits extend well outside the star-forming outer ring ( arcsec) and are thus unlikely to be affected by any intrinsic noncircularity of the ring itself. This position angle agrees very well with the kinematic position angles determined from both H i observations (PA , based on the data of Schneider 1989, as reported by Sakamoto et al. 1999) and from the Fabry-Perot H+[N ii] velocity field of Sil’chenko et al. (2003, see also ). Sil’chenko et al. also find a kinematic position angle of 170– in the stellar kinematics of the inner arcsec, from their IFU data.
The ellipticity of the outer -band isophotes is , with a range of 0.34–0.39. A lower limit on the inclination is thus , for a razor-thin disc; thicker discs imply higher inclinations. For an intrinsic thickness of –0.25, the inclination is . This is close to the inclination of estimated by Barberà, Athanassoula & García-Gómez (2004), based on Fourier analysis of Frei et al. (1996) images (note that these images do not extend beyond the outer-ring region, and so they might in principle be biased if the ring is noncircular).
An additional, independent estimate of the inclination can be had by inverting the Tully-Fisher relation: since we know the observed H i velocity width and the distance to NGC 3368, we can determine the inclination needed to make the galaxy follow the Tully-Fisher relation. We use the recently published 2MASS Tully-Fisher relation of Masters, Springob & Huchra (2008). For a 2MASS -band “total” magnitude (Jarrett et al., 2003) of 6.31 (including a slight reddening correction from Schlegel, Finkbeiner & Davis 1998, as given by NED) and a distance of 10.4 Mpc, the absolute magnitude is . Using the “Sb” T-F relation from table 3 of Masters et al. (2008), this corresponds to a corrected, edge-on velocity width of . For the observed width, we use the tabulated value in Springob et al. (2005), which is ; after applying the recommended correction for turbulent broadening (6.5 ), this becomes , and thus .
Taken all this into considerations, we can argue that NGC 3368 has a line of nodes with PA and an inclination somewhere between and , most likely .
2.4 NGC 3489
2.4.1 Morphological overview and evidence for a composite pseudobulge
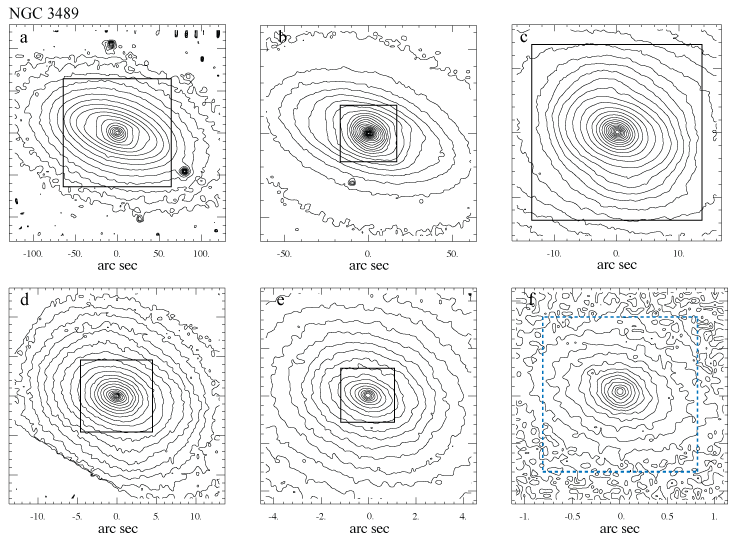
NGC 3489 is structurally somewhat simpler than NGC 3368, with only one bar instead of two. The bar itself is rather weak and difficult to recognise, because it lies almost along the minor axis of the galaxy. Projection effects thus foreshorten it so that it is visible primarily due to the abrupt isophote twists, manifesting in the ellipse fits as an extremum in the fitted position angle and a minimum in the ellipticity (Fig. 6 and Fig. 7). Further outside, the isophotes become maximally elongated at arcsec, and then converge to a mean ellipticity of at larger radii. As shown by Erwin & Sparke (2003), the ellipticity peak at arcsec is due to an outer ring; the lower ellipticity outside is thus the best representation of the outer disc.
2.4.2 Bulge-disc decomposition


We do find some evidence that the inner structure of NGC 3489 is similar to that of NGC 3368 (except for the absence of an inner bar in NGC 3489). We start with the global bulge-disc decomposition (Fig. 8), which results in a Sérsic component (the photometric bulge) dominating the light at arcsec. The isophotes in this region are still fairly elliptical – e.g., ellipticity at –8 arcsec, which suggests that the photometric bulge is a flattened structure.
As in the case of NGC 3368, we find that the profile of the inner photometric bulge can be decomposed into an exponential plus a smaller, additional Sérsic component (Fig. 9). This Sérsic component dominates the light at arcsec. Note, however, that the isophotes do become quite elliptical at arcsec, so we do not have as clean a case as in NGC 3368 for a rounder spheroidal component. The fit in Fig. 9 shows evidence for a possible nuclear excess at arcsec. This might be evidence for a separate nuclear star cluster, similar to that seen in the profile of NGC 2787 (Erwin et al., 2003).
2.4.3 Kinematic structure of the photometric bulge
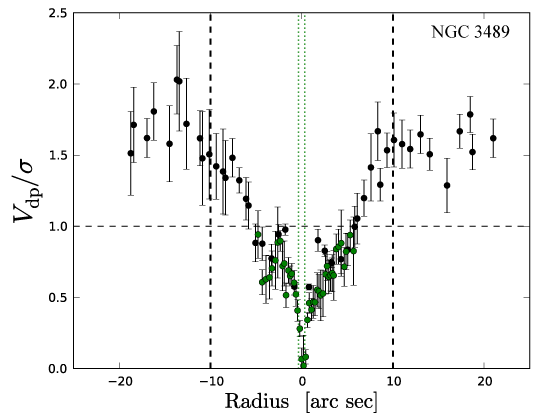
There is in addition kinematic evidence that the exponential part of the photometric bulge region is kinematically cool and thus a pseudobulge. In Fig. 10 we plot the local ratio of (deprojected) stellar rotation velocity to velocity dispersion. These values are based on synthesised long-slit profiles derived from the SAURON and OASIS velocity and velocity dispersion fields (Emsellem et al., 2004; McDermid et al., 2006), using slits at PA . The ratio rises to values at arcsec, still within the photometric bulge-dominated region, which suggests that the photometric bulge is at least partly dominated by rotation. As in NGC 3368 drops in the centre but only at smaller radii. Together with the significant flattening in the centre this suggests that the very central region of NGC 3489 is structurally different (dynamically colder), which is also supported by the dynamical analysis (see §5.5).
2.4.4 Orientation and inclination of the galaxy
Lacking the extensive large-scale gas kinematic information that was available for NGC 3368, we rely on the isophotes of the outer disc to determine the global orientation of NGC 3489. Fortunately, apart from the local maximum in ellipticity at arcsec due to the outer ring (see above), the outer disc is fairly well defined, with position angle and a mean ellipticity of 0.41, corresponding to an inclination of .
3 Spectroscopy
3.1 Data & Data Reduction
NGC 3368 and NGC 3489 were observed between March 22 and 24, 2007, as part of guaranteed time observations with SINFONI (Eisenhauer et al., 2003; Bonnet et al., 2004), an adaptive-optics assisted integral-field spectrograph at the VLT UT4. We used the -band grating and the arcsec2 field of view ( arcsec2 spaxel-1) for NGC 3368 and the arcsec2 field of view ( arcsec2 spaxel-1) for NGC 3489. The total on-source exposure time was min for NGC 3368 and min for NGC 3489, consisting of min exposures taken in series of “object–sky–object” cycles, dithered by a few spaxels.
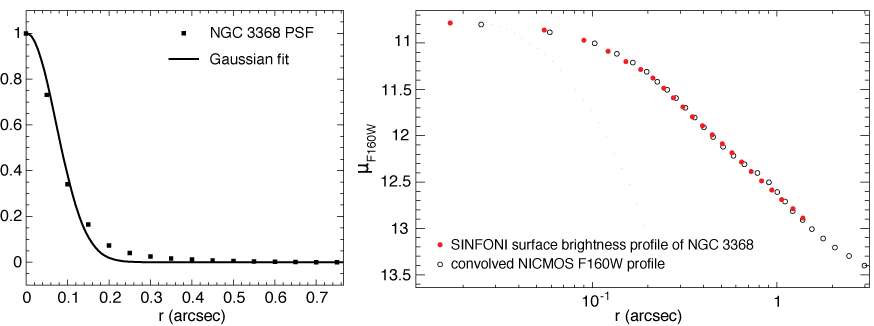
The laser guide star (LGS) PARSEC (Rabien et al., 2004; Bonaccini et al., 2002) was used for the AO correction of NGC 3368, with the tip-tilt sensor closed on the nucleus of NGC 3368 (, within a arcsec diameter aperture). Although the nucleus itself is just bright enough to be used as natural guide star, its shape is rather irregular and not pointlike in the -band due to the large amounts of dust in the nuclear regions and the lack of a strong AGN. Therefore a better AO correction was expected from using the LGS instead. The ambient conditions were good and stable, with an average seeing of arcsec in the near-IR. The point-spread function was derived by taking an exposure of a nearby star with approximately the same -band magnitude and colour as the nucleus of NGC 3368, using the LGS with the PSF star itself as tip-tilt reference star. The FWHM of the PSF is arcsec (see left panel of Fig. 11) and the achieved Strehl ratio is . Due to the time gap between the observations of the galaxy and the PSF star the measured PSF shape could be different from the PSF during the galaxy observations. We compared the surface brightness profile of the SINFONI data with the surface brightness profile of an HST NICMOS2 F160W image, convolved with Gaussians of different widths and found that the NICMOS surface brightness profile most closely resembles the SINFONI profile for a (see right panel of Fig. 11), confirming our PSF measurement. Note that the Gaussian fitted to the PSF in the left panel of Fig. 11 was only used to determine a nominal spatial resolution and as a reference for comparison with the NICMOS surface brightness profile. A single Gaussian does not fit the wings of the PSF, however, the discrepency between the PSF and the fit is only % in integrated flux. For the dynamical modelling we do not use this fit, but the observed image of the PSF star.
NGC 3489 was observed using its nucleus with ( arcsec diameter aperture) as natural guide star for the AO correction. A PSF star with a similar magnitude and colour was observed regularly in order to determine the spatial resolution. The ambient conditions were excellent and stable with a seeing around arcsec in the near-IR, resulting in a FWHM of the PSF of arcsec and a Strehl ratio of (see Fig. 12).

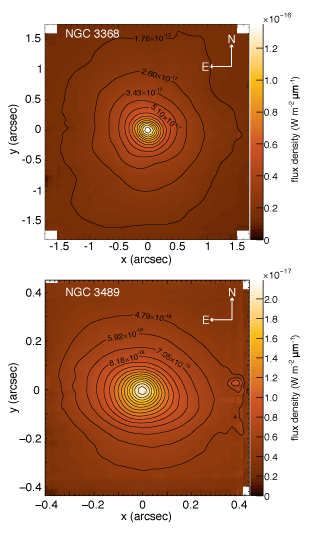
The data reduction was done using the SINFONI data reduction package SPRED (Schreiber et al., 2004; Abuter et al., 2006) as explained in Nowak et al. (2008). The reduction of the telluric standard and the PSF reference star was done with the ESO pipeline. For the flux calibration we used the telluric standard stars Hip 046438 and Hip 085393 with 2MASS Ks magnitudes of and respectively as a reference. Fig. 13 shows the flux-calibrated images of the two galaxies, collapsed along the wavelength direction.
3.2 Stellar Kinematics in NGC 3368
The SINFONI data of NGC 3368 were binned using a binning scheme with five angular and ten radial bins per quadrant, adopting a major-axis position angle of . As in Nowak et al. (2008) we used the maximum penalised likelihood (MPL) technique of Gebhardt et al. (2000a) to extract the stellar kinematics from the first two CO bandheads 12CO(2–0) and 12CO(3–1), i.e. the spectral range between m and m rest frame wavelength. With the MPL method, non-parametric line-of-sight velocity distributions (LOSVDs) are obtained by convolving an initial binned LOSVD with a linear combination of template spectra. The residual differences between the resulting model spectrum and the observed galaxy spectrum are then calculated. Then the velocity profile and the template weights are successively adjusted in order to optimise the fit by minimizing the function , where is the smoothing parameter and is the penalty function. The S/N of the binned spectra ranges between and with a mean value of . In order to determine the optimal smoothing parameters we performed simulations in the same way as in Appendix B of Nowak et al. (2008), but tailored to our dataset. For a galaxy with a velocity dispersion around , a velocity bin width of and the mentioned S/N a smoothing parameter is appropriate. As kinematic template stars we chose four K and M giants which have about the same intrinsic CO equivalent width (EW) as the galaxy (12–14 Å, using the EW definition and velocity dispersion correction from Silge & Gebhardt 2003). The uncertainties on the LOSVDs are estimated using Monte Carlo simulations (Gebhardt et al., 2000a). First, a reference galaxy spectrum is created by convolving the template spectrum with the measured LOSVD. Then 100 realisations of that initial galaxy spectrum are created by adding appropriate Gaussian noise. The LOSVDs of each realisation are determined and used to specify the confidence intervals. We verified that the error bars are correct by checking that the S/N in the simulated spectra corresponds to the S/N measured from the galaxy spectrum. As shown in Nowak et al. (2008), possible biases in the measured LOSVDs are always smaller than the statistical errors.
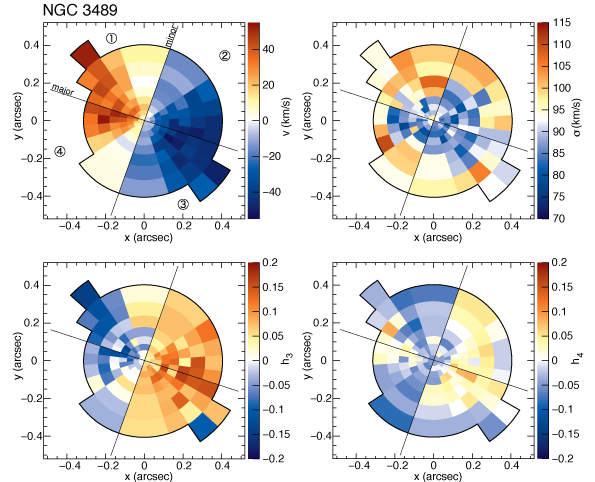
For illustration purposes we fitted Gauss–Hermite polynomials to the LOSVDs. Fig. 14 shows the two-dimensional fields of , and the higher-order Gauss–Hermite coefficients and , which quantify the asymmetric and symmetric deviations from a Gaussian velocity profile (Gerhard, 1993; van der Marel & Franx, 1993). The major-axis profiles are shown in Fig. 21.
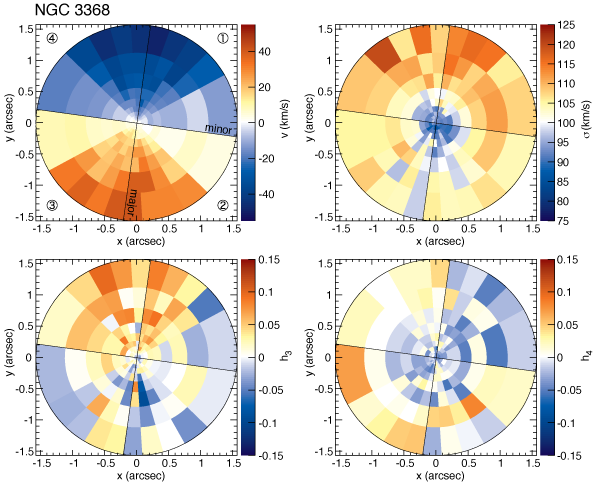
The velocity field of NGC 3368 shows a regular rotation about the minor axis. The average, luminosity-weighted within the total SINFONI field of view is . A central -drop of is present within the inner arcsec, well inside the region of the classical bulge component. -drops are not uncommon in late-type galaxies and are usually associated with nuclear discs or star-forming rings (e.g. Wozniak et al. 2003; Peletier et al. 2007; Comerón et al. 2008). These could be formed e.g. as a result of gas infall and subsequent star formation, but as no change in ellipticity is found in the centre, such a disc would have to be very close to face-on. A -drop does not imply the absence of a SMBH if the centre is dominated by the light of a young and kinematically cold stellar population (see also the discussion in §4.4). Davies et al. (2007) observed -drops in a number of strongly active galaxies. In these AGN the mass of the central stellar component was times that of the SMBH, so no outstanding kinematic signature would be expected. Another example is the velocity dispersion of the Milky Way, which apparently drops in the central pc, and only rises in the inner pc (see Figure 9 of Tremaine et al. 2002). Finally, a central -drop has been found in NGC 1399 (Gebhardt et al., 2007; Lyubenova et al., 2008), where it has been interpreted as a signature of tangential anisotropy.
The velocity dispersion in quadrants and is smaller than in quadrants and . A possible explanation for that behaviour could be the substantial amounts of dust in the central regions (Fig. 15), although the effect of the dust in the -band is relatively weak. The HST WFPC2 colour map (Fig. 15) shows that within the SINFONI field of view the dust extinction is largest in quadrants and . Quadrant is moderately affected while quadrant seems to be relatively dust-free. We will further discuss the asymmetries in §4.5.
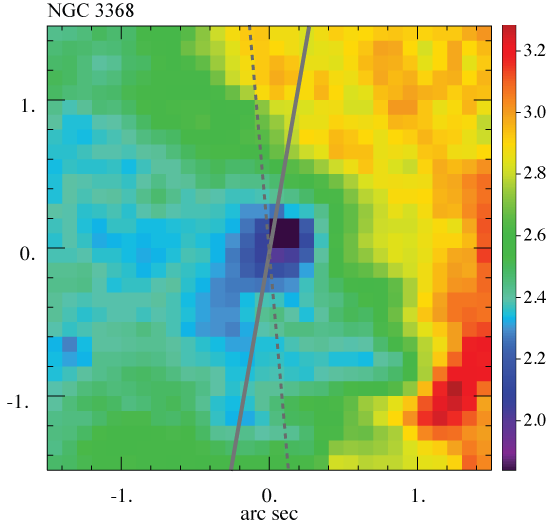
In the near-IR the presence of dust should have a much smaller effect on the kinematics than in the optical, therefore the asymmetry should be much stronger in the kinematics measured using optical absorption lines, if dust is responsible for the asymmetry. Longslit kinematics ( and ) at PA, measured from optical spectra using Fourier-Fitting or FCQ (Bender, Saglia & Gerhard, 1994), are available from Héraudeau et al. (1999) and Vega Beltrán et al. (2001). Two-dimensional kinematics have been measured by Sil’chenko et al. (2003) (see also Moiseev et al. 2004) with the Multi-Pupil Field Spectrograph (MPFS) at the Russian 6 m telescope in the optical using a cross-correlation technique. The spatial resolution of the optical data is between arcsec and arcsec. The velocities of the different authors are in good agreement with each other and with the SINFONI velocities considering the different seeing values. The optical velocity dispersions are, however, significantly larger than those measured with SINFONI. They are on average around for the longslit data and for the MPFS data. There are a number of possible causes for such a discrepancy. The authors used different correlation techniques, slightly different wavelength regions and different templates. A difference between optical and -band measurements was also found by Silge & Gebhardt (2003) for a sample of galaxies and they suggested that this might be caused by strong dust extinction in the optical. But weak emission lines could also alter the absorption lines and thus the measured kinematics. As in the SINFONI data, a velocity dispersion asymmetry is also present in all optical datasets, as well as a velocity asymmetry. The velocity dispersion of Moiseev et al. (2004) is enhanced in the entire region west of the major axis, where also the majority of the dust is located (Fig. 15). However, when comparing the extinction along the location of the longslits of Héraudeau et al. (1999) and Vega Beltrán et al. (2001) with the according velocity dispersion, there seems to be no correlation. Thus it is not clear whether and in what way dust influences the velocity dispersion in NGC 3368.
Another explanation for the asymmetry could be lopsidedness, which is common in late-type galaxies. Possible mechanisms which could cause lopsidedness include minor mergers, tidal interactions and asymmetric accretion of intergalactic gas (Bournaud et al., 2005). As the large-scale stellar and gas velocity fields and gas distributions (Sil’chenko et al., 2003; Haan et al., 2008) are rather regular, a recent merger or collision with another galaxy seems unlikely. Accretion of gas from the intergalactic HI cloud is a more likely scenario (Schneider, 1989; Sil’chenko et al., 2003) and could be a possible explanation for the presence of molecular hydrogen clouds close to the centre (see below). However, there seems to be no lopsidedness in the -band photometry, as any distortions of the isophotes can plausibly be explained by dust. The molecular gas distribution on the other hand is very disordered in the central pc (see below and Haan et al. 2009). Thus if the gas mass differences between different regions of the galaxy would be large enough, they could be a plausible explanation for the distorted stellar kinematics. However, as shown in §4.5, the molecular gas mass is small compared to the dynamical mass and is thus unlikely to have a significant effect on the stellar kinematics.
Central lopsidedness like an M31-like nucleus or otherwise off-centred nuclear disc (Bender et al., 2005; Jog & Combes, 2009) could, if the resolution is just not high enough to resolve the disc as such, leave certain kinematical signatures like a slightly off-centred -peak or -drop. On the other hand we see velocity asymmetries out to arcsec, which is way too large to be explained by an M31-like nuclear disc.
In principle, the outer and inner bars could cause asymmetries in the stellar kinematics. However, the SINFONI field of view is located well inside the inner bar, and the only changes in velocity dispersion associated with inner bars which have been observed are symmetric and take place at the outer ends of inner bars (de Lorenzo-Cáceres et al., 2008).
3.3 Gas Kinematics in NGC 3368
In NGC 3368 the only emission lines detected arise from molecular hydrogen H2. The strongest line is -S(1) at m. To determine the flux distribution and velocity of the H2 gas we fitted a Gaussian convolved with a spectrally unresolved template profile (arc line) to the continuum-subtracted spectrum (Davies et al., 2007). The parameters of the Gaussian are adjusted such that they best fit the data. Fig. 16 shows the flux distribution and the velocity field of H2 -S(1). As the S/N of the H2 emission is very low in some regions we binned the data using adaptive Voronoi binning (Cappellari & Copin, 2003) to ensure an approximately constant S/N and thus a robust velocity measurement in each bin. This binning scheme is different from the radial and angular binning used to measure the stellar kinematics (see Fig. 14), which is appropriate for the dynamical modelling procedure. The flux distribution of the gas is different and more complex than the flux distribution of the stellar light, thus it would be inappropriate to use the same binning as for the stars for the purpose of S/N adjustment of the gas emission. The most striking feature seen in Fig. 16 are the two clouds of H2 gas, located and north of the photometric centre. These two clouds are kinematically decoupled from the remaining H2 gas distribution and seem to move in opposite directions. Their projected sizes are approximately pc and pc FWHM. The H2 distribution outside these two clouds is relatively smooth. Its kinematic position angle, measured using the method described in Appendix C of Krajnović et al. (2006), is and thus agrees with the stellar kinematic position angle. The gas velocity follows the rotation of the stars within a radius of ; outside that radius it rotates faster, reaching rotation velocities up to .
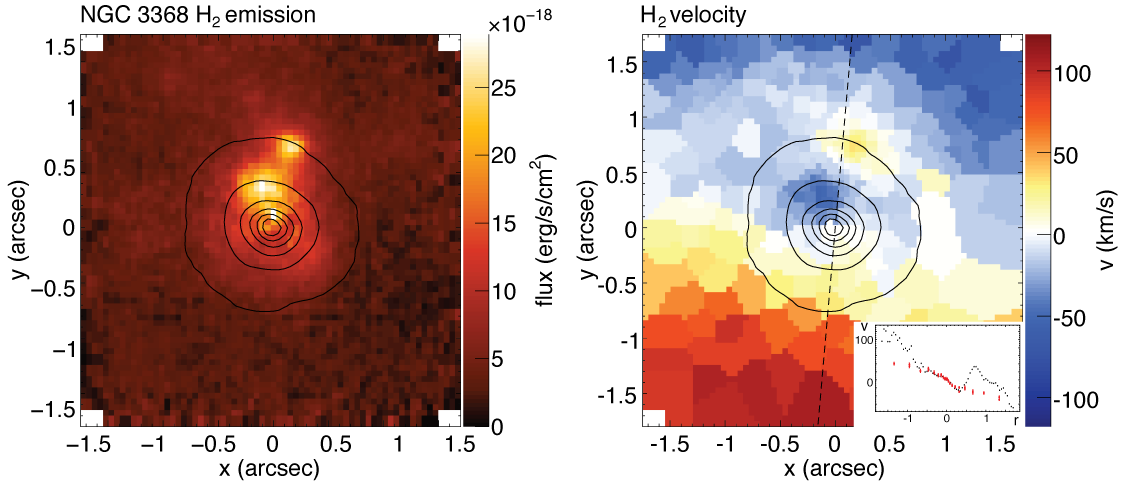
The origin of the H2 clouds is unclear. H2 emission line ratios can help to distinguish between different excitation mechanisms like shock heating, X-ray illumination or UV fluorescence (Rodríguez-Ardila, Riffel & Pastoriza, 2005). Table 2 shows the H2 line ratios for different regions (the total SINFONI field of view and the two H2 clouds). They indicate that the H2 gas is thermalised in all regions of the SINFONI field of view (cf. figure 5 in Rodríguez-Ardila et al. 2005).
The ratio -S(1) 2.247 m/-S(1) 2.122 m and therefore the vibrational excitation temperature (Reunanen, Kotilainen & Prieto, 2002) is smaller in the H2 clouds than in the regions where H2 is evenly distributed.
| Region | 1–0S(1) ( erg s-1 cm2) | (K) | ()333The first value gives the cold H2 mass as estimated from hot H2 using the conversion of Mueller Sánchez et al. (2006). The second value gives the real cold gas mass after calibration against direct mass measurements from CO () at arcsec (Sakamoto et al., 1999). | |||||
| cloud1 | 1.66 | 1.35 | 0.56 | 0.20 | 0.12 | 2280 | 9.13 | 2.23 — 0.21 |
| cloud2 | 0.83 | 1.30 | 0.51 | 0.21 | 0.11 | 2203 | 4.57 | 1.12 — 0.10 |
| total | 21.40 | 1.69 | 0.98 | 0.26 | 0.17 | 2740 | 117.77 | 28.72 — 2.65 |
3.4 Line Strength Indices for NGC 3368
The stellar populations of NGC 3368 have been analysed by Sil’chenko et al. (2003) and Sarzi et al. (2005) using optical spectra. Both found that a relatively young stellar population with a mean age of around Gyr dominates the central region. Towards larger radii Sil’chenko et al. (2003) found a strong increase in age.
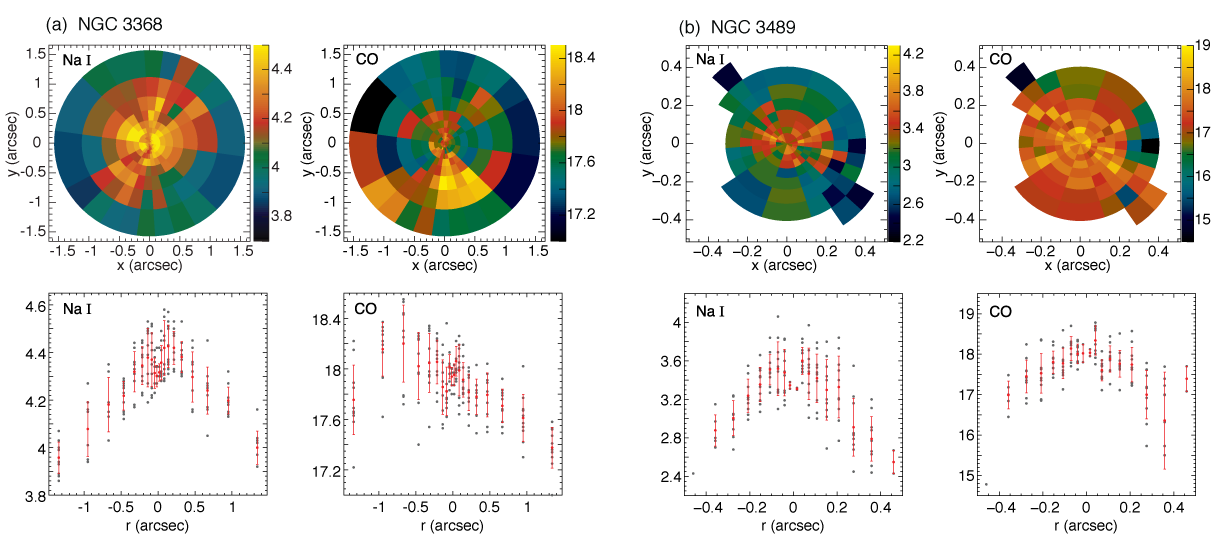
Fig. 17 shows the near-IR line indices Na I and CO measured in the same way as in Nowak et al. (2008), using the definitions of Silva, Kuntschner & Lyubenova (2008). The average values inside the SINFONI field of view are listed in Table 3. They differ significantly from the relations between Na I or CO and found by Silva et al. (2008) for early-type galaxies in the Fornax cluster which may be, as in the case of Fornax A, probably due to the relatively young age of the stellar population. Younger populations seem to have larger Na I at equal than old stellar populations in the galaxy samples of Silva et al. (2008) and Cesetti et al. (2009). However, no such trend is obvious for the CO index, so the difference seen here could be due to other aspects like metallicity or galaxy formation history. The measured average indices have values which are quite similar to those found in the centre of Fornax A (Nowak et al., 2008), which could indicate that the stellar populations are quite similar in terms of age and metallicity. However, the interpretation of Na I, Ca I and Fe I must be done bearing in mind that these features always include significant contributions from other elements (Silva et al., 2008).
| NGC 3368 | NGC 3489 | |
|---|---|---|
| Na I | 4.30 (0.16) | 3.30 (0.36) |
| Ca I | 2.40 (0.29) | 1.53 (0.50) |
| Fe I A | 1.55 (0.07) | 1.25 (0.23) |
| Fe I B | 0.91 (0.10) | 0.76 (0.21) |
| CO | 17.90 (0.27) | 17.70 (0.72) |
The radial distribution of the line indices (Fig. 17) shows a slight asymmetry, similar to the kinematics. The two quadrants with the smaller have larger CO EWs and smaller Na I EWs than the other two quadrants. In addition there seems to be a strong negative gradient in Na I and a moderately strong negative gradient in CO. Ca I and Fe I are approximately constant with radius. A small central drop is present in most indices, which could indicate the presence of weak nuclear activity (see Davies et al. 2007).
3.5 Stellar Kinematics in NGC 3489
The NGC 3489 data were binned in the same way as the NGC 3368 data, with identical angular bins and nine somewhat smaller radial bins due to the higher spatial resolution. A position angle of was used. The mean S/N is , and a smoothing parameter of was used. As kinematic template stars we chose four K and M giants with an intrinsic CO equivalent width in the range 13–15 Å.
Fig. 18 shows the , , and maps of NGC 3489. The kinematics is similar to that of NGC 3368 in some aspects. It is clearly rotating about the minor axis, though stronger than NGC 3368. The velocity dispersion also drops towards the centre by around , but then has a tiny peak in the central bins. The average in the total arcsec2 field of view is . The values clearly anticorrelate with . is on average small and negative. Along the major axis it is positive in the outer bins and negative in the inner bins. No asymmetry is present in , but the velocity is slightly asymmetric. It increases strongly on the receding side and then remains approximately constant at arcsec, whereas on the approaching side the slope is less steep and an approximately constant velocity is reached much further out at arcsec. The major-axis profiles are shown in Fig. 26. Note that the central velocity bin is omitted in that plot. Despite the presence of strong dust features in optical images, the kinematics is in comparatively good agreement with the 2D SAURON (Emsellem et al., 2004) and OASIS (McDermid et al., 2006) kinematics, though due to the high spatial resolution and the very small field of view of our data a direct comparison with seeing-limited data is not easy. The SINFONI velocity field seems to be fully consistent with the optical velocity. The average SINFONI velocity dispersion is smaller than the central SAURON and OASIS . The central SAURON and OASIS is significantly larger than the SINFONI values, and the anticorrelation of and seems to be less strong in general and essentially non-existent in the central arcsecond of the OASIS data.
Longslit kinematics is available from Caon, Macchetto & Pastoriza (2000), who used a cross-correlation technique to determine and . Their is much larger ( in the central pixels of the major-axis longslit), which could be due to their cross-correlation technique or template mismatch. In addition the -profile seems to be slightly asymmetric, but only at large radii, where the errors are large.
3.6 Line Strength Indices for NGC 3489
The stellar populations of NGC 3489 in the centre have been analysed by Sarzi et al. (2005) using optical HST STIS longslit spectra and by McDermid et al. (2006) using OASIS integral-field data. Sarzi et al. (2005) obtained a mean age of about Gyr in the central arcsec by fitting stellar population synthesis models to the spectra, assuming solar metallicity. McDermid et al. (2006) obtained a mean age of Gyr in the central arcsec2 with an age gradient down to Gyr towards the centre from the analysis of Lick indices. These two values are more or less in agreement when taking into account the measurement errors and that the Sarzi et al. (2005) value would decrease when considering the metallicity increase to supersolar values in the centre measured by McDermid et al. (2006). Another possibility is that the central arcsec, which are unresolved by McDermid et al. (2006), contain an older stellar population.
The near-IR absorption-line indices Na I and CO are shown in Fig. 17b. They seem to be, like the stellar kinematics, axisymmetric. As in the case of NGC 3368 there is a clear negative gradient in both indices, which could mean an age or a metallicity gradient, or a combination of both. The other indices, Ca I and Fe I, are largely constant. The average line strength indices within the arcsec2 field of view are given in Table 3. The average CO line strength is very similar to the value found in NGC 3368. All other measured indices are slightly smaller than in NGC 3368. This seems to be generally in agreement with the results of Sarzi et al. (2005), who found similar mean ages and populations in both galaxies. A small central drop is present only in Na I, implying that nuclear activity must be extremely weak or absent.
4 Dynamical Modelling of NGC 3368
For the dynamical modelling we make use of the Schwarzschild (1979) orbit superposition technique: first the gravitational potential of the galaxy is calculated from the stellar luminosity density and trial values for the black-hole mass and the mass-to-light ratio . Then an orbit library is generated for this potential and a weighted orbit superposition is constructed such that it matches the observational constraints. Finally everything is repeated for other potentials until the appropriate parameter space in and is systematically sampled. The best-fitting parameters then follow from a -analysis. The deprojected luminosity density is a boundary condition and thus is exactly reproduced, while the LOSVDs are fitted.
4.1 Construction of the Stellar Luminosity Profile
For dynamical modelling purposes, we need an appropriate surface-brightness profile and an appropriate ellipticity profile, along with an assumption of axisymmetry. While simply using the results of ellipse-fitting may be valid for an elliptical galaxy, where the approximation that the galaxy is a set of nested, axisymmetric ellipsoids with variable axis ratio but the same position angle is often valid, a system like NGC 3368, with two bars, dust lanes, and spiral arms, is clearly more complicated. Such a complex structure also makes it important to allow a gradient in order to account for stellar population changes. This can be conveniently approximated by using more than one component, where each component has its own .
We model the luminosity distribution of NGC 3368 as the combination of two axisymmetric components: a disc with fixed (observed) ellipticity = 0.37, which by design includes both inner and outer bars and the discy pseudobulge; and a central “classical” bulge of variable (but low) ellipticity. Thus, we assume that the bars can, to first order, be azimuthally “averaged away.”
The surface brightness profile of the disc component is not assumed to be a simple exponential. Instead, it is the observed surface brightness profile of the entire galaxy outside the classical bulge, out to arcsec, along with an inward extrapolation to . We base this profile on ellipse fits with fixed ellipticity and position angle (, PA ) to the -band image of Knapen et al. (2003), with the inner arcsec based on the exponential component of our inner bulge-disc decomposition (Fig. 4). (Comparison of profiles from the dust-corrected NICMOS2 image and the Knapen et al. image shows that seeing affects the latter only for arcsec, which is already within the region where the classical bulge affects the profile.) Inspection of both this profile and a similar fixed-ellipse profile from the NICMOS2 image shows that the classical bulge begins to affect the profile only for arcsec. Consequently, the disc profile for arcsec is the inward extrapolation of the exponential component from our inner Sérsic+exponential decomposition (, arcsec; Fig. 4).
To generate the profile of the classical bulge, we assume, following the inner decomposition discussed above, that the light in the inner arcsec is the combination of an inner exponential and the classical bulge (Fig. 4). We generated a model image with the same size as the NICMOS2, containing a 2D exponential model for the inner disc, which we subtracted from the NICMOS2 image. The residual image is assumed to contain light from the classical bulge only; we then fit ellipses to this image. This allows for possible variations in the classical bulge’s ellipticity and, perhaps more importantly, uses the observed surface brightness profile at the smallest radii, rather than an analytic fit. Finally, we generate an extension of this bulge profile out to the same outermost radius as the disc profile (i.e., well outside the NICMOS2 image) by fitting a Sérsic function to the classical-bulge profile, and assuming a constant ellipticity of 0 and the same PA as for the outer disc at large radii.
The program of Magorrian (1999) was used for the deprojection assuming that all components are axisymmetric. Both components, the disc and the classical bulge, were deprojected for an inclination as obtained from the photometry (see §2.3.4), and for a few nearby values between and . No shape penalty was applied. The simplest assumption for the form of the stellar mass density is then , where is the deprojected luminosity density and and two constants to be determined (Davies et al., 2006). The assumption of a constant is approximately true for the central part of the galaxy where we have kinematic data (dark matter does not play a significant role).
As a further test, we deprojected the two components from the global bulge-disc decomposition (i.e. the outer exponential disc and a Sérsic fit to the photometric bulge region, as shown in Fig. 3). The resulting shape of the luminosity profile is very similar to the profile obtained from the inner bulge-disc decomposition of the photometric bulge. The global profile is offset to smaller luminosities, as the global decomposition does not fully account for the light in the classical bulge component. This means that the SMBH mass estimates would be larger for models based on the global bulge-disc decomposition (for constant ) compared to the mass estimate derived from models using the inner bulge-disc decomposition.
4.2 Dynamical Models
As in Nowak et al. (2007, 2008) we use an axisymmetric code (Richstone & Tremaine, 1988; Gebhardt et al., 2000a, 2003; Thomas et al., 2004) to determine the mass of the SMBH in NGC 3368. This method has been successfully tested on the maser galaxy NGC 4258 in Siopis et al. (2009), who obtained the same mass for the black hole as determined from maser emission.
We allow for different mass-to-light ratios in the classical bulge region and the region further out, respectively. Radial changes in the mass-to-light ratio can bias the derived BH mass if not taken into account properly (e.g., Gebhardt & Thomas, 2009).
Using an axisymmetric code for a barred and therefore obviously non-axisymmetric galaxy might be debatable. Thomas et al. (2007) have found that axisymmetric dynamical models of extremely triaxial/prolate systems are in danger of underestimating the luminous mass in the centre. Since BH mass and central luminous mass are partly degenerate, this could result in an overestimate of the BH mass. For two-component models the situation is even more complex. If the triaxiality only affects the outer (as in the case of NGC 3368), then a corresponding underestimation of the outer could translate into an overestimation of the inner , which in turn would imply a bias towards low BH masses. Detailed numerical simulations of barred galaxies are required to investigate such possible biases.
However, in this case the axisymmetric models can be justified as we only model the central part of the galaxy. Near the SMBH the potential is intrinsically spherical and strong non-axisymmetries are unlikely. Also, there is little evidence that non-axisymmetric bar orbits dominate the observed region in projection (see §4.5).
We use only the SINFONI data for the modelling. The four quadrants are modelled separately in order to assess the influence of deviations from axisymmetry. These four independent measurements of the SMBH mass should agree within the observational errors, if the galaxy is axisymmetric. If not, then the systematic differences from quadrant to quadrant provide an estimate for the systematic errors introduced by assuming axial symmetry.
Since the observed ellipticity of the classical bulge is affected by strong dust lanes, the ellipticity is slightly uncertain (see §2.3.1). We ran dynamical models for two different deprojections, one obtained for a bulge ellipticity and the other for . The models yield the same mass-to-light ratios and black hole masses and in the following we only discuss the case .
In order to find out whether the results depend on the assumed inclination of the galaxy, we run models for four different inclinations around the most likely value of .
We do not apply regularisation to our models, because the exact amount of regularisation is difficult to determine due to the lack of realistic, analytical models of disc galaxies with black holes.
The SINFONI observations mainly cover the classical bulge region, so the disc can only be weakly constrained. It could be better constrained if we included other kinematic data extending further out, but this has several disadvantages. The inconsistencies between the SINFONI and the optical measurements from the literature mean that the models could have difficulties fitting the different kinematic datasets reasonably well at the same time. In addition, the non-axisymmetries due to the two bars would be more noticeable at large radii, and a dark halo would become important.
4.3 Results
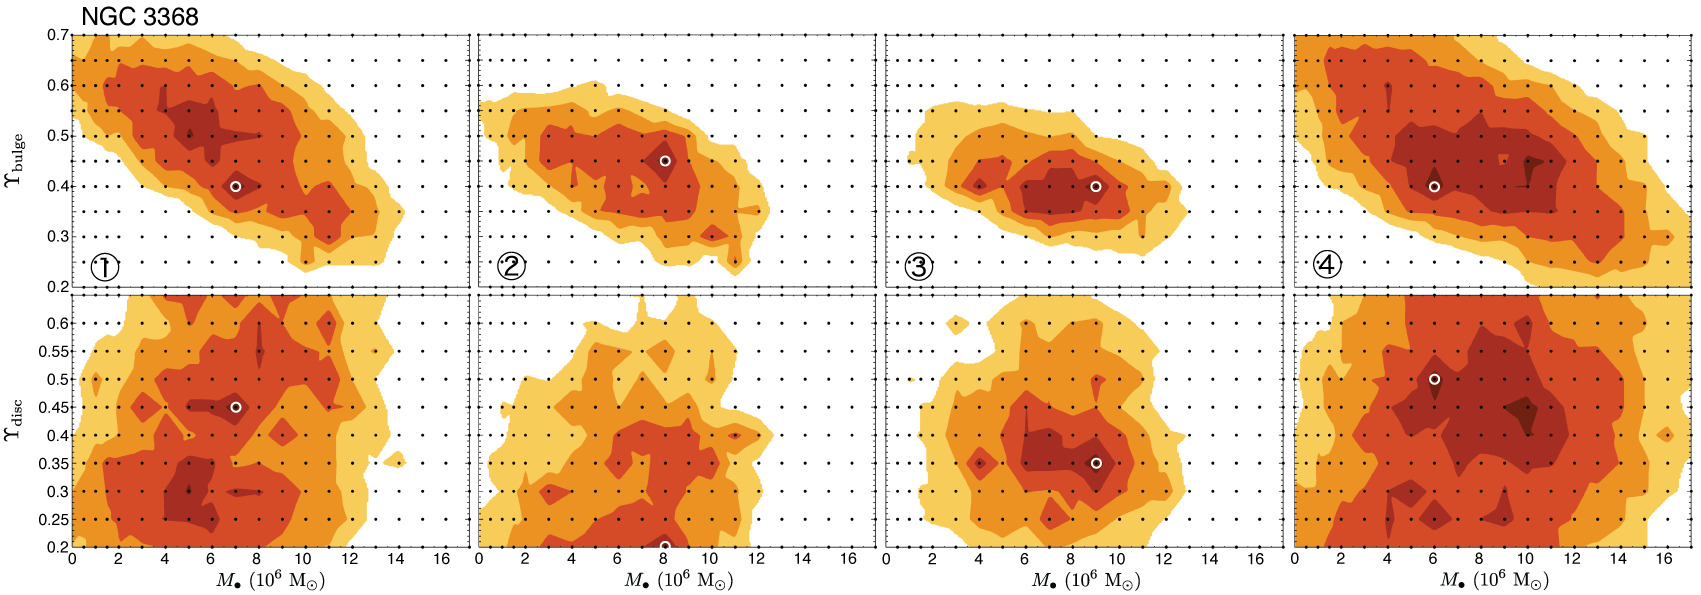
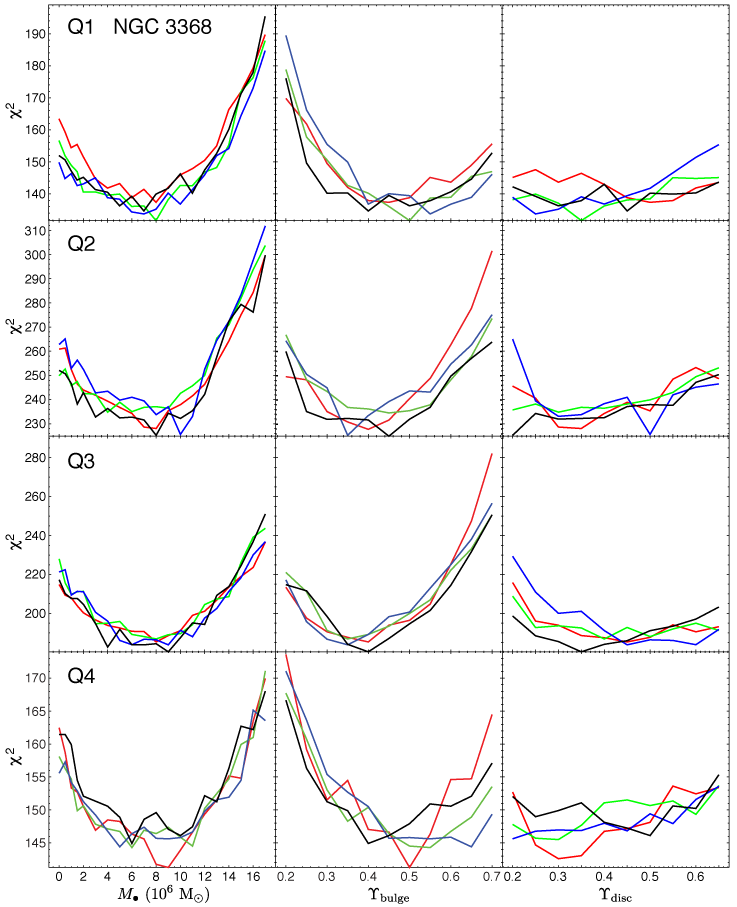
The results for and are shown in Fig. 19 ( as a function of and the of one component, marginalised over the other component’s ), and for all inclinations in Fig. 20 (total as a function of one of the three parameters , , , marginalised over the other two parameters). The best-fitting values with errors are listed in Table 4 for all four inclinations. Each quadrant provides an independent measurement of if deviations from axisymmetry do not play a big role. This seems to be the case, as the resulting best-fitting values for , and agree very well within between the four quadrants. The mean black hole mass for the four quadrants () is M⊙ ( M⊙). Note that the average of all errors given in Table 4 derived from the analysis divided by three is M⊙ and thus approximately equal to the rms error.
The resulting black hole mass does not depend much on the particular choice of the mass-to-light ratio of the disc , but decreases for increasing . As shown in Fig. 20, the results also do not change systematically with the inclination. This shows that the inclination cannot be constrained better by dynamical modelling than by a thorough analysis of photometric data, and that a very precise knowledge of the inclination is not necessary for dynamical modelling purposes.
4.4 Evidence for a black hole in NGC 3368
, , and of the best model at and (major axis) are shown in Fig. 21 for all quadrants. The corresponding best fit without black hole would be very similar, which is why we choose to plot the differences in instead (see below and Fig. 22). The similarity between the black-hole model and the one without black hole in the lower order velocity moments, as well as the -drop towards the centre raise the question where the dynamical evidence for the black hole comes from.
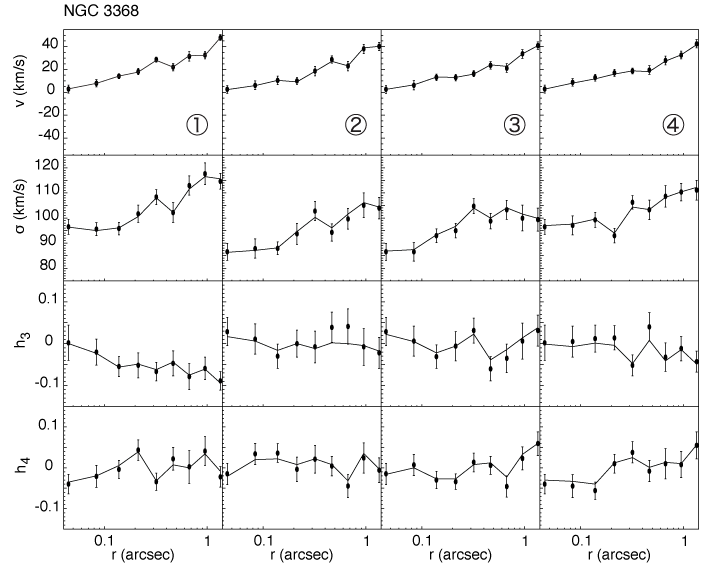
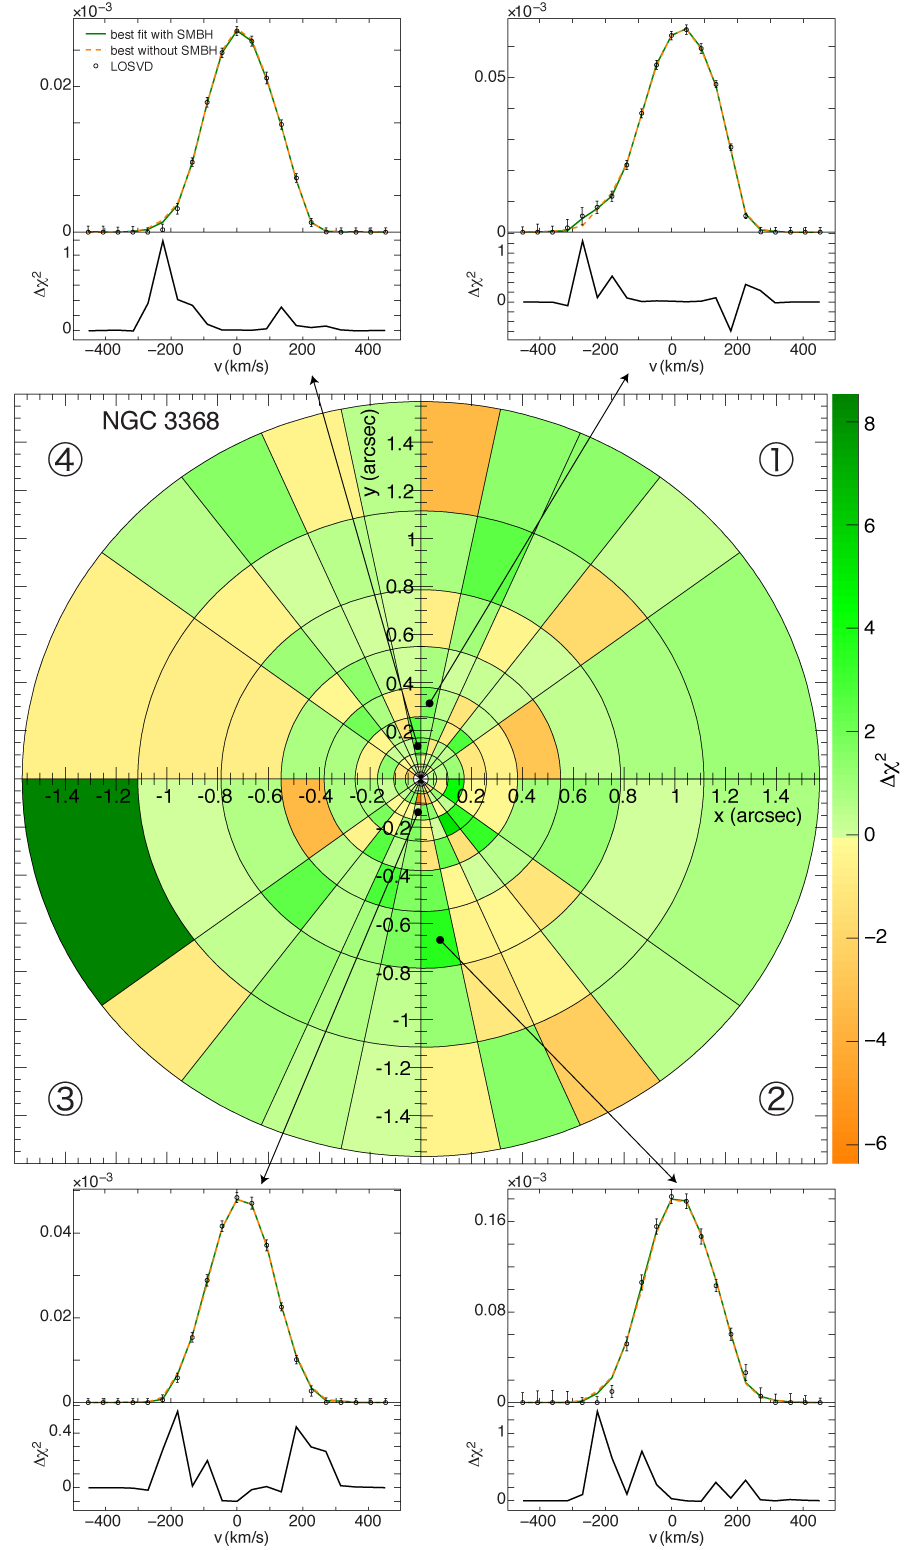
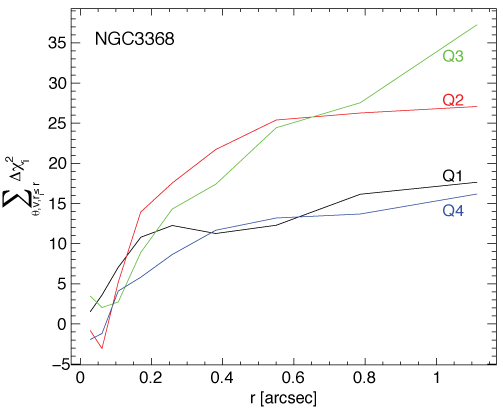
Fig. 22 shows the difference between the best-fitting model without a black hole and the best-fitting model with a black hole for all LOSVDs in all four quadrants. The fit with black hole is generally better in of the bins. The largest differences appear in the LOSVD wings, where the model with black hole gives less residuals. As a different illustration of what is shown in Fig. 22, Fig. 23 shows the increase in summed over all angular and velocity bins as a function of radius. Thus for each quadrant five (angles) times (velocities) values were added at each radius. The largest increase occurs in the central arcsec (i.e. ). At larger radii the increase is less strong. is large for the best models without black hole, which can worsen the fit in the outer data regions. Therefore it is not surprising that improvements of the fit appear at all radii. The total , summed over all LOSVDs, between the best-fitting model without a black hole and the best-fitting model with a black hole is given in the last column of Table 4.
The asymmetry of the data is reflected in the error bars. For quadrants and , which are the quadrants with the higher velocity dispersion, the error bars are much larger than for quadrants and . In and the no-black hole-solution is excluded by , whereas for and it is only excluded by .
| Inclination | Quadrant | [ M⊙] | ||||
|---|---|---|---|---|---|---|
| 1 | 8.0 (3.0, 11.0) | 0.45 (0.30, 0.60) | 0.50 (0.20, 0.65) | 137.353 | 26.093 | |
| 2 | 8.0 (4.0, 10.0) | 0.40 (0.30, 0.45) | 0.35 (0.30, 0.50) | 228.051 | 32.828 | |
| 3 | 8.0 (3.0, 10.0) | 0.40 (0.25, 0.50) | 0.45 (0.25, 0.65) | 185.363 | 29.471 | |
| 4 | 9.0 (1.0, 13.0) | 0.50 (0.30, 0.55) | 0.30 (0.25, 0.65) | 141.261 | 21.207 | |
| 1 | 7.0 (1.5, 11.0) | 0.40 (0.30, 0.65) | 0.45 (0.20, 0.65) | 134.681 | 17.285 | |
| 2 | 8.0 (3.0, 10.0) | 0.45 (0.25, 0.50) | 0.20 (0.20, 0.40) | 225.221 | 26.828 | |
| 3 | 9.0 (4.0, 10.0) | 0.40 (0.35, 0.45) | 0.35 (0.25, 0.50) | 180.291 | 36.955 | |
| 4 | 6.0 (1.5, 14.0) | 0.40 (0.25, 0.65) | 0.50 (0.20, 0.65) | 144.920 | 16.538 | |
| 1 | 8.0 (2.0, 11.0) | 0.50 (0.35, 0.60) | 0.35 (0.20, 0.50) | 131.651 | 25.002 | |
| 2 | 4.0 (1.0, 11.0) | 0.45 (0.30, 0.55) | 0.30 (0.20, 0.55) | 234.792 | 15.106 | |
| 3 | 8.0 (3.0, 11.0) | 0.35 (0.30, 0.45) | 0.40 (0.25, 0.65) | 186.925 | 41.063 | |
| 4 | 6.0 (1.0, 14.0) | 0.55 (0.30, 0.70) | 0.30 (0.20, 0.65) | 144.291 | 13.807 | |
| 1 | 7.0 (0.5, 12.0) | 0.55 (0.40, 0.65) | 0.25 (0.20, 0.50) | 133.730 | 16.099 | |
| 2 | 10.0 (8.0, 11.0) | 0.35 (0.35, 0.40) | 0.50 (0.30, 0.50) | 225.629 | 37.159 | |
| 3 | 9.0 (4.0, 11.0) | 0.35 (0.25, 0.40) | 0.45 (0.40, 0.65) | 183.933 | 37.418 | |
| 4 | 5.0 (0.0, 15.0) | 0.65 (0.30, 0.70) | 0.20 (0.20, 0.65) | 144.406 | 11.170 |
4.5 Discussion
Upper limits for in NGC 3368 have been measured from central emission-line widths by Sarzi et al. (2002) and Beifiori et al. (2009), who obtain M⊙ (stellar potential included) and M⊙ (stellar potential not included), respectively. Based on the - relation of Tremaine et al. (2002), a black hole with a mass between and M⊙ would have been expected, depending on which measurement is used. From the relation between and -band luminosity (Marconi & Hunt, 2003) we would have expected a very high black-hole mass of M⊙ if it correlates with the total (photometric) bulge luminosity (), or a very small mass of only M⊙ if it correlates with the classical bulge luminosity ().
The stellar mass within the sphere of influence arcsec is M⊙. If the best-fitting mass for the black hole of M⊙ were entirely composed of stars, the mass-to-light ratio within would increase to . This would be typical for an older stellar population (– Gyr for a Salpeter IMF and – Gyr for a Kroupa IMF at solar metallicity, using the models of Maraston 1998, 2005). However, this would strongly conflict with Sarzi et al. (2005), who find that a Gyr old population dominates, with some contributions from older and younger populations, resulting in a mean age of 3 Gyr.
As mentioned in §4.2, bar orbits crossing the centre could in principle produce deviations from axisymmetry. Non-axisymmetric structures such as a prolate central structure can be recognised in the kinematics as a low-, high- region if seen edge-on, or as a high-, low- region if seen face-on (Thomas et al., 2007). This could also bias the reconstructed masses. Strictly speaking, this is only valid for N-body ellipticals with a central prolate structure. Simulations of bars by Bureau & Athanassoula (2005) resulted in variable and , depending on the projection of the bar. However, these variations were always symmetric with respect to the bar. Thus we would expect symmetry between quadrants where the bar appears. This is not the case, therefore it is unlikely that bar orbits in projection disturb the central kinematics significantly.
Dust could in principle influence the kinematics and produce distortions or asymmetries, though no clear correlation with the dust distribution could be found in §3.2. According to Baes et al. (2003), however, dust attenuation should not affect moderately inclined galaxies significantly.
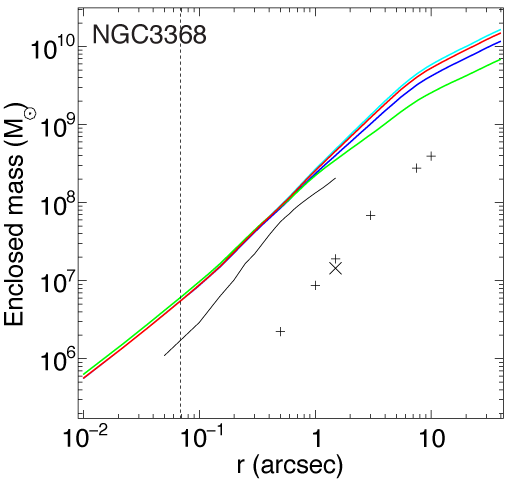
The mass of the hot H2 in the clouds and in the total field of view was estimated via (Rodríguez-Ardila et al., 2005) and the total cold gas mass via (Mueller Sánchez et al., 2006), where is the distance of the galaxy in Mpc, is the H2 () flux and is the H2 () luminosity. They are listed in Table 2. Note that the latter conversion has large uncertainties and that the ratio spans at least two orders of magnitude (–). In addition, depends on the far-infrared colour (Dale et al., 2005), which may help to place tighter constraints on the ratio. With a far-IR colour of (Sakamoto et al., 1999) the ratio would be approximately . This is consistent with the ratio of obtained using the Mueller Sánchez et al. (2006) conversion, considering that both estimates have large uncertainties. A more precise way to constrain the cold H2 masses is by more direct measurements of CO () emission in the millimeter range. Helfer et al. (2003) measured a peak molecular surface density (i.e. the peak from the arcsec beam size) of M⊙ pc-2. Over a arcsec aperture a total gas mass of approximately M⊙ would then be expected. Sakamoto et al. (1999) ( arcsec beam size) report a molecular mass of M⊙ ( M⊙ when using the CO-to-H2 conversion factor of Helfer et al. 2003) within a 15 arcsec diameter aperture. Fig. 24 shows the measured gas mass distribution compared to (1) the dynamical mass distribution and (2) the gas masses obtained from CO () measurements. We used figure 2 and equation 1 of Sakamoto et al. (1999) with the CO-to-H2 conversion factor of Helfer et al. (2003) to estimate the gas mass distribution at smaller radii. Within a arcsec diameter aperture the gas masses from Sakamoto et al. (1999) and Helfer et al. (2003) agree very well. This shows that we overestimated the cold gas mass traced by hot H2 by a factor of when using the conversion of Mueller Sánchez et al. (2006). When comparing the gas mass profile (calibrated to match the gas mass at arcsec derived from CO) with the dynamical mass, we find that within a arcsec aperture the gas is approximately of the dynamical mass. At smaller radii this fraction is even lower, as the gas mass profile is steeper than the dynamical mass profile. The gas mass distribution in quadrants and is larger by a factor than in quadrants and . However, due to the small total mass we do not expect that the irregular gas distribution has a large influence on the stellar kinematics and it is unlikely the cause for the asymmetry in the stellar kinematics; it might, however, be related to whatever is responsible for the latter.
Concerning the results of the black hole mass measurement, the gas mass has no significant influence. As the gas mass distribution has a similar radial profile as the stellar mass, our likely includes the gas mass, such that the true stellar mass-to-light ratio is maybe slightly lower than our nominal . But this is not a serious problem for the modelling. However, the fact that the gas is not evenly distributed and the clouds already have a mass of order M⊙ each, can weaken the evidence for the presence of a black hole, as it would imply that the centre is slightly out of equilibrium.
5 Dynamical Modelling of NGC 3489
5.1 Construction of the Luminosity Profile for Modelling
Given the apparent similarity of NGC 3489’s inner structure to that of NGC 3368 (modulo the presence of a secondary bar in NGC 3368), including the strong isophotal twist created by the bar in NGC 3489, we followed a similar strategy for constructing the luminosity profiles. That is, we divide the galaxy into separate disc (which includes the discy pseudobulge) and central classical bulge components, with the disc treated as having a constant observed ellipticity of 0.41. The disc surface brightness profile is an azimuthal average with fixed ellipticity down to arcsec, with the profile at smaller radii being the extrapolated inner-exponential fit from Fig. 9.
The classical bulge profile is the result of a free-ellipse fit to the inner-disc-subtracted WFPC2 F814W image. The latter was created by generating a model disc with ellipticity = 0.41 and profile matching the exponential part of the fit in Fig. 9 (scale length = 4.9 arcsec), and then subtracting it from the dust-corrected PC image.
The deprojection was done in the same way as for NGC 3368 for bulge and disc component separately.
5.2 Dynamical Models
NGC 3489 has only a weak large-scale bar and no nuclear bar. The measured kinematics and line indices are largely symmetric apart from the asymmetry in . Thus non-axisymmetries are not expected to play a role as big as in NGC 3368. We first use only SINFONI data to model all four quadrants separately. However, we expect that, as for NGC 3368, due to the small field of view of the SINFONI data it will be difficult to constrain , as the data cover only that part of the galaxy where the classical bulge dominates. Thus we try to constrain beforehand by modelling SAURON and OASIS data alone. As the SAURON data have a large field of view including the bar, we use just the inner arcsec for that purpose. Finally, we model the combined SINFONI plus OASIS and/or SAURON dataset.
We do not calculate models for different inclinations, as the inclination is well determined from the photometry (). As shown for NGC 3368 in the previous section, the inclination cannot be constrained better via dynamical modelling and the differences within a small inclination range of a few degrees are small (see Tab. 4 and Fig. 20).
5.3 The stellar mass-to-light ratio of the disc
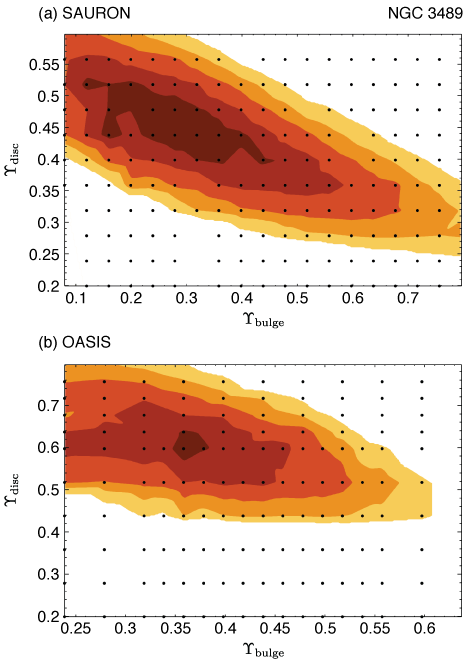
In order to constrain we first calculate models using symmetrised SAURON and OASIS kinematics separately. We only calculate models with for the SAURON data, but vary between and M⊙ for the OASIS data. Fig. 25a shows as a function of and for the SAURON models. is well constrained, but in a very large range between and is possible. This is due to the fact that the classical bulge is only just resolved with SAURON ( arcsec, SAURON spatial resolution arcsec). The best-fitting model has and . For the OASIS models (Fig. 25b) the resulting is higher, which could be a result of the higher of the OASIS data compared to SAURON. Due to the higher spatial resolution ( arcsec), is better constrained. The best-fitting model has and . It is not possible to constrain with the OASIS data alone (see Fig. 28).
5.4 The black hole mass
To derive the mass of the SMBH we first use the SINFONI kinematics alone to model the four quadrants separately. We chose a few values for around . The results with the corresponding errors are given in Table 5. The mean black hole mass for the four quadrants is M⊙ (rms() M⊙). clearly anticorrelates with , but as in the case of NGC 3368 it does not depend on the specific choice of . The mean black hole mass for any fixed is consistent with the result for any other within .
The error bars are large, such that a wide range of black hole masses is allowed. A solution without black hole is allowed in three quadrants within and in one quadrant even within . Thus there is no evidence for the presence of a SMBH in one quadrant, and only weak evidence in the others, when modelling the SINFONI data alone. The fit of the best model in each quadrant to , , and along the major axis is shown in Fig. 26.
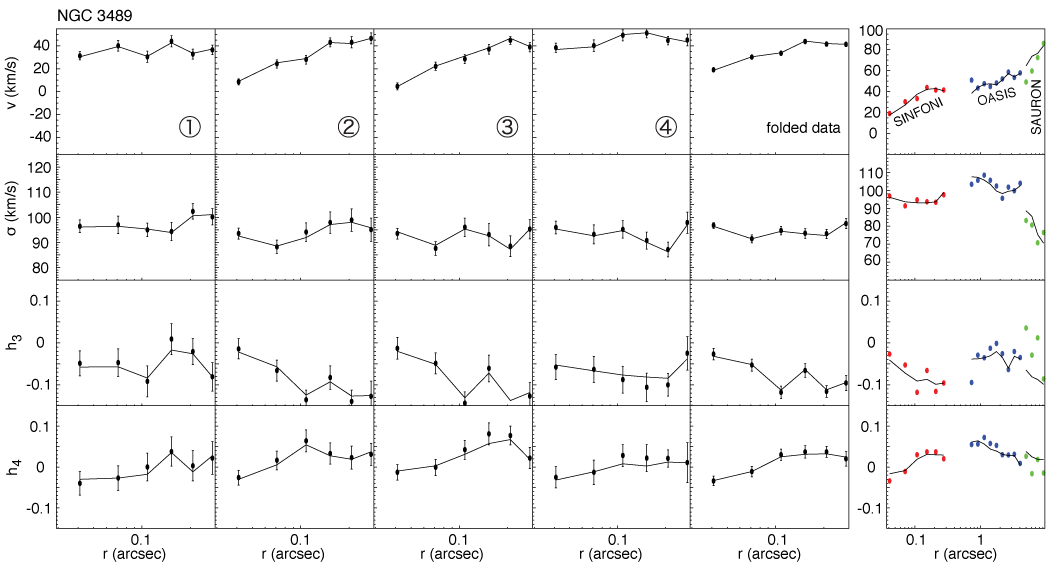
The resulting , and of the four quadrants agree with each other within , and as there are also no obvious strong inconsistencies between the kinematics of the quadrants, we fold the LOSVDs of the four quadrants (the LOSVDs of quadrants 1 and 4 were also flipped, such that and change sign). For the folded data we find a best-fitting black hole mass of M⊙ at . This is in good agreement with the results of the individual quadrants. A solution without black hole is allowed within , thus as a conservative result we can only give a upper limit of M⊙ for the SMBH in NGC 3489, when using just the SINFONI data.
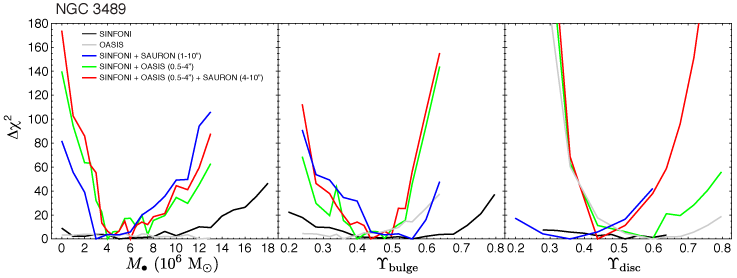
The non-dependence of on can be explained by the very small field of view of the SINFONI data, which covers only the very central part of the galaxy, dominated by the classical bulge. This might also explain the relatively weak detection of a SMBH in NGC 3489 despite the high quality data. It therefore seems reasonable to include kinematics at larger radii, like the SAURON or the OASIS kinematics, as these datasets cover a large fraction of the disc and therefore are able to constrain very well, as shown above. We should keep in mind however, that the SAURON and OASIS velocity dispersions do not fully agree with each other, are larger than the SINFONI dispersion and show some deviations from axisymmetry, which might possibly be due to the strong dust features. In order to determine how strong these differences affect the result of the modelling we do three sets of models: the first one with SINFONI and OASIS data (using OASIS data between arcsec and 4 arcsec), the second one with SINFONI and SAURON data (using SAURON data between arcsec and 10 arcsec) and the third one with all three datasets (with OASIS data between arcsec and 4 arcsec and SAURON data between 4 arcsec and 10 arcsec).
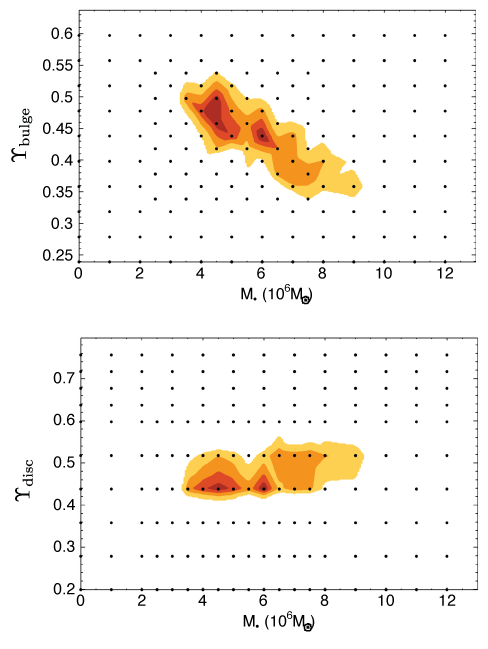
Fig. 27 shows the resulting contours for the combined SINFONI, OASIS and SAURON data. The error contours are very narrow and both and are very well constrained. Fig. 28 shows the resulting profiles for all data combinations we used. It is clear that the mass of the black hole can be much better constrained when including SAURON and/or OASIS data. The constraints on and are also much stronger in these cases. Using SAURON data in addition to SINFONI and OASIS does not seem to improve the measurement of and . The scatter in the profiles is quite large for the models of the combined datasets, despite the good quality and high S/N of the individual datasets and despite the comparatively small scatter in the models of individual datasets. The uncertainties of the SMBH mass measurement therefore do not seem to be dominated by statistical errors, but instead by systematics. Systematic errors can be introduced e.g. due to the differences in the kinematics of the individual datasets. Systematic errors in the modelling (e.g. slightly different results for different quadrants) could add to the scatter as well, but are difficult to quantify. We measure the formal errors (corresponding to for one degree of freedom) by fitting a third order polynomial to each curve in Fig. 28. The best values for , and given in Table 6 refer to the minimum of the fit and the associated region. We then determine the systematic error, introduced by the differences between the datasets, from the scatter of the best fits for models with combined datasets. Thus when using all available data, we obtain a black hole mass of M⊙, a bulge mass-to-light ratio and a disc mass-to-light ratio .
5.5 Evidence for a black hole in NGC 3489
In order to illustrate where the influence of the black hole is largest, Fig. 29 shows the difference between the best-fitting model without a black hole and the best-fitting model with a black hole for all LOSVDs of the combined SINFONI+OASIS+SAURON dataset. The fit with black hole is generally better in 80% of all bins. Along the major axis the largest differences appear in the LOSVD wings, both at negative and positive velocities. Improvements of the fit appear at all radii.
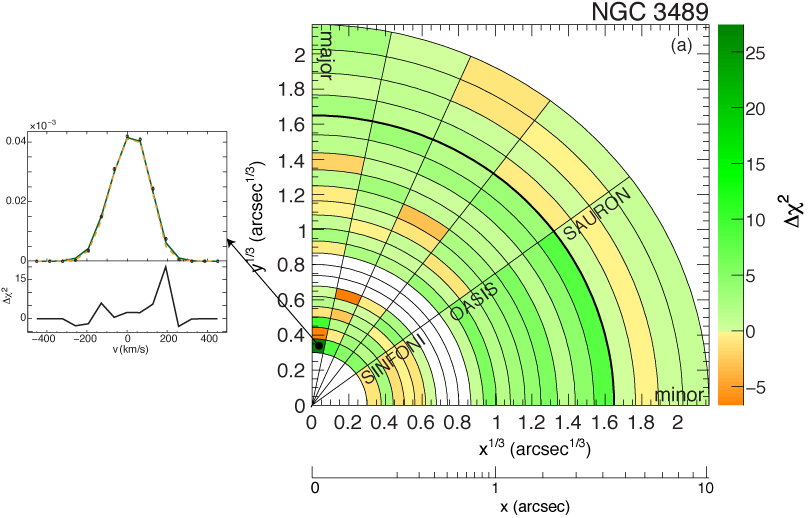
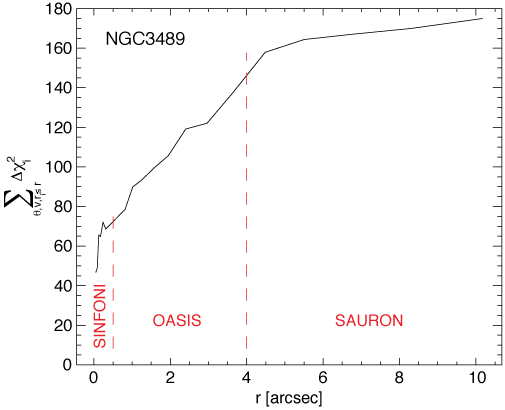
Fig. 30 shows summed over all angles and velocities as a function of radius. The increase is steepest in the region covered by the SINFONI data (, mostly coming from the region arcsec, corresponding to ). It then grows by about the same amount in the region of the OASIS data ( arcsec). At larger radii (region of the SAURON data) the increase is only small.
Although with the OASIS data alone it is not possible to constrain the mass of the SMBH, the region covered by this dataset ( arcsec) seems to be crucial for the lower limit on , which is not possible to derive with the SINFONI data alone. This means that differences between models without black hole and models with black hole (say, M⊙) should not only appear within the sphere of influence, but also further outside. This should not be surprising. For example, some of the effects of a central mass concentration in an isotropic system can be mimicked in a system without such a concentration by enhanced radial anisotropy (e.g., Binney & Mamon, 1982). In such a case, the region where radial anistropy is required extends well outside the nominal sphere of influence of the central mass. Only in cases where the best-fit model without a black hole has exactly the same orbital structure as the best-fit model with the black hole would differences between the fits be (roughly) confined to the sphere of influence. This is in agreement with the observations in NGC 3368, Fornax A and NGC 4486a (Nowak et al., 2007, 2008), where a general improvement of the fit even outside the sphere of influence, was observed.
The total , summed over all LOSVDs, between the best-fitting model without a black hole and the best-fitting model with a black hole is given in the last column of Table 6.
5.6 Discussion
No attempts have been made in the literature to measure the mass of the SMBH in NGC 3489. From the - relation of Tremaine et al. (2002) we would expect a mass between M⊙ for derived from the SAURON data (Emsellem et al., 2004) and M⊙ for derived from the OASIS data (McDermid et al., 2006). From the relation between and -band magnitude (Marconi & Hunt, 2003) we would expect a black-hole mass of M⊙ if it correlates with the total (photometric) bulge magnitude , or M⊙ if it correlates with the classical bulge magnitude only.
The stellar population models of Maraston (1998, 2005) suggest an age of Gyr for the best-fitting and a high metallicity [Z/H], and an age of Gyr for a solar metallicity population (assuming a Salpeter IMF). This is in agreement with McDermid et al. (2006), who find both an age gradient (from Gyr in the outer regions to Gyr in the centre) and a metallicity gradient (from solar in the outer regions to in the centre). It is also compatible with Sarzi et al. (2005), who found a mean age of Gyr assuming solar metallicity. The stellar mass within arcsec is M⊙. If the best-fitting mass for the black hole of M⊙ were entirely composed of stars, the mass-to-light ratio would increase to . This would be typical for an older stellar population ( Gyr for a high metallicity [Z/H]=0.67 and a Salpeter IMF), and therefore conflict with the values found by Sarzi et al. (2005) and McDermid et al. (2006).
| Quadrant | [ M⊙] | ||||
|---|---|---|---|---|---|
| 1 | 4.0 (0.0, 8.0) | 0.60 (0.44, 0.76) | 0.36 (0.28, 0.64) | 106.812 | 3.289 |
| 2 | 1.0 (0.0, 7.0) | 0.60 (0.44, 0.80) | 0.60 (0.28, 0.64) | 100.554 | 0.301 |
| 3 | 6.0 (0.0, 13.0) | 0.48 (0.28, 0.72) | 0.52 (0.28, 0.64) | 57.612 | 10.487 |
| 4 | 6.0 (1.0, 10.0) | 0.52 (0.36, 0.64) | 0.32 (0.28, 0.64) | 80.077 | 16.786 |
| folded | 5.0 (0.0, 13.0) | 0.56 (0.28, 0.72) | 0.52 (0.28, 0.64) | 47.877 | 9.060 |
| [ M⊙] | |||||
|---|---|---|---|---|---|
| SINFONI | 5.97 (3.64, 8.13) | 0.53 (0.48, 0.58) | 0.55 (0.48, 0.62) | 106.812 | 3.289 |
| SINFONI + SAURON() | 4.56 (4.03, 5.12) | 0.52 (0.50, 0.54) | 0.36 (0.32, 0.40) | 368.458 | 81.83 |
| SINFONI + OASIS() | 5.81 (5.21, 6.46) | 0.46 (0.44, 0.48) | 0.52 (0.50, 0.55) | 551.297 | 139.86 |
| SINFONI + OASIS() + SAURON () | 6.00 (5.46, 6.56) | 0.45 (0.43, 0.47) | 0.47 (0.45, 0.48) | 606.653 | 173.86 |
6 Summary and Discussion
We analysed near-IR integral-field data for two barred galaxies that host both a pseudobulge and a classical bulge component. Both galaxies show fast and regular rotation and a -drop at the centre, which in the case of NGC 3368 is more pronounced and may have developed from gas, transported to the inner region by the bars and spiral arms. The kinematics of NGC 3368 – in particular the velocity dispersion – is asymmetric. The reasons for that could be dust or (less likely) the non-axisymmetric potential induced by the two bars. The gas distribution is also inhomogeneous, but as the total gas mass accounts for only of the dynamical mass, this has probably no significant influence on the stellar kinematics. There are two kinematically decoupled gas clouds located a few tens of parsecs north of the centre. Each cloud has a total mass of order M⊙. The stellar kinematics of NGC 3489 is very regular, with a slight asymmetry in the velocity field. All other kinematic parameters and the line indices are consistent with axisymmetry. No gas emission was found in NGC 3489. The near-IR line indices Na I and CO show a negative gradient in both galaxies, indicating an age and/or metallicity gradient.
We applied axisymmetric dynamical models to derive the SMBH masses in NGC 3368 and NGC 3489. In our models we assume that the galaxy potential can be decomposed into three components: the central black hole, an inner, classical bulge (with mass-to-light ratio ) and the disc (); the disc component includes the pseudobulge. The inclination of the models is fixed by the isophotes of the outer disc. For NGC 3368 we modelled the four quadrants of our IFU data independently and the resulting black hole masses and mass-to-light ratios agree very well. We find that is largely independent of and anticorrelates with . The average black hole mass for the four quadrants and an inclination is M⊙ (rms() M⊙). A solution without a black hole is excluded by –. The errors, however, cover a large range in . The largest uncertainty for comes from the unknown , and independent constraints, e.g. from stellar population modelling, would likely improve the results. However, unless the shape of the IMF is known, mass-to-light ratios from stellar population analyses are ambiguous. The scatter from quadrant to quadrant is smaller than the uncertainty related to , suggesting that the symmetry assumption plays a minor role for the uncertainty of . Our results do not significantly depend on the inclination (within the photometrically allowed inclination range).
For NGC 3489, modelling of the four SINFONI quadrants likewise gave consistent black hole masses and mass-to-light ratios. Similar to NGC 3368 the errors in are large, the black hole mass is independent of and it clearly anticorrelates with . Modelling the folded SINFONI data gives the same result as for the individual quadrants; thus, non-axisymmetries do not seem to play a role. When including OASIS and/or SAURON data, and therefore also could be much better constrained. Using all three datasets, we derived for NGC 3489 a SMBH mass of M⊙ with a bulge mass-to-light ratio of and a disc mass-to-light ratio . A solution without a black hole is excluded with high significance. To derive a firm lower limit to , data between arcsec seem to be crucial, in addition to the high-resolution SINFONI data in the centre. With OASIS data alone, no limits on could be placed. There are some inconsistencies in the kinematics between the three datasets, which seem to be the main source of systematic errors. In particular when modelling OASIS data alone, we get a higher than if modelling SAURON data alone (because the inner is higher in the OASIS data than in the SAURON data).
The implications for the - relation and the - relation are illustrated in Fig. 31. For NGC 3368 the mean of the four quadrants and the rms, and for NGC 3489 from the combination of SINFONI, SAURON and OASIS data with its statistical error is plotted against and using the relations of Tremaine et al. (2002), Ferrarese & Ford (2005), Marconi & Hunt (2003) and Graham (2007). All values for and were measured using the effective radius of the total photometric bulge, as was done for all the galaxies contributing to the Tremaine et al. (2002) and Ferrarese & Ford (2005) relations. No attempt to determine for the classical components has therefore been made, but as we use luminosity-weighted measurements, all values determined from high-resolution data represent mostly the classical bulge.
The agreement of NGC 3368 with the - relation largely depends on the value of which is used. The small measured within the SINFONI field of view is in good agreement with the - relation. When combining the SINFONI with measurements of Whitmore, Schechter & Kirshner (1979), Héraudeau et al. (1999) and Vega Beltrán et al. (2001) a value of is obtained. The velocity dispersions from the literature alone however (e.g. estimated by Sarzi et al. 2002, respectively measured by Héraudeau et al. 1999, or by Moiseev et al. 2004) are significantly larger than expected by this estimate and not or only marginally in agreement with the - relation. With a -band magnitude of for the total photometric bulge, NGC 3368 falls far (a factor of ) below the - relation of Marconi & Hunt (2003). If we postulate that the SMBH only correlates with the magnitude of the classical bulge, the situation improves. With NGC 3368 now lies a factor of above the - relation of Marconi & Hunt (2003), but is in good agreement with the - relation of Graham (2007).
For NGC 3489 the situation is similar. is in excellent agreement with the - relation when using either the SINFONI mean or the SAURON values and . It is still in reasonably good agreement with the relation when using the OASIS measurements ( , ) or when taking into account other measurements from the literature ( using Whitmore et al. 1979; Dalle Ore et al. 1991; Smith et al. 2000; Barth et al. 2002 and the SINFONI value). With a -band magnitude of the total photometric bulge of NGC 3489 also falls far below the - relation of Marconi & Hunt (2003) and Graham (2007), but is in excellent agreement if the magnitude of the classical bulge component is considered ().
The large difference in the measurements makes it difficult to draw any firm conclusion with respect to the location of pseudobulges in the - relation, and at the same time illustrates that measurement errors in may play a larger role than one may have thought, in particular when dealing with small galaxy samples. NGC 3368 would fall far below the - relation when optical longslit kinematics alone are used. These discrepancies between the measurements might at least partly be due to dust, which affects the optical data much more than the near-IR data.
The -band magnitudes on the other hand can be determined very accurately even for subcomponents of the galaxy. Taken at face value, both galaxies clearly do not follow the - relation of Marconi & Hunt (2003) when considering the -band magnitudes of the total photometric bulge, but are in better (NGC 3368) or even excellent (NGC 3489) agreement with it when considering the classical bulge magnitude only.
If we take into account that a stellar population becomes fainter when it ages passively ( mag in band for a solar metallicity population between and Gyr, based on the stellar population models of Maraston 1998, 2005), the pseudobulges would move toward the - relation with time. Given the uncertainties on the age estimate, the exact size of the effect is unclear. Keeping in mind this caveat, this is in line with Greene et al. (2008), who conclude that pseudobulges follow the - relation, but not the - relation, as well as with Gadotti & Kauffmann (2009), who find that pseudobulges follow only one of the two relations, if any. In order to strengthen our results, studies of a larger sample of pseudobulges similar in design are necessary.
Whether modelling single quadrants of obviously non-axisymmetric galaxies with an axisymmetric code is a good approximation and gives the correct black hole masses is certainly still an issue that remains to be resolved. The recently developed triaxial codes of de Lorenzi et al. (2007) and van den Bosch et al. (2008) will have the potential to solve this issue in the future.
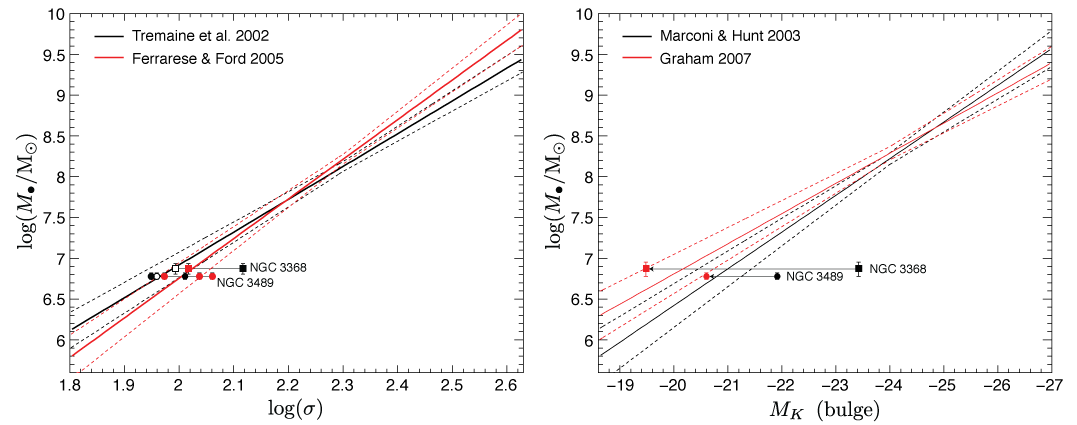
Acknowledgments
We would like to thank the Paranal Observatory Team for support during the observations. We are grateful to Harald Kuntschner and Mariya Lyubenova for providing us the code to measure near-IR line indices, and to Karl Gebhardt for providing the MPL code. Furthermore we thank Alexei Moiseev and Richard McDermid for providing us their 2D kinematics on NGC 3368 and NGC 3489. We would also like to thank Maximilian Fabricius, Roland Jesseit and Erin Hicks for valuable discussions. Finally we would like to thank the referee Eric Emsellem for his critical comments which helped us to improve the manuscript. This work was supported by the Cluster of Excellence: “Origin and Structure of the Universe” and by the Priority Programme 1177 “Galaxy Evolution” of the Deutsche Forschungsgemeinschaft.
References
- Abuter et al. (2006) Abuter R., Schreiber J., Eisenhauer F., Ott T., Horrobin M., Gillessen S., 2006, New Astronomy Review, 50, 398
- Athanassoula (2005) Athanassoula E., 2005, MNRAS, 358, 1477
- Baes et al. (2003) Baes M., et al., 2003, MNRAS, 343, 1081
- Barberà et al. (2004) Barberà C., Athanassoula E., García-Gómez C., 2004, A&A, 415, 849
- Barth et al. (2002) Barth A. J., Ho L. C., Sargent W. L. W., 2002, AJ, 124, 2607
- Barth et al. (2001) Barth A. J., Sarzi M., Rix H.-W., Ho L. C., Filippenko A. V., Sargent W. L. W., 2001, ApJ, 555, 685
- Beifiori et al. (2009) Beifiori A., Sarzi M., Corsini E. M., Bontà E. D., Pizzella A., Coccato L., Bertola F., 2009, ApJ, 692, 856
- Bender et al. (2005) Bender R., et al., 2005, ApJ, 631, 280
- Bender et al. (1994) Bender R., Saglia R., Gerhard O., 1994, MNRAS, 269, 785
- Binney & Mamon (1982) Binney J., Mamon G. A., 1982, MNRAS, 200, 361
- Bonaccini et al. (2002) Bonaccini D., et al., 2002, in Tyson R. K., Bonaccini D., Roggemann M. C., eds, Adaptive Optics Systems and Technology II, Proc. SPIE, Vol. 4494, p. 276
- Bonnet et al. (2004) Bonnet H., et al., 2004, ESO Messenger, 117, 17
- Bournaud et al. (2005) Bournaud F., Combes F., Jog C. J., Puerari I., 2005, A&A, 438, 507
- Bureau & Athanassoula (2005) Bureau M., Athanassoula E., 2005, ApJ, 626, 159
- Caon et al. (2000) Caon N., Macchetto D., Pastoriza M., 2000, ApJS, 127, 39
- Cappellari & Copin (2003) Cappellari M., Copin Y., 2003, MNRAS, 342, 345
- Carollo et al. (1997) Carollo C. M., Franx M., Illingworth G. D., Forbes D. A., 1997, ApJ, 481, 710
- Cesetti et al. (2009) Cesetti M., et al., 2009, A&A, 497, 41
- Comerón et al. (2008) Comerón S., Knapen J. H., Beckman J. E., 2008, A&A, 485, 695
- Dale et al. (2005) Dale D. A., Sheth K., Helou G., Regan M. W., Hüttemeister S., 2005, AJ, 129, 2197
- Dalle Ore et al. (1991) Dalle Ore C., Faber S. M., Jesus J., Stoughton R., Burstein D., 1991, ApJ, 366, 38
- Davies et al. (2006) Davies R. I., et al., 2006, ApJ, 646, 754
- Davies et al. (2007) Davies R. I., Mueller Sánchez F., Genzel R., Tacconi L. J., Hicks E. K. S., Friedrich S., Sternberg A., 2007, ApJ, 671, 1388
- de Lorenzi et al. (2007) de Lorenzi F., Debattista V. P., Gerhard O., Sambhus N., 2007, MNRAS, 376, 71
- de Lorenzo-Cáceres et al. (2008) de Lorenzo-Cáceres A., Falcón-Barroso J., Vazdekis A., Martínez-Valpuesta I., 2008, ApJ, 684, L83
- Drory & Fisher (2007) Drory N., Fisher D. B., 2007, ApJ, 664, 640
- Eisenhauer et al. (2003) Eisenhauer F., et al., 2003, in Iye M., Moorwood A., eds, Instrument Design and Performance for Optical/Infrared Ground-based Telescopes, Proc. SPIE, Vol. 4841, p. 1548
- Emsellem et al. (2004) Emsellem E., et al., 2004, MNRAS, 352, 721
- Erwin (2004) Erwin P., 2004, A&A, 415, 941
- Erwin (2008) Erwin P., 2008, in Formation and Evolution of Galaxy Bulges, Proc. IAU Symposium 245, p. 113
- Erwin et al. (2003) Erwin P., Beltrán J. C. V., Graham A. W., Beckman J. E., 2003, ApJ, 597, 929
- Erwin et al. (2008) Erwin P., Pohlen M., Beckman J. E., 2008, AJ, 135, 20
- Erwin & Sparke (1999) Erwin P., Sparke L. S., 1999, ApJ, 521, L37
- Erwin & Sparke (2003) Erwin P., Sparke L. S., 2003, ApJS, 146, 299
- Ferrarese & Ford (2005) Ferrarese L., Ford H., 2005, Space Science Reviews, 116, 523
- Ferrarese & Merritt (2000) Ferrarese L., Merritt D., 2000, ApJ, 539, L9
- Frei et al. (1996) Frei Z., Guhathakurta P., Gunn J. E., Tyson J. A., 1996, AJ, 111, 174
- Gadotti & Kauffmann (2009) Gadotti D. A., Kauffmann G., 2009, MNRAS, 399, 621
- Gebhardt et al. (2000a) Gebhardt K., et al., 2000a, AJ, 119, 1157
- Gebhardt et al. (2000b) Gebhardt K., et al., 2000b, ApJ, 539, L13
- Gebhardt et al. (2003) Gebhardt K., et al., 2003, ApJ, 583, 92
- Gebhardt et al. (2007) Gebhardt K., et al., 2007, ApJ, 671, 1321
- Gebhardt & Thomas (2009) Gebhardt K., Thomas J., 2009, ApJ, 700, 1690
- Gerhard (1993) Gerhard O., 1993, MNRAS, 265, 213
- Graham (2007) Graham A. W., 2007, MNRAS, 379, 711
- Greene et al. (2008) Greene J. E., Ho L. C., Barth A. J., 2008, ApJ, 688, 159
- Haan et al. (2009) Haan S., Schinnerer E., Emsellem E., García-Burillo S., Combes F., Mundell C. G., Rix H.-W., 2009, ApJ, 692, 1623
- Haan et al. (2008) Haan S., Schinnerer E., Mundell C. G., García-Burillo S., Combes F., 2008, AJ, 135, 232
- Häring & Rix (2004) Häring N., Rix H.-W., 2004, ApJ, 604, L89
- Helfer et al. (2003) Helfer T. T., Thornley M. D., Regan M. W., Wong T., Sheth K., Vogel S. N., Blitz L., Bock D. C.-J., 2003, ApJS, 145, 259
- Héraudeau et al. (1999) Héraudeau P., Simien F., Maubon G., Prugniel P., 1999, A&AS, 136, 509
- Ho et al. (1997) Ho L., Filippenko A., Sargent W., 1997, ApJS, 112, 315
- Hu (2008) Hu J., 2008, MNRAS, 386, 2242
- Jarrett et al. (2003) Jarrett T. H., Chester T., Cutri R., Schneider S. E., Huchra J. P., 2003, AJ, 125, 525
- Jog & Combes (2009) Jog C. J., Combes F., 2009, Physics Reports, 471, 75
- Knapen et al. (2003) Knapen J. H., de Jong R. S., Stedman S., Bramich D. M., 2003, MNRAS, 344, 527
- Kormendy (1982) Kormendy J., 1982, ApJ, 257, 75
- Kormendy (1993) Kormendy J., 1993, in Dejonghe H., Habing H. J., eds, Galactic Bulges, Proc. IAU Symposium 153, p. 209
- Kormendy (2001) Kormendy J., 2001, RevMexAA, 10, 69
- Kormendy & Kennicutt, Jr. (2004) Kormendy J., Kennicutt, Jr. R., 2004, A&AR, 42, 603
- Kormendy & Richstone (1995) Kormendy J., Richstone D., 1995, A&AR, 33, 581
- Krajnović et al. (2006) Krajnović D., Cappellari M., de Zeeuw P. T., Copin Y., 2006, MNRAS, 366, 787
- Lyubenova et al. (2008) Lyubenova M., Kuntschner H., Silva D. R., 2008, A&A, 485, 425
- Magorrian (1999) Magorrian J., 1999, MNRAS, 302, 530
- Maoz (2007) Maoz D., 2007, MNRAS, 377, 1696
- Maoz et al. (2005) Maoz D., Nagar N. M., Falcke H., Wilson A. S., 2005, ApJ, 625, 699
- Maraston (1998) Maraston C., 1998, MNRAS, 300, 872
- Maraston (2005) Maraston C., 2005, MNRAS, 362, 799
- Marconi & Hunt (2003) Marconi A., Hunt L. K., 2003, ApJ, 589, L21
- Masters et al. (2008) Masters K. L., Springob C. M., Huchra J. P., 2008, AJ, 135, 1738
- McDermid et al. (2006) McDermid R. M., et al., 2006, MNRAS, 373, 906
- Moiseev et al. (2004) Moiseev A. V., Valdés J. R., Chavushyan V. H., 2004, A&A, 421, 433
- Mueller Sánchez et al. (2006) Mueller Sánchez F., Davies R. I., Eisenhauer F., Tacconi L. J., Genzel R., Sternberg A., 2006, A&A, 454, 481
- Nowak et al. (2008) Nowak N., Saglia R. P., Thomas J., Bender R., Davies R. I., Gebhardt K., 2008, MNRAS, 391, 1629
- Nowak et al. (2007) Nowak N., Saglia R. P., Thomas J., Bender R., Pannella M., Gebhardt K., Davies R. I., 2007, MNRAS, 379, 909
- Peletier et al. (2007) Peletier R. F., et al., 2007, MNRAS, 379, 445
- Rabien et al. (2004) Rabien S., Davies R. I., Ott T., Li J., Abuter R., Kellner S., Neumann U., 2004, in Bonaccini D., Ellerbroek B. L., Ragazzoni R., eds, Advancements in Adaptive Optics, Proc. SPIE, Vol. 5490, p. 981
- Reunanen et al. (2002) Reunanen J., Kotilainen J. K., Prieto M. A., 2002, MNRAS, 331, 154
- Richstone & Tremaine (1988) Richstone D. O., Tremaine S., 1988, ApJ, 327, 82
- Rodríguez-Ardila et al. (2005) Rodríguez-Ardila A., Riffel R., Pastoriza M. G., 2005, MNRAS, 364, 1041
- Sakamoto et al. (1999) Sakamoto K., Okumura S. K., Ishizuki S., Scoville N. Z., 1999, ApJS, 124, 403
- Sarzi et al. (2002) Sarzi M., et al., 2002, ApJ, 567, 237
- Sarzi et al. (2005) Sarzi M., Rix H.-W., Shields J. C., Ho L. C., Barth A. J., Rudnick G., Filippenko A. V., Sargent W. L. W., 2005, ApJ, 628, 169
- Schlegel et al. (1998) Schlegel D. J., Finkbeiner D. P., Davis M., 1998, ApJ, 500, 525
- Schneider (1989) Schneider S. E., 1989, ApJ, 343, 94
- Schreiber et al. (2004) Schreiber J., Thatte N., Eisenhauer F., Tecza M., Abuter R., Horrobin M., 2004, in Ochsenbein F., Allen M., Egret D., eds, Data reduction software for the VLT Integral Field Spectrometer SPIFFI, ASP Conf. Proc. Vol. 314, p. 380
- Schwarzschild (1979) Schwarzschild M., 1979, ApJ, 232, 236
- Sil’chenko et al. (2003) Sil’chenko O. K., Moiseev A. V., Afanasiev V. L., Chavushyan V. H., Valdes J. R., 2003, ApJ, 591, 185
- Silge & Gebhardt (2003) Silge J. D., Gebhardt K., 2003, AJ, 125, 2809
- Silva et al. (2008) Silva D. R., Kuntschner H., Lyubenova M., 2008, ApJ, 674, 194
- Siopis et al. (2009) Siopis C., et al., 2009, ApJ, 693, 946
- Skrutskie et al. (2006) Skrutskie M. F., et al., 2006, AJ, 131, 1163
- Smith et al. (2000) Smith R. J., Lucey J. R., Hudson M. J., Schlegel D. J., Davies R. L., 2000, MNRAS, 313, 469
- Springob et al. (2005) Springob C. M., Haynes M. P., Giovanelli R., Kent B. R., 2005, ApJS, 160, 149
- Thomas et al. (2009) Thomas J., et al., 2009, MNRAS, 393, 641
- Thomas et al. (2007) Thomas J., Jesseit R., Naab T., Saglia R. P., Burkert A., Bender R., 2007, MNRAS, 381, 1672
- Thomas et al. (2005) Thomas J., Saglia R., Bender R., Thomas D., Gebhardt K., Magorrian J., Corsini E., Wegner G., 2005, MNRAS, 360, 1355
- Thomas et al. (2004) Thomas J., Saglia R., Bender R., Thomas D., Gebhardt K., Magorrian J., Richstone D., 2004, MNRAS, 353, 391
- Tonry et al. (2001) Tonry J. L., Dressler A., Blakeslee J. P., Ajhar E. A., Fletcher A. B., Luppino G. A., Metzger M. R., Moore C. B., 2001, ApJ, 546, 681
- Tremaine et al. (2002) Tremaine S., et al., 2002, ApJ, 574, 740
- van den Bosch et al. (2008) van den Bosch R. C. E., van de Ven G., Verolme E. K., Cappellari M., de Zeeuw P. T., 2008, MNRAS, 385, 647
- van der Marel & Franx (1993) van der Marel R. P., Franx M., 1993, ApJ, 407, 525
- Vega Beltrán et al. (2001) Vega Beltrán J. C., Pizzella A., Corsini E. M., Funes J. G., Zeilinger W. W., Beckman J. E., Bertola F., 2001, A&A, 374, 394
- Whitmore et al. (1979) Whitmore B. C., Schechter P. L., Kirshner R. P., 1979, ApJ, 234, 68
- Wozniak et al. (2003) Wozniak H., Combes F., Emsellem E., Friedli D., 2003, A&A, 409, 469
- York et al. (2000) York D. G., et al., 2000, AJ, 120, 1579