The Structure of Clusters with Bimodal Distributions of
Galaxy Radial Velocities. I. A1035
Abstract
The structure of the A1035 cluster of galaxies (, km s-1), which exhibits a bimodal distribution of galaxy radial velocities ( km s-1), is analyzed using three methods of determining the relative distances to clusters from early-type galaxies: the Kormendy relation corrected for the dependence of residuals on galaxy magnitude, the photometric plane, and the fundamental plane. We use the data obtained with the 1-m telescope of the Special Astrophysical Observatory of the Russian Academy of Sciences and SDSS (DR5) data to show that A1035 consists of two gravitationally unbound independent clusters. These clusters with the velocity dispersions of 566 km s-1 and 610 km s-1 and masses within equal to and , respectively, obey the Hubble law.
1 INTRODUCTION
Different methods of determination of masses of clusters of galaxies (based on x-ray flux, gravitational lensing of galaxies by the cluster, or on the virial theorem) yield the results that agree well with each other for the central regions of regular clusters. The mass distribution on scale lengths exceeding the size of virialized cluster regions (1–2 Mpc) is much more poorly known. In this connection it is of interest to study the dynamics of interaction of neighboring clusters and subclusters within the same cluster. The velocity dispersion amounts to km s-1 in the richest clusters, where galaxies sometime form complex structures — subclusters. Of special interest are the cases where the velocity distribution in a cluster has a bimodal form. A km s-1 difference between the mean radial velocities may be due to either the gravitational interaction between extremely massive clusters colliding close to the line of sight (see Hayashi and WhiteHayashi for theoretical estimates of limiting velocities in terms of the ), or to the line-of-sight projection of unbound clusters.
Sufficiently reliable direct estimates of the distances to subclusters have been obtained for two clusters with a bimodal galaxy velocity distribution: A3526 (Centaurus) Lucey and A2626 Mohr . In both cases the subclusters are located at the same heliocentric distance and the velocity difference (1500 and 2600 km s-1, respectively) is due to the gravitational interaction between the subclusters. In the case of A2626 the higher subcluster velocity difference compared to velocities of internal motions may be due to the large mass of the (dark) matter at the periphery of the clusters Mohr .
We selected a total of four rich clusters (A1035, A1569, A1775, and A1831) with a bimodal distributions of galaxy radial velocities ( km s-1) for direct (i.e., redshift independent) determination of subcluster distances and for the determination of the nature of interaction between the subclusters. In this paper we determine the (line-of-sight) structure of the A1035 cluster using three different methods to estimate relative distances from early-type galaxies. This work makes use of observational material obtained with the 1-m telescope of the Special Astrophysical Observatory of the Russian Academy of Sciences and the data of the SDSS (Sloan Digital Sky Survey) catalog.
0mm \onelinecaptionstrue\captionstylenormal
Clluster
Galaxy
,
,
,
,
No.
km s-1
mag
arcsec
mag
A1035A
1
10 32 23.47 +40 10 08.6
0.067020
20092
14.15
10.33
22.61
A1035A
2
10 32 15.27 +40 10 12.5
0.067040
20098
14.30
14.06
23.38
A1035A
3
10 32 28.89 +40 08 54.6
0.068691
20593
14.82
4.55
21.26
A1035A
4
10 31 55.98 +40 06 43.7
0.068831
20635
14.99
3.09
20.45
A1035A
5
10 32 05.95 +40 17 25.7
0.072430
21714
15.20
3.84
21.36
A1035A
6
10 32 12.49 +40 08 08.4
0.065940
19768
15.55
3.60
21.48
A1035A
7
10 32 19.90 +40 08 26.5
0.065582
19661
15.50
3.27
21.25
A1035A
8
10 31 37.06 +40 07 39.6
0.071793
21523
15.70
2.94
21.14
A1035A
9
10 31 22.79 +40 10 09.9
0.068496
20535
16.08
2.24
20.89
A1035B
1
10 32 13.92 +40 16 16.4
0.077816
23329
13.77
11.64
22.51
A1035B
2
10 31 57.03 +40 18 20.7
0.078951
23669
15.22
3.96
21.59
A1035B
3
10 32 07.42 +40 10 30.3
0.076860
23042
15.42
4.06
21.54
A1035B
4
10 32 10.77 +40 17 02.4
0.081590
24460
16.02
2.77
21.34
A1035B
5
10 31 37.75 +40 10 32.6
0.077238
23155
16.17
2.72
21.49
A1035B
6
10 32 07.52 +40 15 49.7
0.074700
22394
16.44
2.21
20.99
—
A1035B
7
10 32 18.29 +40 17 01.5
0.078633
23574
16.43
3.16
21.90
This paper has the following layout. Section I gives an introduction. Section II describes samples of early-type galaxies. Section III describes the specifics of the use of samples for the determination of distances to clusters of galaxies and their analysis. In conclusion, we list the main results of this study. We adopt the following values for cosmological parameters: , , and km s-1 Mpc-1.
5mm \onelinecaptionsfalse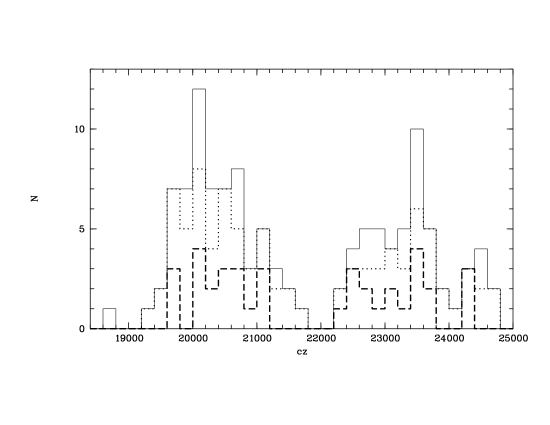 \captionstylenormal
5mm \onelinecaptionsfalse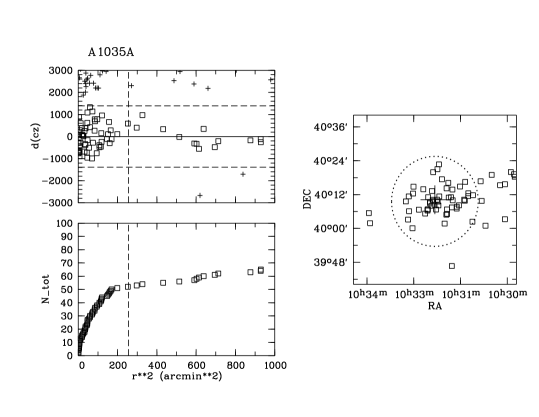 \captionstylenormal
5mm \onelinecaptionstrue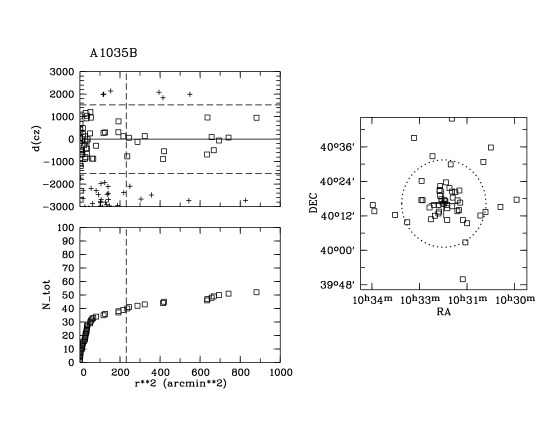 \captionstylenormal
2 DESCRIPTION OF DATA
In this section we describe observational data — the parameters of early-type galaxies that we use to determine the relative distances to the subsystems in the A1035 cluster Abell . According to Abell’s catalog, this cluster has a radial velocity of km/s, richness class 2, and belongs to Bautz-Morgan II–III type. We use SDSS (DR5) data to identify two subsystems — A1035A and A1035B — in the A1035 cluster (Fig. 1 shows the velocity distribution).Figures 2 and 3 show our results for the main parameters of the clusters: deviations of the radial velocities of cluster members from the mean radial velocity of the cluster; integrated distribution of clustercentric distances of cluster members, and the sky-plane locations of cluster members. The center of A1035B coincides with the position of the brightest cD galaxy and with the peak of x-ray flux distribution. We adopt the center of A1035A to be located between the two brightest galaxies.
0mm\onelinecaptionstrue\captionstylenormal
| Cluster. | , | , | , | , | |||||
|---|---|---|---|---|---|---|---|---|---|
| km s-1 | km s-1 | mag | arcsec | ||||||
| A1035A | 10 32 15.27 +40 10 12.5 | 0.067102 | 20117 | 208 | 15.18 | 4.24 | 1.000 | 3.49 | -0.159 |
| A1035A | 10 32 28.89 +40 08 54.6 | 0.066943 | 20069 | 196 | 15.22 | 5.34 | 0.907 | 2.93 | -0.142 |
| A1035A | 10 32 23.47 +40 10 08.6 | 0.066900 | 20056 | 220 | 15.26 | 4.47 | 1.000 | 3.38 | -0.162 |
| A1035A | 10 31 55.98 +40 06 43.7 | 0.069003 | 20687 | 240 | 15.30 | 3.05 | 0.980 | 3.11 | -0.143 |
| A1035A | 10 32 33.51 +40 06 41.6 | 0.069241 | 20758 | 199 | 15.52 | 3.65 | 1.000 | 3.28 | -0.132 |
| A1035A | 10 32 12.49 +40 08 08.4 | 0.065940 | 19768 | 177 | 15.80 | 4.24 | 0.952 | 3.18 | -0.137 |
| A1035A | 10 32 19.90 +40 08 26.5 | 0.065582 | 19661 | 208 | 15.85 | 2.80 | 1.000 | 3.17 | -0.142 |
| A1035A | 10 33 00.49 +40 14 50.3 | 0.070582 | 21160 | 163 | 16.14 | 2.85 | 1.000 | 3.26 | -0.122 |
| A1035A | 10 31 52.75 +40 10 56.7 | 0.068040 | 20398 | 190 | 16.18 | 2.78 | 0.918 | 2.90 | -0.156 |
| A1035A | 10 32 24.94 +40 13 14.6 | 0.067106 | 20118 | 148 | 16.33 | 3.06 | 0.904 | 3.02 | -0.140 |
| A1035A | 10 32 22.64 +40 19 58.5 | 0.070606 | 21167 | 129 | 16.36 | 2.82 | 1.000 | 2.62 | -0.152 |
| A1035A | 10 31 22.79 +40 10 09.9 | 0.068496 | 20535 | 164 | 16.42 | 1.50 | 1.000 | 2.99 | -0.136 |
| A1035A | 10 31 56.77 +40 14 12.7 | 0.067393 | 20204 | 124 | 16.46 | 2.74 | 0.859 | 2.88 | -0.129 |
| A1035A | 10 31 14.93 +40 12 26.9 | 0.070187 | 21042 | 125 | 16.54 | 2.15 | 1.000 | 3.12 | -0.126 |
| A1035A | 10 32 17.02 +40 06 42.1 | 0.070001 | 20986 | 132 | 16.95 | 2.17 | 1.000 | 2.91 | -0.128 |
| A1035A | 10 31 20.88 +40 16 30.6 | 0.068932 | 20665 | 115 | 16.96 | 1.73 | 0.906 | 2.73 | -0.123 |
| A1035A | 10 31 45.59 +40 13 47.7 | 0.065967 | 19776 | 147 | 17.07 | 1.74 | 0.908 | 2.84 | -0.150 |
| A1035A | 10 32 33.59 +40 06 21.4 | 0.068162 | 20434 | 114 | 17.10 | 2.72 | 0.831 | 2.83 | -0.125 |
| A1035A | 10 31 06.04 +40 11 46.5 | 0.068363 | 20495 | 151 | 17.15 | 1.36 | 0.978 | 2.72 | -0.132 |
| A1035B | 10 31 57.03 +40 18 20.7 | 0.079322 | 23780 | 218 | 15.56 | 4.25 | 1.000 | 3.31 | -0.143 |
| A1035B | 10 31 04.63 +40 12 06.9 | 0.080857 | 24240 | 146 | 15.84 | 4.89 | 1.000 | 2.95 | -0.140 |
| A1035B | 10 32 54.02 +40 17 24.3 | 0.075323 | 22581 | 219 | 16.31 | 1.85 | 1.000 | 3.34 | -0.134 |
| A1035B | 10 32 10.77 +40 17 02.4 | 0.081375 | 24396 | 153 | 16.33 | 3.20 | 0.848 | 2.93 | -0.128 |
| A1035B | 10 31 47.68 +40 17 21.7 | 0.075329 | 22583 | 170 | 16.36 | 3.17 | 1.000 | 2.94 | -0.157 |
| A1035B | 10 31 48.12 +40 13 36.7 | 0.076802 | 23025 | 134 | 16.45 | 2.00 | 1.000 | 3.01 | -0.138 |
| A1035B | 10 32 18.29 +40 17 01.5 | 0.078633 | 23574 | 121 | 16.71 | 3.36 | 0.997 | 2.64 | -0.137 |
| A1035B | 10 32 07.52 +40 15 49.7 | 0.074700 | 22394 | 195 | 16.74 | 2.12 | 0.817 | 2.68 | -0.136 |
| A1035B | 10 32 22.67 +40 13 28.5 | 0.078169 | 23434 | 159 | 16.92 | 1.39 | 1.000 | 2.98 | -0.126 |
| A1035B | 10 33 23.12 +40 09 46.5 | 0.078639 | 23575 | 141 | 16.97 | 1.93 | 1.000 | 2.83 | -0.112 |
| A1035B | 10 32 56.32 +40 17 29.7 | 0.075317 | 22579 | 153 | 17.02 | 1.21 | 1.000 | 3.04 | -0.124 |
| A1035B | 10 31 52.13 +40 20 13.4 | 0.081302 | 24374 | 122 | 17.10 | 3.44 | 0.974 | 2.82 | -0.106 |
| A1035B | 10 32 20.82 +40 18 58.5 | 0.076050 | 22799 | 122 | 17.17 | 2.00 | 0.831 | 2.67 | -0.137 |
| A1035B | 10 31 58.21 +40 20 28.3 | 0.077899 | 23354 | 145 | 17.44 | 1.40 | 0.947 | 2.69 | -0.136 |
| A1035B | 10 32 22.02 +40 20 40.8 | 0.077310 | 23177 | 114 | 17.45 | 1.41 | 0.964 | 2.66 | -0.097 |
| A1035B | 10 32 38.02 +40 10 48.7 | 0.079071 | 23705 | 139 | 17.45 | 1.74 | 1.000 | 2.72 | -0.099 |
| A1035B | 10 32 21.50 +40 21 02.7 | 0.078636 | 23574 | 102 | 17.47 | 1.52 | 1.000 | 2.93 | -0.021 |
| A1035B | 10 32 23.81 +40 15 49.0 | 0.076353 | 22890 | 151 | 17.47 | 1.54 | 1.000 | 3.03 | -0.111 |
| A1035B | 10 32 40.81 +40 14 55.0 | 0.075532 | 22644 | 117 | 17.69 | 1.28 | 0.909 | 2.77 | -0.104 |
5mm \onelinecaptionsfalse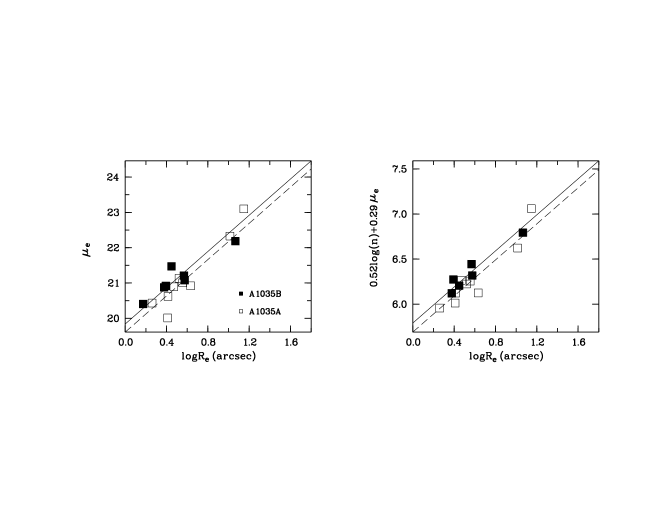 \captionstylenormal
Table 3 lists the cluster parameters that we determined for the objects located within the radius according to SDSS data. Here is the radius of the virialized part of the cluster where the mass density exceeds the critical density of the Universe by a factor of 200. In this case, the cluster mass can be determined from and velocity dispersion . We determined the average radial velocity of the cluster and its dispersion iteratively: we first use all galaxies with measured radial velocities ( and in A1035A and A1035B, respectively) inside the region of radius studied here except for those that deviate by more than 2.5 . We further assume that the clusters are in virial equilibrium and that their masses increase linearly with radius to compute, with the resulting velocity dispersion, the radius = Mpc Carlberg and redetermine the average cluster radial velocity and its dispersion inside the radius. The virial mass within this radius is equal to . Here is the number of galaxies with measured radial velocities located inside . We adopt the x-ray luminosities from Rines and Diaferio Rines . The same authors showed that A1035 consists of two subclusters. Figure 1 shows the distribution of galaxy radial velocities in the systems inside the selected radius.
0mm \onelinecaptionstrue\captionstyleflushleft Cluster , , , , , km s-1 km s-1 Mpc erg s-1 A1035A 10 32 19.36 +40 10 10.4 0.067992 20383 1.24 52 0.7 A1035B 10 32 13.95 +40 16 16.5 0.078216 23448 1.35 39 2.0
2.1 The Data for Early-Type Galaxies Based on Observations Made with the 1-m Telescope
The relative distances of clusters of galaxies in sufficiently distant regions with and higher are determined using parameters of early-type galaxies (e.g., Colless ; Hudson ). In this paper we use three methods based on the properties of early-type galaxies to estimate the peculiar motions of clusters A1035A and A1035B: the Kormendy relation Kormendy , the photometric plane (PhP) Graham , and the fundamental plane (FP) Djorgovski . To accomplish our task, we determined the parameters of 16 galaxies in the systems studied using the direct -band (the Kron–Cousins system) images that we took with the 1-m telescope of the Special Astrophysical Observatory of the Russian Academy of Sciences in 1998, 1999, and 2003 under average seeing conditions () measured as the FWHM of a star’s profile. In 1998 and 1999 a ISD015A CCD was used with a pixel size of m, which corresponds to an angular size of . In 2003, a CCD with an angular pixel size of was used. The exposures were equal to 500 or 600 s. Landolt’s Landolt standard stars were observed several times during each night to provide photometric calibration.
We use MIDAS (Munich Image Data Analysis System, Grosbol ) to reduce the observational data. We apply the standard procedure of image reduction: subtraction of median dark frame, division by flat field, and subtraction of the sky background approximated by a quadric surface. We use multiaperture photometry to determine the total asymptotic magnitude of each galaxy. We then use the total magnitude to determine the effective radius of the circle where the galaxy luminosity decreases by a factor of two, and the effective surface brightness at this radius. We determine the exponent characterizing the shape of the surface brightness profile by fitting a Sersic Sersic profile ( = 4 for the de Vaucouleurs deV profile) to the observed profile in the galactocentric radius interval from 3 FWHM out to the radius where the surface brightness equals arcsec-2. We then use the method proposed by Saglia et al. Saglia to correct the resulting photometric parameters of galaxies ( and ), except for . We compare independent measurements for 15 galaxies that we observed twice to find that the standard error of measured and is equal to and 0.02, respectively. We thus use model-independent galaxy parameters(, ) estimated from the total asymptotic absolute magnitude, and model-dependent quantity . The asymptotic magnitude was difficult to determine for the three brightest galaxies (of very large size), and that is why we estimate all parameters by fitting Sersic’s profile to observations.
Table 1 features the results of our photometric measurements. It contains the following data (the observed galaxy parameters are not corrected for seeing): the number of the cluster according to Abell’s catalog; the number of the galaxy; the J2000 equatorial coordinates of galaxies; the heliocentric redshift and radial velocity (according to NED); the total (asymptotic) magnitude; the effective radius of the galaxy in arcseconds; the effective surface brightness at the effective radius, and the Sersic profile shape parameter and its error.
5mm
\onelinecaptionsfalse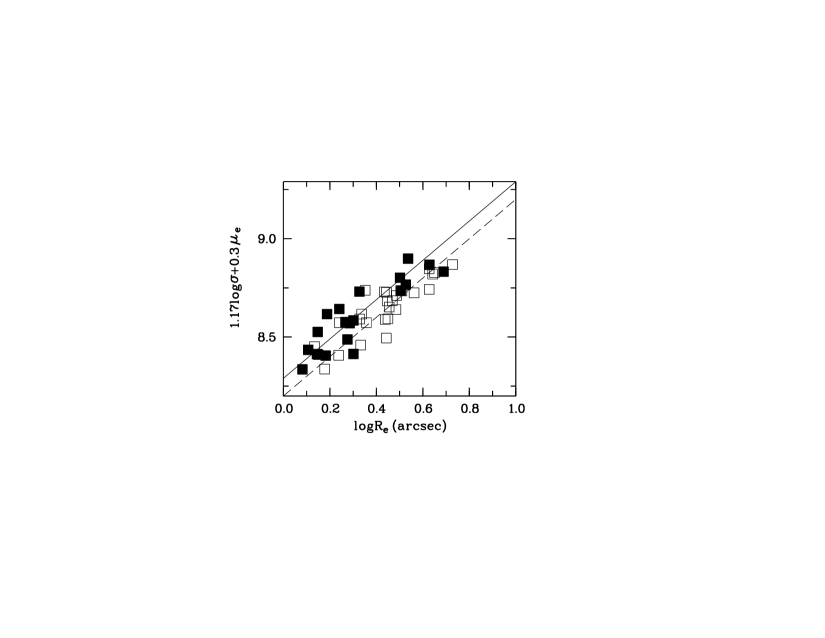 \captionstylenormal
8mm
\onelinecaptionsfalse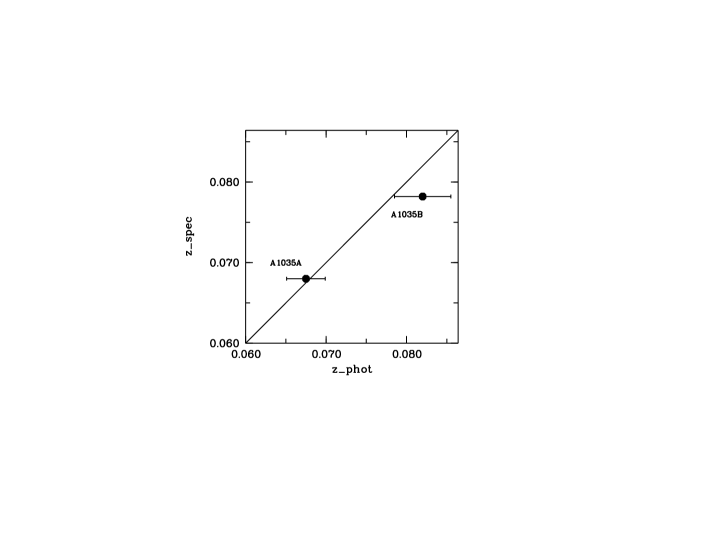 \captionstylenormal
2.2 Data for Early-type Galaxies from the SDSS Catalog
We compiled a sample of early-type galaxies in the A1035A and A1035B clusters based on SDSS DR5 Adelman data (-band). We selected galaxies based on the criteria proposed by Bernardi et al. Bern1 (down to the SDSS limiting magnitude of ). We found a total of 19 galaxies within the virialized region in each cluster. Table LABEL:sdss:Kopylov_n gives the following parameters for the sample of early-type galaxies that we selected from the catalog: the J2000 equatorial coordinates; the heliocentric redshift and radial velocity; the central stellar velocity dispersion ; the parameters of the de Vaucouleurs profile (total magnitude and effective radius); , the quantity that characterizes the contribution of the de Vaucouleurs bulge to the surface brightness profile of the galaxy; , the concentration index, which is equal to the ratio of the radii containing 90% and 50% of the Petrosian flux, and , the parameter that characterizes the spectrum of the galaxy: minus means that the spectrum exhibits no appreciable emission lines.
3 ANALYSIS OF RELATIVE DISTANCES OF THE SUBSYSTEMS IN A1035
Redshift-independent methods of distance determination for clusters of galaxies usually combine distance-dependent () and distance-independent (, ) parameters of early-type galaxies. In the case of the A1035 cluster considered here, which has a bimodal distribution of radial velocities, there are two possible variants: either the A1035A and A1035B subclusters are gravitationally bound, located at the same distance, and constitute a single large cluster, or they are gravitationally unbound and obey the Hubble law, which relates radial velocity and distance, and these two subclusters are independent clusters.
A detailed description of the determination of cluster distances from the Kormendy Kormendy relation corrected for the dependence of residual velocities on galaxy magnitude can be found in our earlier paper Kop1 . The relation has the form: . Figure 4 (left panel) shows this relation for nine observed galaxies in A1035A and seven galaxies in A1035B. The figure gives our estimates for the following parameters: the seeing-corrected in arcsec and the surface brightness values with cosmological correction . The zero point of the relation varies with the distance to the galaxy and and is assumed to be barely affected by other factors (e.g., metallicity). We find the following zero-point values with magnitude correction applied: , ; , and . The zero-point difference is equal to , or, if computed without the three brightest galaxies, to . If the subsystems obey the Hubble law, then the difference of radial velocities would imply a zero-point difference of 0.061.
Photometric plane (PhP) can be derived from the fundamental plane (FP) for early-type galaxies by substituting the photometrically measurable Sersic-profile parameter for the spectroscopically measurable parameter — the central stellar velocity dispersion in the galaxy. PhP was constructed, e.g., by Graham Graham . To construct it, we use the photometric data (, ) Kopyl for 12 early-type galaxies obtained with the 6-m telescope with 200-s exposures under seeing conditions. We determine Sersic’s parameter from the surface brightness profile.
If expressed in terms of , the PhP has the following form: . Figure 4 (right panel) shows the photometric planes for the galaxies studied. We find the following zero-points for the subsystems in A1035: = –5.6905 (=0.1190), ; = –5.7878 ( = 0.0710), . The zero-point difference is equal to or if computed without the three brightest galaxies.
SDSS data for a greater number of galaxies allow the zero points (cluster distances) to be estimated more accurately, because the statistical accuracy depends on the number of galaxies. To construct the FP, we compute the mean effective surface brightness by the following formula: = r+2.5 . Central velocity dispersion is adjusted to the standard circular aperture in accordance with Bern1 . Figure 5 shows the FP for the selected 38 galaxies with the coefficients (direct regression in terms of ) from Bernardi et al. Bern2 , where it has the following form: . We find the following zero points for the subsystems in A1035: , ; , and . The zero-point difference is equal to =+0.082. The two regressions (direct and orthogonal) yield an average zero-point difference of , i.e., the distances to the two clusters differ by almost . Thus all distance-measurement methods applied show that the subsystems in the A1035 have not segregated from the Hubble flow and are independent clusters. We also determine the peculiar velocities of A1035A and A1035B in the same coordinate system as we used in our earlier paper Kop2 with respect to the common zero points equal to –8.093 and –8.807, respectively. The less distant A1035A and more distant A1035B clusters have the peculiar velocities of km s-1 and km s-1, respectively. Figure 6 shows the Hubble diagram (for the most accurate method described above) for the two clusters studied. We compute the photometric redshifts (0.067532 and 0.081966 for A1035A and A1035B, respectively) corresponding to our estimated cluster distance from the difference between the common zero point and the zero point of each system.
4 CONCLUSIONS
We determine the -band photometric parameters (, , , ) for 16 early-type galaxies in the A1035 cluster with a bimodal distribution of radial velocities (the cluster consists of two subclusters A1035A and A1035B) from the observations made with the 1-m telescope of the Special Astrophysical Observatory of the Russian Academy of Sciences. We use these data to construct the Kormendy relation and the -band photometric plane for early-type galaxies. We use SDSS (DR5) data to determine the main parameters of these clusters and construct the -band fundamental plane for early-type galaxies. The distances to the clusters that we determine using the methods described allow us to more accurately assess the dynamical state of A1035 and determine the peculiar velocities of its subsystems. Our main conclusion is that the A1035 cluster consists of two independent systems located at their own Hubble distances. The mass of the central virialized regions is insufficient to gravitationally bind the clusters given the 3000 difference of their radial velocities.
Acknowledgements.
This work was supported in part by the Russian Foundation for Basic Research (grant no. 07-02-01417a). This research has made use the NASA/IPAC Extragalactic Database (NED), which is operated by the Jet Propulsion Laboratory, California Institute of Technology, under contract with the NASA.Funding for the creation and distribution of the SDSS Archive has been provided by the Alfred P. Sloan Foundation, the Participating Institutions, the National Aeronautics and Space Administration, the National Science Foundation, the US Department of Energy, the Japanese Monbukagakusho, and the Max Planck Society. The SDSS Web site is http://www.sdss.org/.
References
References
- (1) E. Hayashi, S. D. M. White, Monthly Notices Roy. Astronom. Soc.370, L38 (2006).
- (2) J. R. Lucey, M. J. Currie, R. J. Dickens, Monthly Notices Roy. Astronom. Soc.221, 453 (1986).
- (3) J. J. Mohr, G. Wagner, Astronom. J.114, 25 (1997).
- (4) G. O. Abell, H. G. Corwin, Jr., R. P. Olowin Astrophys. J. Suppl.70, 1 (1989).
- (5) M.R. Carlberg, H.K.C. Yee, E. Ellingson et al., Astrophys. J. Suppl.485, L13 (1997).
- (6) K. Rines, A. Diaferio, Astronom. J.132, 1275 (2006).
- (7) M. Colless, R. P. Saglia, D. Burstein et al., Monthly Notices Roy. Astronom. Soc.321, 277 (2001).
- (8) M. J. Hudson, R. J. Smith, J. R. Lucey, E. Branchini, Monthly Notices Roy. Astronom. Soc.352, 61 (2004).
- (9) J. Kormendy, Astronom. and Astrophys.218, 333 (1977).
- (10) A. W. Graham, Monthly Notices Roy. Astronom. Soc.334, 859 (2002).
- (11) S. Djorgovski, M. Davis, Astrophys. J. 313, 59 (1987).
- (12) A. U. Landolt, Astronom. J.104, 340 (1994).
- (13) P. Grosbol. in Reviews in modern astronomy, Springer-Verlag Berlin, Heidelberg, 1989, Ed.: Q. Klark, 2, 242 (2001).
- (14) J. L. Sérsic, Bol. Asoc. Argent. Astron., 6, 41 (1963).
- (15) G. de Vaucouleurs, Ann. d’Astrophys. 11, 247 (1948).
- (16) R. P. Saglia, E. Bertschinger, G. Baggley et al., Monthly Notices Roy. Astronom. Soc.264, 961 (1993).
- (17) J. K. Adelman-McCarthy et al., Astrophys. J. Suppl., submitted (2007).
- (18) M. Bernardi, R. K. Sheth, J. Annis et al., Astronom. J.125, 1849 (2003a).
- (19) F. G. Kopylova, A. I. Kopylov, Astron. Lett. 27, 345 (2001).
- (20) A. I. Kopylov, F. G. Kopylova, Astronom. and Astrophys.382, 389 (2002).
- (21) M. Bernardi, R. K. Sheth, J. Annis et al., Astronom. J.125, 1866 (2003b).
- (22) F. G. Kopylova, A. I. Kopylov, Astron. Lett. 33, 211 (2007).