Millimeter Dust Emission in the GQ Lup System
Abstract
We present Submillimeter Array observations of the GQ Lup system at 1.3 millimeters wavelength with (60 AU) resolution. Emission is detected from the position of the primary star, GQ Lup A, and is marginally resolved. No emission is detected from the substellar companion, GQ Lup B, away. These data, together with models of the spectral energy distribution, suggest a compact disk around GQ Lup A with mass MJup, perhaps truncated by tidal forces. There is no evidence for a gap or hole in the disk that might be the signature of an additional inner companion body capable of scattering GQ Lup B out to AU separation from GQ Lup A. For GQ Lup B to have formed in situ, the disk must have been much more massive and extended.
1 Introduction
The classical T Tauri star GQ Lup A (spectral type K7, age Myr) has received considerable attention since the detection by direct imaging in the near-infrared of a companion, GQ Lup B, at projected separation ( AU at 150 pc) with a mass originally claimed to be perhaps as low as the planet Jupiter (Neuhäuser et al., 2005). Subsequent spectroscopy and analysis suggested a higher mass for the companion, most likely a brown dwarf in the range of 10 to 40 MJup (e.g. Mugrauer et al., 2005; Guenther, 2006; McElwain et al., 2007; Seifahrt et al., 2007; Marois et al., 2008; Neuhäuser et al., 2008), making it one of a small but growing class of pre-main-sequence stars with substellar companions at AU separations (Luhman et al., 2006; Schmidt et al., 2009).
Such wide-separation, high-mass ratio companions are difficult to form in situ within circumstellar disks either by the standard core-accretion process or by the gravitational instability mechanism (Boss, 2006; Debes & Sigurdsson, 2006; Veras et al., 2009). Observations of the disk(s) in these young systems may offer clues to their formation. While the GQ Lup system exhibits all of the usual pre-main-sequence disk signatures, including optical emission lines due to gas accretion and thermal dust emission from infrared to millimeter wavelengths (Nürnberger et al., 1997), it is not known whether the bulk of the disk mass is associated with the primary star, the substellar companion, or resides in a circumbinary structure. If GQ Lup B formed as a “planet” within a circumstellar disk, for example, then one might expect disk material to be present at large radii, beyond its orbit, ultimately evolving into a debris disk like those surrounding the recently imaged bodies orbiting HR 8799 (Marois et al., 2008) and Fomalhaut (Kalas et al., 2008).
Interferometric imaging of thermal dust continuum emission at millimeter wavelengths offers a way to trace the location of cool material in the GQ Lup system. In this paper, we present 1.3 millimeter observations with sufficient angular resolution to separate the primary and the companion, which reveal a compact disk surrounding GQ Lup A. We model the disk emission to constrain physical properties and GQ Lup B formation scenarios.
2 Observations
We observed GQ Lup at 1.3 millimeters wavelength with Submillimeter Array (SMA) 111The Submillimeter Array is a joint project between the Smithsonian Astrophysical Observatory and the Academica Sinica Institute of Astronomy and Astrophysics and is funded by the Smithsonian Institution and the Academica Sinica. on 2007 June 19 as a short filler project, at the start of a set of antenna moves from the very extended configuration to a compact configuration. The six available antennas provided projected baselines from 30 to 430 meters. The two hour observation was performed in excellent weather conditions, with 225 GHz atmospheric opacity of 0.05, as measured at the nearby Caltech Submillimeter Observatory. The correlator provided 2 GHz bandwidth in two sidebands, with a central LO frequency of 225 GHz. Observations of the two quasars J1517-243 and J1454-377 were interleaved with GQ Lup (R.A. = , DEC =, J2000). Passband calibration was accomplished with observations of the strong source 3c273. Complex gain calibration was done using J1517-243. The position derived for J1454-377, within of its catalog position, provides an empirical measure of the astrometric accuracy that should also hold for GQ Lup. The absolute flux scale was set with reference to the standard calibrator MWC349, assumed to be 1.65 Jy at 225 GHz, accurate to better than 20%. All of the calibration was performed with the IDL based MIR software. Subsequent imaging was performed using standard routines in the MIRIAD package.
3 Results and Analysis
3.1 1.3 mm Continuum
Figure 1 shows the image of the GQ Lup 1.3 millimeter continuum emission, with synthesized beam at position angle using data from both sidebands and natural weighting to obtain the best signal-to-noise ratio. The beam is highly elliptical due to the low declination of the source combined with the limited coverage provided by the short span of the observations. Nonetheless, examination of the image shows that the emission clearly peaks at the primary star, GQ Lup A, within the astrometric uncertainty, and no significant emission is detected from the substellar companion, GQ Lup B. (Note that any unaccounted-for orbital motion of GQ Lup B is very small, well below the resolution of these observations (Mugrauer et al., 2005).) The flux density determined either by integrating in a box around the emission in the image, or by fitting the visibilities with a Gaussian, is mJy (statistical error only). We identify the emission with a compact disk surrounding GQ Lup A.
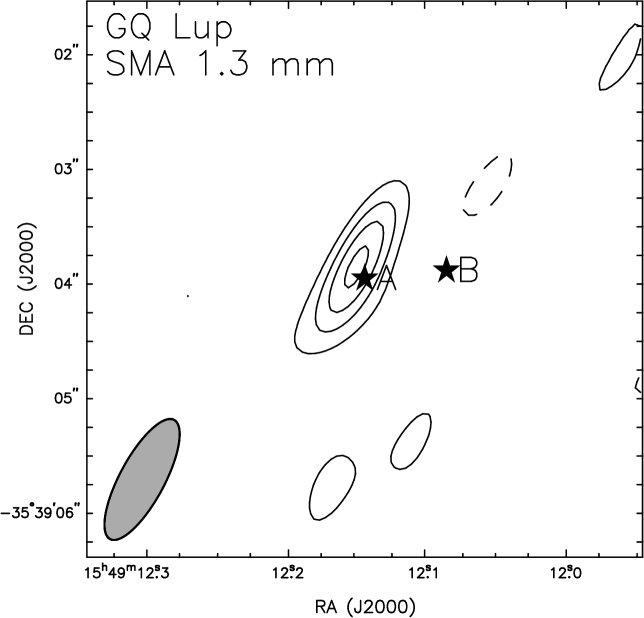
The SMA flux density is consistent, within the uncertainties, with the SEST single dish bolometer measurement of 387 mJy (Nürnberger et al., 1997). The agreement is likely better than suggested by a strict comparison of the values, considering that the effective frequency of the GHz wide SEST bandwidth is likely 240 to 250 GHz on account of the steeply rising dust spectrum (e.g. Carilli et al., 2001), which biases the measurement to a higher value (at least 20% for S). Given this consistency, we conclude that no significant emission has been missed due to spatial filtering by the interferometer.
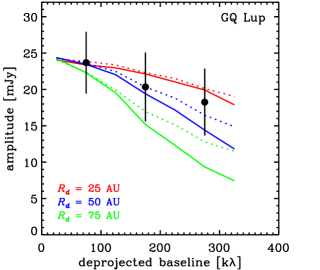
The left panel of Figure 2 shows the visibility amplitude for the SMA data as a function of baseline length, averaged in concentric circular annuli, appropriate for a disk viewed face-on. The disk inclination is unknown and cannot be determined from these data, but if it is similar to the inclination of the binary system of (Broeg et al., 2007; Hügelmeyer et al., 2009), then the face-on approximation is reasonable. While the bins are coarse and the signal-to-noise per bin is modest (), the slight trend of decreasing amplitude at longer baselines suggests that the emission from GQ Lup is unresolved or marginally resolved. To estimate the atmospheric seeing effect on GQ Lup, we fit the calibrated visibilities of J1454-377, which has a similar angular separation from J1517-243 as GQ Lup (albeit in a different direction), and obtain fwhm. The seeing is a minor contributor to the visibility amplitude trend. Note that if we make the extreme assumption that the source emission is optically thick, then the observed flux density implies a minimum size. For a face-on disk with characteristic temperature 30 K, the minimum radius is AU (diameter ).
3.2 SED
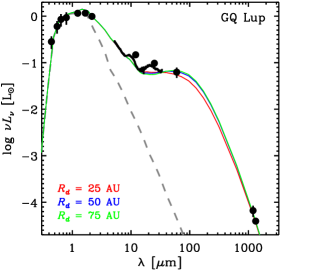
The right panel of Figure 2 shows the spectral energy distribution (SED) of the GQ Lup system, including the new SMA datum and values from the literature. The optical B,V,R,I data are from Herbst et al. (1994), dereddened assuming AV=0.5 and the Mathis (1990) extinction law. The near infrared J,H,K data are from the Two Micron All Sky Survey (Skrutskie et al., 2006). At longer infrared wavelengths, the spectrum from 5 to 40 m is taken from the public archive of the Spitzer Space Telescope ‘c2d’ legacy program (Evans et al., 2003; Kessler-Silacci et al., 2006), and data at 12, 25, and 60 m are from the IRAS Faint Source Catalog (Moshir et al., 1990). The IRAS data appear to be systematically higher than the Spitzer data, more than what is readily explained by the presence of silicate features in the spectrum near 10 and 20 m or by the nominal instrumental calibration uncertainties.
3.3 Disk Models
To constrain the disk properties, we have calculated a series of models using the radiative transfer code RADMC (Dullemond & Dominik, 2004) employing an approach similar to Andrews et al. (2009). Any constraints on the disk parameters must be considered in the context of the model assumptions, given the limitations of the data available.
A natural physical model for the GQ Lup system includes a circumprimary disk with a sharp outer edge, as might result from tidal truncation by the secondary. Alternative models are possible but are not considered. In detail, we assume that the (dust) disk density structure is parameterized by a radial surface density power-law truncated at an outer radius, , i.e. , and a vertical scale height power-law with a “puffed-up” inner rim (as in Dullemond & Dominik, 2004). The disk temperature structure is then calculated self-consistently, assuming stellar irradiation is the only heating source. The accretion rate of M⊙ derived by Hügelmeyer et al. (2009) provides negligible heating compared to the star. For these models, we use the stellar spectral type and dereddened optical data to fix the stellar effective temperature, K and luminosity, L⊙, and fix at the dust sublimation radius of 0.09 AU (for a sublimation temperature of 1500 K). We also fix the surface density power law index, . This power law index is compatible with constant irradiated accretion disks away from the disk boundaries (D’Alessio et al., 1998), as well as resolved millimeter observations of T Tauri star disks (Wilner et al., 2000; Andrews & Williams, 2007). We adopt the dust opacities used by Andrews et al. (2009) and a standard gas-to-dust ratio of 100. The resulting mass opacity for (dust + gas) at 1.3 millimeters of cm2g-1 is very similar to the commonly adopted value of cm2g-1 of Beckwith et al. (1990). To make comparisons with the resolved millimeter data, we use a Gaussian with fwhm to approximate the atmospheric seeing effect, as estimated empirically from the calibrator observations.
The three solid curves in the right panel of Figure 2 show the best-fit models to the SED for three values of the disk radius, AU. Note that the silicate features near 10 and 20 m were excluded from the fit, as were the discrepant IRAS 12 and 25 m data. The fitted values for the parameters that describe the disk vertical structure are nearly identical in the three models, as these parameters are constrained essentially entirely by the shape of the infrared SED. In each of the three models, the flaring angle is characterized by , the scale height at 25 AU is 2.35 AU, and an inner rim scale height enhanced by 40% is needed to account for the detailed shape of the mid-infrared spectrum relative to the near-infrared emission. The variations of the disk radius over the range explored have a negligible effect on the SED, as expected (Adams et al., 1988). However, the corresponding model curves in the left panel of Figure 2 show that the disk radius has a dramatic effect on the 1.3 millimeter visibilities, in particular at the longer baselines that probe the relevant size scales. The disk models with and AU bracket the data points, while the model with AU produces insufficient emission at baselines k.
The constraint on is sensitive to the model assumptions. In particular, there is a well-known degeneracy between the prescribed radial fall-off in the disk surface density distribution and the outer radius (Mundy et al., 1996). To illustrate an alternative, we have calculated best-fit models that assume p=1.5, a steeper surface density distribution, for AU. The vertical structure parameters and SED fits in these models are nearly identical to the models that assume p=1. The main effect of the steeper radial surface density distribution is a less steep decline in the visibility function, for fixed outer radius, as shown by the dashed curves in the left panel of Figure 2. As expected, a slightly larger value of is favored compared to the p=1 models. A much more extreme fall-off of the surface density would be required to obtain as large as 100 AU or larger. Given the quality and noise of the millimeter data, a more complete exploration of disk model parameter space is not warranted.
The disk masses in the three p=1 models in Figure 2 are 0.0025, 0.0029, and 0.0032 M⊙, respectively. These values are similar to the value of 0.0043 M⊙ crudely estimated by Nürnberger et al. (1997) from the 1.3 millimeter flux and an average dust temperature of 30 K, assuming the Beckwith et al. (1990) mass opacity. The uncertainty in the disk mass estimates is dominated by the adopted mass opacity, which depends on the dust properties, including grain sizes, shapes and composition, as well as the assumed interstellar gas-to-dust ratio. The systematic uncertainties are significant. Plausible models for dust properties in disks, for example including the effect of grain growth beyond millimeter sizes, give rise to perhaps an order-of-magnitude range in the dust opacity at 1.3 millimeters (see e.g. D’Alessio et al., 2001; Draine, 2006).
4 Discussion
A comprehensive set of scenarios for the origin of widely separated, low mass companions like GQ Lup B has been considered by Debes & Sigurdsson (2006), including (a) formation as planet in situ at AU either by core accretion or by gravitational instability, (b) displacement of GQ Lup B to a wider orbit from a formation site much closer in to the primary, through stellar encounter, migration, or planet-planet scattering, and (c) formation as a brown dwarf by cloud fragmentation or capture. While there are arguments for and against each of these formation scenarios, and the true mass and nature of GQ Lup B remain in dispute, the observations of disk emission provide some new information.
For in situ formation of GQ Lup B as a planet to be viable, the disk surrounding GQ Lup A must have extended to larger radii in the past, with sufficient mass at AU. The detected disk is compact and low mass, only 3 MJup in the model with AU described in §3.2. We can extrapolate the disk models to estimate the mass reservoir that might have been available for planet formation in the outer disk. For a surface density deceasing with radius as , a disk extending to 250 AU, larger, would have a mass higher. In this example, the available disk mass of 12 MJup beyond 50 AU would be only marginally sufficient to explain GQ Lup B, even if all of this disk mass were incorporated into the companion. There is no evidence for circumstellar material beyond the orbit of GQ Lup B, and it seems unlikely that the outer disk mass could have been substantially larger than this estimate (unless the adopted millimeter mass opacity were to underestimate the disk mass by a substantial amount). Circumstellar disks with much larger outer radii do exist, e.g. IM Lup with radius AU in the same cloud complex (van Kempen et al., 2007; Panić et al., 2009), but these are unusual. Of course, the circumstellar disk may have been larger and/or more massive (and probably gravitationally unstable) at a much earlier evolutionary stage when the central protostar was forming. In that environment, the issue would be how continued infall and accretion could be quenched to allow the companion to remain at substellar mass.
Mechanisms that require moving GQ Lup B outward to AU from closer in would have an effect on the inner disk, which emits primarily in the mid-infrared. The SED shows no significant flux deficit relative to a continuous disk that would be indicative of a gap or hole produced by another massive companion orbiting at AU radius that could have interacted with GQ Lup B to drive an outward migration or to scatter it outward. Moreover, such a dynamical interaction likely would leave the hypothetical inner planet on an eccentric orbit, disrupting the inner disk. The SED also provides no evidence for any major disturbance in the disk resulting from a (rare) close stellar encounter capable of radically changing the orbital parameters of GQ Lup B.
The millimeter emission from the GQ Lup system is consistent with the flux densities found in surveys of classical T Tauri binary systems with separations in the range of AU (Jensen et al., 1996; Andrews & Williams, 2005), with a relatively low value readily explained by tidal truncation of individual circumstellar disks and a paucity of massive circumbinary disks. Representative calculations of disks in binary systems by Artymowicz & Lubow (1994) show truncation of the circumprimary disk at , where is the orbital semi-major axis, together with truncation of the circumsecondary disk more severe by a factor of a few. While the GQ Lup mass ratio is more extreme than considered by Artymowicz & Lubow (1994) and the outer disk radius derived from the resolved millimeter observations is model dependent, the data are qualitatively consistent with expectations for tidal truncation. The SED and millimeter data show directly the presence of a circumprimary disk, and the millimeter flux limit together with the suggestion of H emission (Marois et al., 2007) could indicate a significantly smaller circumsecondary disk. The observations presented here limit the disk mass around GQ Lup B to be approximately less than around GQ Lup A, or MJup.
More sensitive dust continuum observations could show whether or not the disk around GQ Lup A shares a common inclination and orientation with any putative disk around GQ Lup B, or with the GQ Lup A-B orbit. As more substellar companions to pre-main-sequence stars are identified by direct imaging, deep millimeter observations will reveal more about their formation processes and their enigmatic relationship to planets.
References
- Adams et al. (1988) Adams, F. C., Shu, F. H., & Lada, C. J. 1988, ApJ, 326, 865
- Andrews & Williams (2005) Andrews, S. M., & Williams, J. P. 2005, ApJ, 631, 1134
- Andrews & Williams (2007) Andrews, S. M., & Williams, J. P. 2007, ApJ, 659, 705
- Andrews et al. (2009) Andrews, S. M., Wilner, D. J., Hughes, A. M., Qi, C., & Dullemond, C. P. 2009, ApJ, 700, 1502A
- Artymowicz & Lubow (1994) Artymowicz, P., & Lubow, S. H. 1994, ApJ, 421, 651
- Beckwith et al. (1990) Beckwith, S. V. W., Sargent, A. I., Chini, R. S., & Guesten, R. 1990, AJ, 99, 924
- Boss (2006) Boss, A. P. 2006, ApJ, 637, L137
- Broeg et al. (2007) Broeg, C., Schmidt, T. O. B., Guenther, E., Gaedke, A., Bedalov, A., Neuhäuser, R., & Walter, F. M. 2007, A&A, 468, 1039
- Carilli et al. (2001) Carilli, C. L., et al. 2001, ApJ, 555, 625
- Debes & Sigurdsson (2006) Debes, J. H., & Sigurdsson, S. 2006, A&A, 451, 351
- D’Alessio et al. (1998) D’Alessio, P., Canto, J., Calvet, N., & Lizano, S. 1998, ApJ, 500, 411
- D’Alessio et al. (2001) D’Alessio, P., Calvet, N., & Hartmann, L. 2001, ApJ, 553, 321
- Draine (2006) Draine, B. T. 2006, ApJ, 636, 1114
- Dullemond & Dominik (2004) Dullemond, C. P., & Dominik, C. 2004, A&A, 417, 159
- Evans et al. (2003) Evans, N. J., II, et al. 2003, PASP, 115, 965
- Guenther (2006) Guenther, E. W. 2006, Reviews in Modern Astronomy, 19, 237
- Herbst et al. (1994) Herbst, W., Herbst, D. K., Grossman, E. J., & Weinstein, D. 1994, AJ, 108, 1906
- Hügelmeyer et al. (2009) Hügelmeyer, S. D., Dreizler, S., Hauschildt, P. H., Seifahrt, A., Homeier, D., & Barman, T. 2009, A&A, 498, 793
- Jensen et al. (1996) Jensen, E. L. N., Mathieu, R. D., & Fuller, G. A. 1996, ApJ, 458, 312
- Kalas et al. (2008) Kalas, P., et al. 2008, Science, 322, 1345
- Kessler-Silacci et al. (2006) Kessler-Silacci, J., et al. 2006, ApJ, 639, 275
- Luhman et al. (2006) Luhman, K. L., et al. 2006, ApJ, 649, 894
- Marois et al. (2007) Marois, C., Macintosh, B., Barman, T., 2007, ApJ, 654L, 151M
- Marois et al. (2008) Marois, C., Macintosh, B., Barman, T., Zuckerman, B., Song, I., Patience, J., Lafrenière, D., & Doyon, R. 2008, Science, 322, 1348
- Mathis (1990) Mathis, J. S. 1990, ARA&A, 28, 37
- McElwain et al. (2007) McElwain, M. W., et al. 2007, ApJ, 656, 505
- Moshir et al. (1990) Moshir, M., et al. 1990, IRAS Faint Source Catalogue, version 2.0 (1990)
- Mugrauer et al. (2005) Mugrauer, M. & Neuhäuser, R. 2005, Astron. Nachr. , 326, No. 8, 701
- Mundy et al. (1996) Mundy, L. G., et al. 1996, ApJ, 464, L169
- Neuhäuser et al. (2005) Neuhäuser, R., Guenther, E. W., Wuchterl, G., Mugrauer, M., Bedalov, A., & Hauschildt, P. H. 2005, A&A, 435, L13
- Neuhäuser et al. (2008) Neuhäuser, R., Mugrauer, M., Seifahrt, A., Schmidt, T. O. B., & Vogt, N. 2008, A&A, 484, 281
- Nürnberger et al. (1997) Nürnberger, D., Chini, R., & Zinnecker, H. 1997, A&A, 324, 1036
- Panić et al. (2009) Panić, O., Hogerheijde, M. R., Wilner, D., & Qi, C. 2009, A&A, 501, 269
- Schmidt et al. (2009) Schmidt, T. O. B., Neuhäuser, R., & Seifahrt, A. 2009, arXiv:0905.0439
- Skrutskie et al. (2006) Skrutskie, M. F., et al. 2006, AJ, 131, 1163
- Seifahrt et al. (2007) Seifahrt, A., Neuhäuser, R., & Hauschildt, P. H. 2007, A&A, 463, 309
- van Kempen et al. (2007) van Kempen, T. A., van Dishoeck, E. F., Brinch, C., & Hogerheijde, M. R. 2007, A&A, 461, 983
- Veras et al. (2009) Veras, D., Crepp, J. R., & Ford, E. B. 2009, ApJ, 696, 1600
- Wilner et al. (2000) Wilner, D. J., Ho, P. T. P., Kastner, J. H., & Rodríguez, L. F. 2000, ApJ, 534, L101