The Structure and Dynamics of the Upper Chromosphere and Lower Transition Region as Revealed by the Subarcsecond VAULT Observations
Abstract
The Very high Angular resolution ULtraviolet Telescope (VAULT) is a sounding rocket payload built to study the crucial interface between the solar chromosphere and the corona by observing the strongest line in the solar spectrum, the Ly line at 1216Å. In two flights, VAULT succeeded in obtaining the first ever sub-arcsecond () images of this region with high sensitivity and cadence. Detailed analyses of those observations have contributed significantly to new ideas about the nature of the transition region. Here, we present a broad overview of the Ly atmosphere as revealed by the VAULT observations, and bring together past results and new analyses from the second VAULT flight to create a synthesis of our current knowledge of the high-resolution Ly Sun. We hope that this work will serve as a good reference for the design of upcoming Ly telescopes and observing plans.
keywords:
line: Hydrogen Ly alpha —- atomic data —- Sun: corona —- Sun: UV radiation —- Sun: transition region1 Introduction \ilabels:Intro
The structure of the solar atmosphere as a function of temperature has been a ’thorny’ issue of solar physics research for decades. As the density decreases, the temperature, instead of decreasing, abruptly increases from K to a million K within a thousand km. It is known since the first solar imaging space missions that this so-called temperature transition region (TR) between the chromosphere and the corona, is also where the morphology of the atmospheric structures changes strongly. At the base of the atmosphere, the photosphere consists of small scale convective granules interlaced with occasional smaller intergranular lanes concentrating strong magnetic flux elements(, e.g. \opencite2004Natur.430..326T). The chromosphere (T K for the discussion here) consists of a very rugged, inhomogeneous, and very filamentary layer blanketing the photosphere.
Beginning at the chromosphere, the geometry of the individual structures is increasingly dominated by the local magnetic field. At the lower transition region (T K), the structures strongly reflect the morphology of the underlying supergranular network. As the magnetic pressure overtakes the gas pressure leading to the low beta corona, the percentage of emission in filamentary loops steadily increases until the network completely disappears at temperatures above K. It may seem that a straightforward interplay between heating and morphology takes place in the transition region but this is not the case.
The traditional picture of the transition region as the interface between the footpoints of large-scale structures and their coronal tops has been contradicted by the weakness of its observed emission [Landi and Feldman (2004)]. While the emission in the upper TR (K) can be understood in terms of heat conduction from the corona along magnetic field lines, the lower TR ( K) cannot. Instead, this plasma forms a completely separate component of the solar atmosphere [Feldman (1983), Feldman (1987)]. This component could consists of small “cool” loops [Antiochos and Noci (1986), Dowdy, Rabin, and Moore (1986), Feldman, Dammasch, and Wilhelm (2000), Peter (2001)] that are best seen in the Quiet Sun and that probably correspond to the upper reaches of the mixed polarity magnetic carpet [Schrijver et al. (1997)]. \inlinecite2009ApJ…693.1474F showed that the Differential Emission Measure (DEM) of the TR has the same shape everywhere (coronal holes, Quiet Sun, active regions) while coronal DEM of the very same regions are very different. Why and how are transition region loops different from higher arching coronal loops? Are they also comprised of unresolved strands? Are they heated in a fundamentally different way? Recently, Judge (2008) proposed a radically different view of the transition region emission, suggesting that it might result from cross-field diffusion of plasma from very fine cool threads extending into the corona (e.g. spicules), and its subsequent ionization. Cool threads gradually expand in thickness as the ionizing front expands across the field lines and emits at TR temperatures, and provide images of the transition region similar to those observed by the SUMER [Wilhelm et al. (1995)] spectrometer aboard SOHO.
Hinode observations revealed a dramatically new picture of the solar chromosphere and demonstrated its potential importance for the dynamics, energy and mass supply of the transition region and corona. High temporal (5s) and spatial (0.2′′) Hinode/SOT observations have shown that the chromosphere is much more structured and dynamic than previously believed. SOT has revealed a chromosphere hosting a wealth of wave and oscillatory phenomena manifested as longitudinal and transverse motions within structures at the resolution limit [de Pontieu et al. (2007a), Ofman and Wang (2008), Okamoto et al. (2007)]. Even a fraction of the inferred wave energy flux could account for the coronal energy losses if it reached the corona. SOT also showed that a significant fraction of observed spicules (’type II’), known for decades to dominate the chromospheric landscape, disappear very rapidly (De Pointieu et al. 2007b). This was interpreted as a signature of the plasma heating up to transition region and coronal temperatures; the mass contained in these disappearing spicules is sufficient to account for the mass present in the corona.
Capturing the fine spatial scales and rapid temporal evolution of the chromosphere and transition region plasmas represents a considerable observational and technical challenge. Nonetheless, recent significant improvements on instrumentation and image processing has been achieved both from ground (e.g., \opencite2006A&A…454.1011P, \opencite2008SoPh..251..533R, \opencite2007ASPC..368…65D) or spaceborne instruments (e.g. \opencite2007PASJ…59S.655D), reaching in all cases spatial resolution under 1′′ for plasmas at chromospheric regimes. Reaching these resolution on the TR involves the use of strong UV lines, accessible only above the Earth’s atmosphere.
The Very high Angular resolution ULtraviolet Telescope (VAULT, \opencite2001SoPh..200…63K), a sounding rocket payload, is the only instrument that has observed this critically important layer of the solar atmosphere at such high resolution. VAULT is specifically designed to obtain high spectral purity, zero dispersion spectroheliograms in the Lyman- (1216 Å) resonance line of hydrogen. This emission line emanates from plasmas at 8000 to 30000K [Gouttebroze, Vial, and Tsiropoula (1986)]. The Ly radiation directly maps the dominant energy loss from plasmas at these temperatures which correspond to the lower TR [Fontenla, Reichmann, and Tandberg-Hanssen (1988)]. This instrument is the latest in a long and distinguished line of solar optical instruments obtaining observations in the Ly emission line [Purcell and Widing (1972), Prinz (1974), Bartoe and Brueckner (1975), Bonnet et al. (1980)]. The VAULT observations are the highest quality UV observations of the solar atmosphere ever obtained and are a considerable improvement over previous instruments. Each rocket flight obtained observations with observable structures of spatial scale, exposure times of 1 second with a 17 second cadence and a 355′′235′′ instantaneous field of view (FoV).
The VAULT data and, more recently, the Hinode/SOT observations have invigorated the debate about the nature of the solar Transition Region. Not surpsingly, Ly telescopes are planned for the upcoming Solar Orbiter mission, and, possibly, the proposed Solar-C mission. It is therefore, an appropriated time for a review of the VAULT observations. We believe that as a trailblazer project in the exploration of the upper chromosphere-corona interface, the VAULT experiences will be a useful reference for the instrument design and science operations for those missions. We also take this opportunity to present the final calibration of the data and introduce the project website where all the data are publicly available. This paper presents a detailed examination of the Ly structures near the base of the solar corona obtained during the second flight of the payload (hereafter, VAULT-II). We are specifically concerned with those plasmas whose temperatures lie between 8 000 and 30 000K, ranging roughly from 2 000 km to 60 000 km above the photosphere.
The paper is organized as follows. Section \irefs:calib describes the latest instrument calibration and the observations from the second VAULT flight. Section \irefs:ly summarizes the importance of the Ly in the frame of Coronal and TR models. Section \irefs:inten discusses the sources of Ly emission as determined in the VAULT images. Sections \irefs:prom, \irefs:qs, \irefs:spicules focus on, respectively, prominences, Quiet Sun, and spicules. We discuss our findings and conclude in Sections \irefs:dis-\irefs:con.
2 Data Analysis and Observations\ilabels:calib
VAULT has been successfully launched twice (May, 7, 1999 and June, 14, 2002). Using the experience from the first flight [Korendyke et al. (2001)], the instrument performance during the second flight was improved by using a higher transmission Ly filter (higher throughput) and better filtering of the power converter output (lower noise/higher quality data). So we concentrate on the VAULT-II images for the remainder of the paper.
VAULT-II was flown on June 14, 2002 from White Sands Missile Range onboard a Black Brant sounding rocket. The observations took place around the apogee of the parabolic trajectory while the rocket was above 100 km. This minimum altitude was chosen to minimize absorption effects from the geocorona [Prinz and Brueckner (1977)]. The duration of science operations was sec and the rocket peaked at an altitude of 182 miles (294 km). The entire flight, from launch to recovery, lasted 15 minutes.
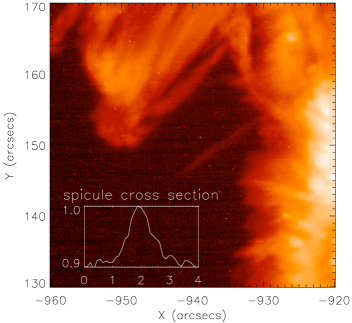
fig:resolution
2.1 VAULT-II Observations \ilabels:obs
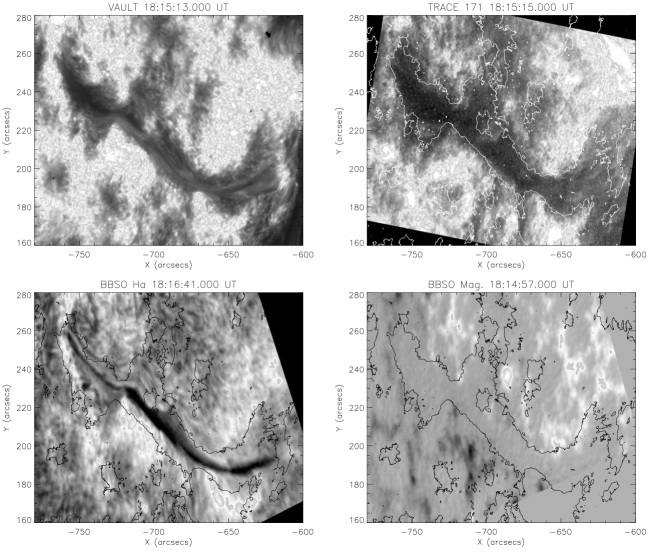
VAULT-II obtained 21 images from 18:12:01 to 18:17:47 UT with a cadence of 17 seconds. The integration time was 1 second for all frames except for a 5-sec image (the 2nd in the series, not shown here). The target was an old active region complex near the east limb which included NOAA regions 9997-9999, Quiet Sun, filaments, plage and the limb.
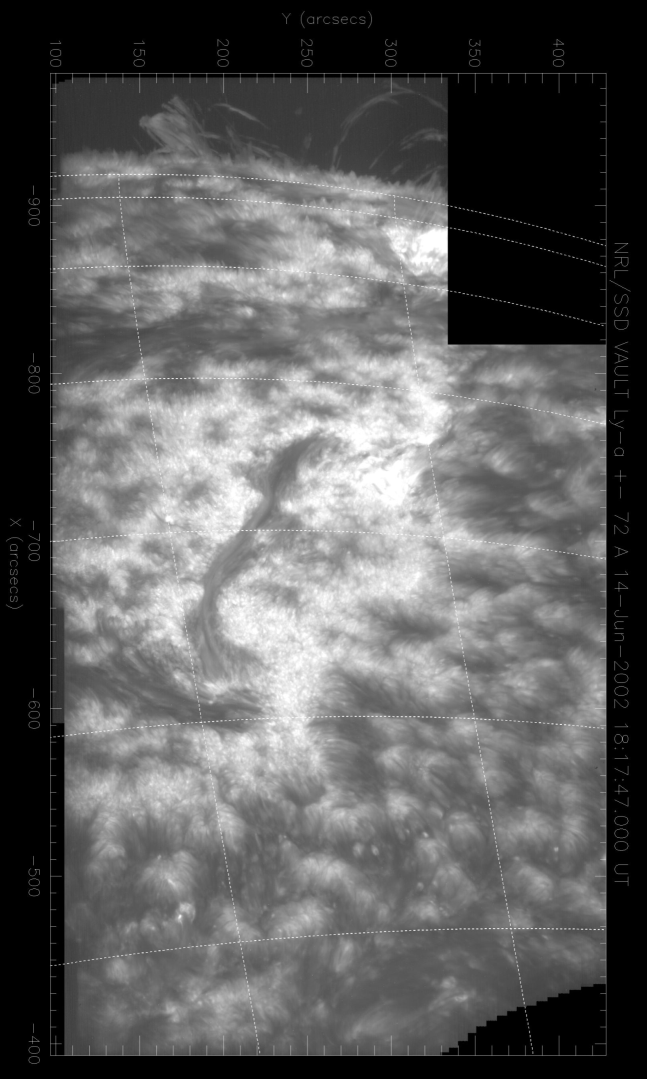
Figure \ireffig:composite is a composite image of all VAULT-II frames. The composite field of view (FOV) covers nearly 10% of the total visible solar disc area. To investigate possible center-to-limb variation [Miller, Mercure, and Rense (1956)] we have calculated the radial median intensity of non-active region areas (excluding plage region, prominences, flaring regions). We do not find any significant center-to-limb gradient in agreement with Curdt et al. (2008).
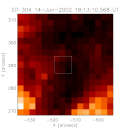
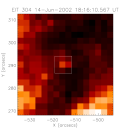
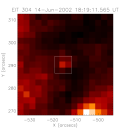
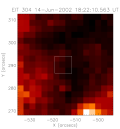
The VAULT flight was supported by several other instruments. All corresponding data (see table \ireftab:JOP) are available online or per request.
All VAULT data are publicly available online in FITS format and compatible with SolarSoft mapping routines. The images are interaligned, the dark level is subtracted and an ad-hoc synthetic flat-field is also created and provided with the data, but not applied on the online set. The flat-field is generated by retrieving the median (in time) pixel value as the solar image moves during the observations. It therefore accounts for flatfield and scattered light. Intensities are left in DN.
To improve the visibility of faint, small scale structures, we have
applied a wavelet enhancement technique
Stenborg, Vourlidas, and
Howard (2008). This method decomposes the image into
frequency components (scales). The frequency decomposition is achieved
by means of the so-called a-trous algorithm. With this method we can
then obtain an edge-enhanced version of the original image by
assigning different weights to the different scales upon
reconstruction. We note that the aforementioned decomposition does
not create orthogonal components, and therefore the reconstruction
does not conserve the flux. It is also possible to retain the
low-scale information by adding a model background image. Both
processed data, with and without the model are freely available in the
VAULT website. The level 0.9 VAULT-II data, together with the
IDL-SolarSoft routines, composite full field image, flat-field and
wavelets processed data are available under:
http://wwwsolar.nrl.navy.mil/rockets/vault/
| Telescope | Channel | co-temporal time serie |
|---|---|---|
| SOHO | MDI/EIT/CDS | EIT-304 Å partial FoV |
| TRACE | 171, WL,1600 | 171 Å, partial FoV |
| BBSO | H,Ca,BLOS,WL | H, partial FoV |
| Kitt-Peak | Mgram | Photospheric magnetogram |
2.2 Spatial resolution \ilabels:spatial
The rocket pointing accuracy was arcmin with exceptional pointing stability of 0.25′′peak-to-peak over 10 sec. To obtain the solar coordinates, rotation relative to solar North, and pixel size for the VAULT-II images we used TRACE Ly images taken only minutes apart from the VAULT images. Figure \ireffig:align shows the alignment results. The resulting VAULT pixel size is 0.125′′0.110′′ which is in excellent agreement with the optical design expectations Korendyke et al. (2001). During the flight, a small thermal expansion of the spectrograph structure relative to the primary mirror resulted in an apparent pointing drift which was variable but less than 3 pixels/second. If it was uniform during the flight, this drift would place a conservative lower limit on the instrument resolution of (0.375′′/pixel). However, we could visually identify smaller structures (always in absorption on disk) in several images. To better estimate the actual image resolution we measured the FWHM of the smallest structure we could find in the images. We used the median cross section along the 110-pixel length of the thinnest spicule, located at the center of Figure \ireffig:resolution (right), and fitted it with a Gaussian. The , where is the standard deviation of the fitted gaussian profile. This leads to a VAULT-II resolution . However, the upper limit may be dictated by opacity effects rather than instrumental ones.
The photometric calibration of the instrument was originally determined from the observations during its first flight in May 1999. The calibration factor from digital units (DNs) to intensity (ergs s-1 cm2 sr-1) was deduced by comparing the average emission (in DNs) of an area of the Quiet Sun to the Quiet Sun intensity obtained by Prinz (1974). This was a reasonable assumption since both observations were made at similar phases of the cycle; the majority of the VAULT I field of view contained Quiet Sun and the \inlinecite1974ApJ…187..369P measurements are well calibrated ().
A comparison to SUMER Ly- observations was made to improve on the radiometric accuracy of our measurements. The first issue was the spectral purity of the signal. The VAULT gratings transmit solar light in the range of Å. In this range there are only few relatively bright lines, the brightest of which is Si iii at 1206.51Å. SUMER Quiet Sun spectra show that almost all (%) of the emission in this range comes from the Ly- (assuming a rectangular filter). Concerning the spectral purity on the full range above 120 nm, our calculations show that the signal should be 70% pure.

Since the SUMER instrument has a photon counting detector with no dark signal, there is no background to be removed from the SUMER data. To establish the comparison with SUMER we assumed that the normalized radiance frequency distributions over quiet-Sun areas produced with data from the two instruments should be equal or very similar to each other. To account for the different spatial resolution we have also computed the radiance frequency distributions after convolving the VAULT data with a 2-D Gaussian function (of 12 pixel=1.5′′ FWHM, equal to the SUMER spatial resolution) and binning over pixels to yield the SUMER pixel size of . The comparison revealed that a low level signal of about DN s-1 needs to be removed from the VAULT images to bring them in accordance to the SUMER measurements (Figure \ireffig:sumer. After a careful examination of the VAULT-II images, we found a noise pattern of DN s-1 which is variable from image to image and cannot therefore be removed with the dark current subtraction. We have traced the source of the noise to interference from a faulty ground when the payload is switched to battery power.
The final step is a comparison of the Quiet Sun level in our images with an average Quiet Sun radiance measured at Earth as we did for the first flight. For the VAULT Quiet Sun level we used the peak of the histogram of the image intensities (in DN s-1) minus the 83 DNs of the background signal. The Quiet Sun level was DN s-1. The SUMER average Ly radiance on the Quiet Sun in 2008 was W m-2 sr-1. This is well within uncertainties with the \inlinecite1974ApJ…187..369P measurement of W m-2 sr-1. We adopt the latter value for consistency with our VAULT-I results and because it was obtained about two years after maximum and may better compare with our 2002 data. In this case, we derive a calibration factor of 1 DN s-1 = W m2 sr-1.
3 The interpretation of the Ly emission \ilabels:ly
The hydrogen Lyman- line, the strongest line of the solar spectrum, is a - doublet resonant line at 1215.67Å. The FWHM of the line core is very broad (Å ) due to Stark and Doppler broadening and the high optical thickness. The line center probably forms in the lower TR ( K; \opencite1981ApJS…45..635V) while the wings form in the chromosphere ( K) by partial redistribution of the core emission. Thus, the Ly line plays a critical role in the radiation transport in the chromosphere/TR interface. Below 8000 K, model calculations show that the line is very close to detailed balance. For temperatures between approximately 8000 and 30000 K, the dominant energy loss is through Ly emission. For temperatures higher than about 30000 K, Ly is transparent Gouttebroze (2004). The physics of this line have been explored in a number of papers Vernazza, Avrett, and Loeser (1981); Gouttebroze, Vial, and Tsiropoula (1986); Woods et al. (1995); Fontenla, Avrett, and Loeser (2002); Gouttebroze (2004) , and the average full-Sun line profile and its variation over the solar cycle has been measured by the SUMER instrument Lemaire et al. (2004) but most deal with the spectral characteristics and are of more interest to spectroscopic analysis. On the contrary, VAULT data consist of the integrated line intensity over a wide bandpass which includes contributions from other lines such as Si iii, N i, N v, and C iii. Because of the complexity of the line, model calculations are the easiest way to interpret imaging observations. Past analysis was based on plane parallel radiative transfer models using the Ly contrast (the ratio of the Ly emission of a structure relative to the average Quiet Sun) to derive estimates of pressure and temperature within the observed structures Bonnet and Tsiropoula (1982); Tsiropoula et al. (1986). Recent computational and theoretical improvements have enabled the calculation of the emission from models with more realistic cylindrical geometries Gouttebroze (2004) and therefore direct comparison with observed Ly intensities Gunár et al. (2006); Patsourakos, Gouttebroze, and Vourlidas (2007). However, calculations from the latter models remain time-consuming and difficult to apply over the wide range of structures seen in the VAULT images. Since the scope of our paper is to present a broad overview of the Ly atmosphere, we return to the plane parallel assumption and adopt the approach of \inlinecite1986A&A…167..351T to estimate physical paramaters for the structures in our images. More careful analyses of specific features will be undertaken in the future.
The calculations in \inlinecite1986A&A…154..154G require the calculation of the ratio of the intensity of a given structure over the average intensity over the solar disk or “Ly relative intensity” (LRI). Since we do not have full disk images in Ly we cannot compute directly a solar disk average. However, the disk emission is dominated by the Quiet Sun (Figure 5 in \opencite1974ApJ…187..369P) and we therefore need only to calculate the Quiet Sun level. Thanks to the large FOV, the VAULT images contain large Quiet Sun areas. So, we use the median of the lower part of the FoV in Figure \ireffig:composite as the ”Quiet Sun” level. We then calculate the LRI range for several representative features.
The results are shown in Table \ireftbl:meas. The corresponding pressure, temperature and optical thicknesses derived from \inlinecite1986A&A…154..154G are also included. The numbers suggest that most solar structures are optically thick in Ly even at temperatures departing significantly from chromospheric ones ( K). Quiet Sun emission seems to arise at the chromosphere while plage, prominence and offlimb structures have lower TR temperatures and are presumably located at larger heights. These results are in agreement with the earlier measurements of \inlinecite1986A&A…167..351T except of the minimum LRI values. \inlinecite1986A&A…167..351T reported values as low as 0.05 but do not observe LRI below about 0.2 anywhere but at the edges of offlimb loops. The difference is most likely due to higher sensitivity and spectra purity of the VAULT instrument which should increase the detected counts of the fainter structures and minimize the continuum contribution to the Quiet Sun levels relative to past instruments. The faintest structures (LRI ) seen in the VAULT images are long, thin strands seen in absorption against the network. These strands are also the smallest resolved structures with the lowest temperatures (Table \ireftbl:meas). They are very similar to chromospheric filaments but they do not seem to be associated with any large scale structure. Their origin is currently a mystery but they could be cooling loops. The best candidates for optically thin emission are the offlimb loops seen in the northeastern edge of the VAULT FOV. The observed LRI range of 0.4–0.5 could be consistent with either chromospheric ( K) or TR emission. These loops were not detected in the BBSO H images and thus we selected the higher temperature solutions (TK) for them.
| Structure | Intensity | Radiance | Opt. Depth | T | Pressure |
|---|---|---|---|---|---|
| [LRI]† | [K] | [dyn/cm2] | |||
| Quiet Sun | 0.5 — 5 | 3.3 — 32.5 | 4 — 5 | 8 — 10 | 0.1 — 1 |
| Quiet Sun Prom. | 0.2 — 1.4 | 1.8 — 9.5 | 6 — 3 | 7 — 9 (20)* | 1 (0.1)* |
| Plage | 5.7 — 12 | 37.5—75.0 | 4 | 10—13 | 1 |
| Plage Prom. | 1—5 | 6.7—32.5 | 3—0 | 8—40 | 0.1—1 |
| Offlimb Prom. | 0.8—1.1 | 5.8—7.8 | 3—0 | 15—80 | 0.1—1 |
| Offlimb Loops | 0.4—0.5 | 2.8—3.8 | 0 | 30—40 | 0.1 |
* Likely to have reduced optical thickness. High values reflect underlying plage.
Ly relative intensity (LRI). LRI=1 represents median of Quiet Sun region.\ilabeltbl:meas
Table \ireftbl:meas serves as a concise description of the physical parameters of Ly structures and we will refer to it in our subsequent discussions of individual features starting the contribution of each of these features to the overall Ly intensity.
4 Sources of the Ly Intensity \ilabels:inten
Ly is a very optically thick line and results in both emission and absorption depending on the properties of the surrounding plasma. This interplay is at the region where the plasma starts to be dominated by the magnetic fields, creating a wide range of intensities. On the other hand, the strength and variability of the Ly irrandiance has important effects on Earth because it affects the chemistry of the mesosphere (e.g., ozon layer) as well as the climate on longer time scales. Only the central part of the broad spectral profile of the solar Ly emission is effective for the geo-environment. But there is a clear relationship between the central radiance of the solar Lya line and the total irradiance of the line Emerich et al. (2005).To understand changes in Ly irradiance we first need to identify the contributions of the various solar sources of this emission to the total Ly irradiance.
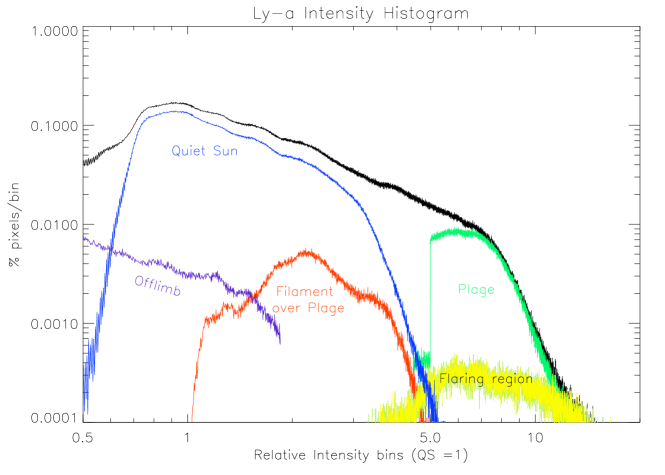
We attempt a first cut at this problem using our spatially resolved, calibrated images. As we discussed before, we are able to differentiate among Quiet Sun, Plage, Prominence over Plage, Offlimb and Flaring regions. Figure \irefhistogram shows the corresponding intensity histograms for each domains (color coded), relative to the overall histogram (black line). The values are constructed from the pixels inside each region, and considering the median value for each pixel in time (from Figure \ireffig:composite):
Quiet Sun (blue line): We select a region around the lower right corner in Figure \ireffig:composite as typical Quiet Sun. Based on this selection, the Quiet Sun covers 61% of the pixels. We use the median value of the Quiet Sun as a normalizing factor. Normalized values inside this region, however, span from 0.5 to 5. The Quiet Sun exhibits a wide range of intensities, as it can be expected by the high optical thickness and strong structuring of the plasma. The low end of the histogram reaches the edge detection of offlimb prominences, while the high end reaches the plage levels. Scattered around this Quiet Sun we find several cases of localized brightenings which may be related to explosive events, which we discuss in Section \irefs:qs.
Plage (green line): The central part of the VAULT FOV shows a bright plage. Following a similar method as for the Quiet Sun we find that the plage covers 13% of the pixels, without considering the central overlying filament. Typical normalized intensities range from 5 to 15. The only other contribution at these levels comes from the flaring region at the north edge of the image. This means that one approximation to the total solar Ly irradiance can be obtained using the Quiet Sun level adding a multiplying factor 7 for the percentage of the disc corresponding to plages (which could be obtained from other lines like Ca).
Filaments over plage (red line): Our results show that the plasmas in the filaments over the plage are sufficiently opaque to reduce the observed intensity to Quiet Sun values. This particular filament blocks the central 22% of the plage area.
Offlimb (purple line): The VAULT images contain several examples of limb structures, including spicules. As discussed later, we find higher heights for the spicules compared to H. Large overlying loops reaching projected heights of 60′′ can also be observed. The emission from these structures indeed shows Quiet Sun levels, down to our detection threshold for the histogram (0.5). It is likely that these structures are nearly optically thin, implying temperature 30,000K. The large heights imply a dynamic state for these loops and they are probably associated with catastrophic cooling episodes studied previously with TRACE Schrijver (2001).
5 Prominence and Filament Observations \ilabels:prom
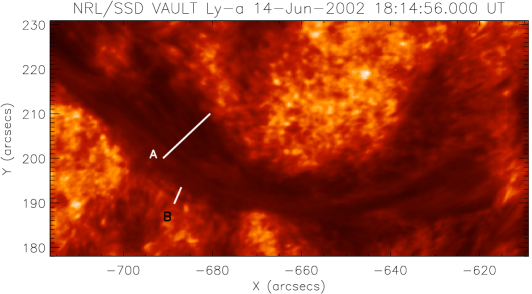
The images contain a large number of filaments, filamentary structures and a prominence and it is the first time that the fine scale structure of the filaments is resolved in this wavelength. Figure \ireffig:threads reveals a highly organized filament comprised of parallel threads with little, if any, twist. No obvious twist is evident in any of the other filaments as well. The threads have a typical width of around 0.5′′or less, and are seen as intensity enhancement profiles of about 5%. Figure \ireffig:threads also shows a stable and detached thread with a width reaching the instrument resolution and 30% absorption over the underlying plage. The filament is further analyzed in \inlineciteMillard:2009jk where the comparison with the H observations suggests that Ly traces the cool outer plasma while H originates from the coolest part of the filament. There is also evidence for uneven absorption across the filament axis. The northern side shows evidence of Ly absorption while the southern side shows absorption only in the coronal lines (171Å ) consistent with the presence of a void or cavity around the filament. The northern absorption could be understood as a line of sight effect from low-lying absorbing plasma at the filament flanks.

The last panel in Figure \ireffig:offlimb shows the size discrepancy between Ly and H observations. Only a small knot, width, of H emission is visible whereas the Ly prominence extends for almost 50′′.
6 Quiet Sun observations \ilabels:qs
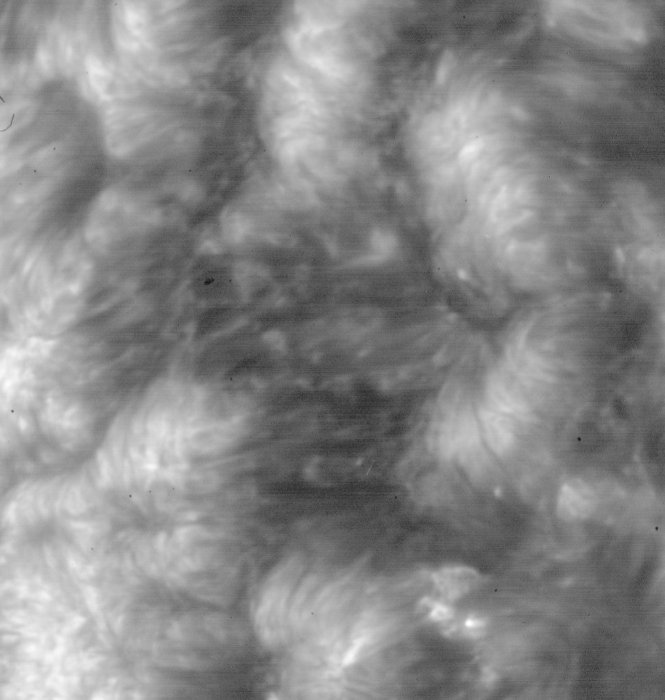
The Quiet Sun has been the testing ground for the various theories and concepts of the structure of the solar atmosphere. It is not surprising then, that it is also the area where VAULT observations have generated the most interesting results Patsourakos, Gouttebroze, and Vourlidas (2007); Judge (2008). Earlier observations showed that Ly emission is concentrated along the supergranular lanes in clumps with small loop-like extentions towards the cell interiors. Faint emission without spatial structures was detected at the cell centers. VAULT images, especially VAULT-I which covered a much larger Quiet Sun area, resolved the spatial stucture in the clumps along the supergranular boundaries (Figure \ireffig:qs). The Quiet Ly Sun area shows groupings of filamentary plasma, similar to the H rosettes, with a typical diameter of . These rosettes show filamentary structure up to resolution limit of the instrument, of about . This grouping in rosettes is stable through the observations ( min) but shows the presence of localized brightening events with a timescale variation sec and sizes of a couple of arcseconds. The network structures rise above the chromosphere about 7100 km or 10′′ as seen in Figure \ireffig:offlimb. This measured value is consistent with previously measured values of the height of the transition region above the limb. Their location at the supergranular cell boundary uniquely identifies these loops as being the byproduct of convective motion driving together magnetic fields at the edges of the supergranular cell.
The outer areas consist of short loop-like structures while the centers of the clumps have a more point-like nature. This morphology is consistent with loops of progressively higher inclination towards the center of the boundary. The obvious question is whether the more extended Ly loops are full loops or just the lower part of a larger structure, possibly extending to higher temperatures. \inlinecite2007ApJ…664.1214P applied an analysis method used for coronal loops to a detailed Ly emission model and found that the short loops at the edges of the boundary channel were consistent with full Ly loops and therefore could account for the “cool” loops predicted by models of the transition region Dowdy, Rabin, and Moore (1986). However, the magnetic footpoints of these loops could not be identified in photospheric magnetograms due to the lower spatial resolution and reduced sensitivity of the MDI data. Although these problems should not affect the larger loops, their footpoints remain ambiguous. To address these problems, \inlinecite2008ApJ…687.1388J decided to investigate the magnetic origin of the extended Ly loops using magnetic field extrapolations. They found that the longer Ly loops originate near the boundary center and are more likely the lower extensions of large scale loops that connect areas much more distant than the neighboring cells. The extrapolations showed that the smaller loops at the edge of the network lanes are indeed small scale loops supporting the interpretations of \inlinecite2007ApJ…664.1214P.
6.1 Cell Interior
Another new observation from VAULT is the imaging of Ly emission from the cell interiors for the first time. As can be seen in the example of Figure \ireffig:qs, the emission extends over the full interior area and is structured in various spatial scales. The emission is filamentary, optically thick with some apparent dependence on the local radiation field. The associated time series (movies available in the online VAULT archive) reveal significant evolution in these structures, like flows and jets. The material within the filamentary structures shows an overall motion towards the network boundary similar to the motions of emerging magnetic field elements in photospheric magnetograms and white light images. As magnetic field of opposing direction accumulates in the boundary, it is expected that some cancellation is taking place. Indeed, there are a few cases where Ly material appears to jet out from smaller emission clumps creating a bright point. These events are never seen in the cell center and could originate from magnetic reconnection closer to the photosphere. Some examples can be seen along the column at in Figure \ireffig:composite. The limited resolution of available magnetograms has not allowed us to locate the origins of these jets.

6.2 Mircoflaring in the Quiet Sun
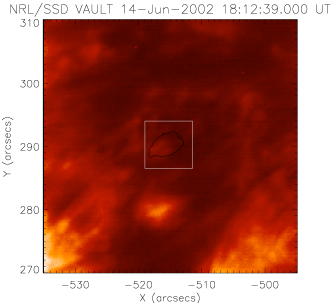
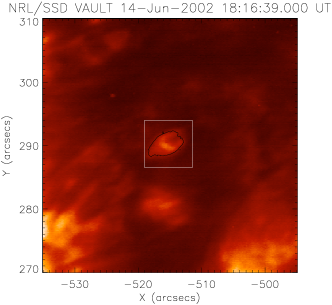
Although the VAULT time series show continuous motions and brightness evolution thoughout the full field of view, there are very few strong enhancements that could qualify as flaring emission. The short duration of the flight may be a reason for this but we were able to isolate only events. Figure \ireffig:blob shows an example from a Quiet Sun feature which gives rise to a plasma jet rising from the cell center. The brightening was detected by SOHO/EIT which classifies it as a regular bright point. The event lasts for s.
Since we have calibrated images, we could estimate the thermal energy of the Ly flaring under some assumptions. We adopted equation (5) in \inlinecite2002ApJ…568..413B
| (1) |
where the energy corresponds to Ly plasma at temperature and emission measure, integrated over volume . We assumed , , area, and equal to the mean free path of a Ly photon for optically thick emission. For the estimation of we adopted the calculations in \inlinecite2001ApJ…563..374V but used the updated photometric calibration reported here. The new calibration for VAULT is 1 DN s-1 pix-1 = cm-5. To account for integrating the energies over an area which may contain both flaring and background (likely optically thin) emission, we have subtracted the emission from the first, pre-event image from the plots. The resulting energy levels are very similar to those for coronal bright points Krucker and Benz (1998) as the EIT observation of plasma at K suggests. Unfortunately, we cannot tell whether there is any coronal emission from this bright point because it lies outside the TRACE field of view and EIT was observing solely in He i during the VAULT flight. We only report counts for the EIT light curves because there is only one wavelength available and the emission measure cannot be calculated (right axis in Figure \ireffig:blob). The VAULT and EIT curves are aligned at the pre-event emission level along the intensity axis to allow a comparison. The main conclusions from Figure \ireffig:blob are that the Ly and He ii have a similar impulsive phase and the He ii emission seems to be the extention of the cooler Ly emission. This is also in agreement with the earlier results showing a delay from cooler to hotter coronal lines and extends the detection of heating events to a much lower layer of the atmosphere.
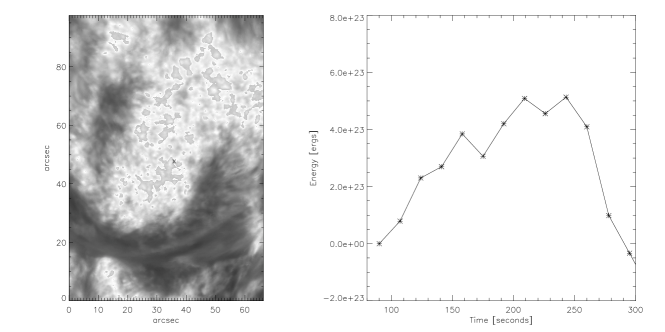
The energy estimates in Figure \ireffig:blob are in the range of microflares which seems reasonable for the lower TR. An inspection of the plage area around the filament shows fainter brightenings that could still be classified as impulsive based on their light curves. Energy estimates for those brightenings are around ergs, lower than a microflare. Figure \ireffig:blob2 shows an example of such a brightening. The energy was estimated over an area of ; all other assumptions are the same as above. Because these brightness changes are very close to the overall brightness variability of the plage, it is difficult to say with certainty that these are flaring events. A more sophisticated analysis is required but it is beyond the scope of the paper.
7 Plage and Spicules in \ilabels:spicules
The active plage has been studied in some detail using the first VAULT observations Vourlidas et al. (2001). The large degree of spatial structuring and the variability of these structures combined with the complex radiative character of Ly emission complicate the detailed analysis of the plage. The plage has clearly a different morphology than the Quiet Sun. It lacks extended loop-like structures, but contains many point-like brightenings reminiscent of the 171 Å moss. Actually the TRACE 171 Å images show moss over the majority of plage with large scale loops located only in the periphery (Figure \ireffig:4promin). As expected, the moss underlies hotter loops seen in the EIT Fe XV 284 Å images but the Ly brightness is not correlated with the degree of coronal heating above. A quick inspection of the Ly and 171 Å images in Figure \ireffig:4promin shows that despite the largely similar mossy appearance, there are several areas without a detailed correlation between corona and lower TR as noted before (e.g., region R2 in Figure 2 of \inlinecite2001ApJ…563..374V). Neutral hydrogen diffusion across field lines as proposed by \inlinecite2008ApJ…683L..87J maybe an explanation of the uniform brightness of the plage in Ly but better calculations are needed before we can establish the viability of this mechanism.
7.1 Detection of Proper Motions
A significant part of the variability seems quite random. For a given pixel, the brightness change could be due to the weakening of the emission, the lateral motion of the bright point or the appearance of dark (likely absorbing) features. We believe that these changes can be understood as the buffeting of the Ly moss by chromospheric H jets similarly to the picture proposed by \inlinecite1999SoPh..190..419D for the 171 Å moss but extending it to much smaller spatial scales.
On the other hand, we can identify coherent motions in several places. The most obvious ones can be found at or near the filament footpoints and along their backbone structure. Blobs of weakly emitting Ly seem to flow towards the lower atmosphere. At the same time, apparently upward moving blobs can be seen also at the filament footpoints as well as along the boundaries of the small network cell within the plage and basically in most locations where there is high contrast with the background.
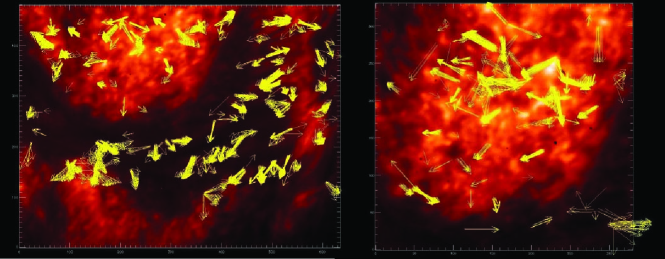
In an attempt to quantify these motions we used a local correlation method to track the blobs in time. To suppress the influence of the background buffeting motions we calculated the standard deviation, , of the intensity variability for each pixel at the peak of the emission and then considered only pixels with as inputs to the cross correlation algorithm. The large degree of variability and spatial structuring results in many correlations. So we kept only the pixel with correlation coefficients higher than 0.3 and estimated their speeds and velocity vectors. We derive speeds in the range of 5-20 km s-1 which are similar to the speeds of chromospheric fibrils and spicules (e.g., \opencite2000A&A…360..351W; \opencite2008ApJ…673.1194L). In general, the cross correlation results showed motions in all directions reinforcing the visual impressions of the large degree of randomness in the Ly structures. However, a closer inspection of the displacement vector revealed several instances of coherent motions. In the example of Figure \ireffig:motions, we can see upward motions along the western filament footpoints and the filament boundaries. There was clear evidence of counterstreaming motions along the filament. Some of those were in the upper range of our estimated speeds ( km s-1) and are very close to H measurements in filaments Engvold (1998); Lin, Engvold, and Wiik (2003). The nearby plage showed motions that followed the curvature of the filament (Figure \ireffig:motions, right panel). They may lie along thin, dark strands that are part of the filament rather than the plage. Coherent apparently upward motions were also detected at network boundaries along spicular-like structures. The most interesting results were at locations of diverging motions as can be seen towards the upper end of the field (Figure \ireffig:motions). Some were associated with moderate flare-like brightenings (right panel in Figure \ireffig:motions and Figure \ireffig:blob2) and may suggest an explosive nature for these intensity changes. It is possible that some of the TR variability seen in TR lines with coarser resolution and attributed to stationary brightenings could actually be an effect of spatial smoothing of the above mentioned flows. In other places, we found diverging vectors suggesting rotation. In the wavelet-processed movies, we see unwinding features at those areas. They are very suggestive of the so-called mini-CMEs detected recently by STEREO and associated with vortex flows at supergranular boundaries Innes et al. (2009).
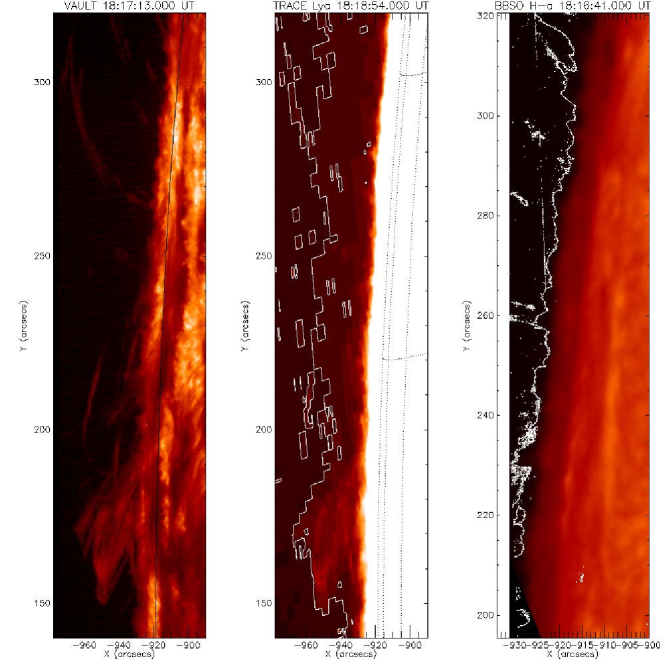
A big advantage of VAULT’s large FOV is the observation of similar structures both on disk and at the limb. An obvious candidate are the spicules. \inlinecite2009A&A…499..917K measured the dynamics of several Ly spicules and found many similarities to the H dynamic fibrils despite the short VAULT time series. Based on the TRACE co-alignement we measured Ly spicules to be in height, from VAULT spicule edge to the TRACE limb position. When we consider the co-aligned cotemporal BBSO H channel, Ly spicules can be up to ′′ higher than in the comparatively optically thinner H. Although scattered light may play a role in the ground-based observations, the height difference between Ly and H appears to be significant. These results imply that Ly spicules could be the outer sheaths of the H fibrils Koza, Rutten, and Vourlidas (2009). When we take into account similar results between H and C iv de Wijn and De Pontieu (2006) it becomes obvious that chromospheric mass is propelled to the corona via the fibrils and undergoes heating appearing in successively higher temperatures (Ly to C iv, for example). This scenario seems to corroborate the very recent results of \inlinecite2009ApJ…701L…1D where it is proposed that type-II spicules may be the means of chromospheric plasma transport to coronal levels and temperatures and may play an important role in the coronal heating problem. Further observations of both fibrils and type-II spicules are, therefore, highly desirable in Ly (in addition to chromospheric and coronal lines) to provide a more robust connection between the evolution of the chromospheric and coronal structures. For the moment, the above discussion suggests that spicules/fibrils may provide the mass heated to coronal temperatures (e.g., \opencite2007PASJ…59S.655D).
Overall, our initial attempt to characterize the variability seen in the VAULT images seems to provide reasonable results. The most serious problem is the large amount of variability in all intensity and spatial levels. We plan to revisit the analysis of proper motions using our newly available wavelet-processed images which supress the background “noise” and may enhance the effectiveness of cross-correlation techinques.
8 Discussion \ilabels:dis
The VAULT data, being taken from a sounding rocket platform, do not permit long time series investigations of the Ly atmosphere. However, they do provide several tantalizing clues about the dynamics and morphology of the crucial interface of the upper chromosphere/lower TR at least for long-lived structures and for variability at a time scale of a few minutes.
The improved photometric analysis of the VAULT data combined with better Ly models show that, for wideband imaging at least, most of the emission originates from the lower TR ( K) and only the darker areas contain much chromospheric material (Table \ireftbl:meas). Therefore, Ly imaging observations are a great probe for the structure of the transition region Teriaca et al. (2005). It seems that the Ly Quiet Sun is dominated by longer thread-like structures reminiscent of H fibrils. The VAULT observations have provoked new ideas about the nature of the TR as the region where neutral hydrogen atoms from these threads diffuse across magnetic field lines, interact with nearby electrons and subsequently excite, ionize, and/or radiate to provide the emission we see in TR lines Judge (2008). These ideas remain to be tested in detail but they demonstrate the value of sounding rocket observations.
The high spatial resolution of the VAULT data resolves a great deal of variability, mostly associated with lateral motions, in the plage. We believe that the majority of this variability can be explained as buffeting of the Ly structures by cooler material, such as H jets. In addition, the VAULT observation of spicules show that they extend higher and have larger widths but otherwise similar dynamics Koza, Rutten, and Vourlidas (2009) with their H counterparts. These observations verify past SUMER results Budnik et al. (1998) and provide significant support for an interesting idea put forth recently by \inlinecite2009ApJ…702.1016D to explain the large emission measure discrepancies between coronal and lower TR structures Vourlidas et al. (2001) as a result of EUV absorption from chromospheric material injected in the corona. When we consider these observations/ideas together; namely, the long network loops and neutral cross-field diffusion, the continuous buffeting, and the Ly jets as extension of H dynamic fibrils, we come to the conclusion that the transition region may be nothing more than the transient, evaporating part of the chromosphere rather than the stable layer in the simple 1D models, such as Vernazza, Avrett, and Loeser (1981), long favoured in our discipline. The VAULT and more recently Hinode/SOT observations are making us reassess our views on the structure of the lower solar atmosphere.
The large field of view of the instrument led to observations of basically every solar structure, with the exception of coronal holes, which enabled us to estimate the contribution of various Ly sources to the observed intensity and thereby introducing the first empirical segmentation of Ly irradiance to its sources (Sec. \irefs:inten). We found that Quiet Sun features can have intensities several times the intensity of the average Quiet Sun and that filaments exhibit both absorption and emission in Ly. The latter can be as bright as weak bright points. Optically thin structures, up to 50% fainter than the average Quiet Sun may exist in the center of cell interiors and as off limb loops. We did find that high temperatures are likely in off-limb Ly loops which may explain their large heights (, corresponding to km) in the VAULT images. We also found that active region filament partially absorbs plage emission, by around 20% to 30%, and this effect may need to be considered carefully in irradiance studies. These segmentation results may be useful to irradiance studies until a full disk Ly imaging becomes available.
The VAULT images provide the first ever unambiguous Ly imaging of the fine structure of filaments/prominences and show that both emission and absorption takes places along the prominence backbone. It is interesting to note, that the underlying plage is visible through several locations along the prominence suggesting that Ly is optically thin and that the distribution of hydrogen is highly anisotropic through these structures. It is also clear that the Ly filament is larger than the H one Millard, Vial, and Vourlidas (2009) and is likely to reach a higher altitude. The high LRI measurements in the filaments (up to 5, Table \ireftbl:meas) are again consistent with a decreased optical thickness, even to the point of being optically thin. According to \inlinecite1986A&A…154..154G and their Figure 5, a very hot temperature of K is also possible. For this study we have chosen the cooler more plausible solution of the curve. Nevertheless, with the lack of other observational constraints, it remains unsolved whether the hot solution is possible. One approach would be a point-to-point correlation with other chromospheric-TR lines. This calls for a high-resolution spectrograph which is not currently available in space.
VAULT images also reveal a wealth of activity in both the plage and the Quiet Sun regions. In the latter, we see evidence of braiding in the loop structures outlining the cell boundaries. However, we do not see any direct unambiguous evidence of reconnection as would be expected from such activity. It may be that longer time series are needed to evidence such events. Alternatively, a mixture of cool absorbing structures propagating alongside these loops may create the appearance of braiding. Those structures may be the same absorbing structures that create the buffeting motions in the plage. On the other hand, we see frequent brightenings and even jets in the interior of the cells. This is the first time that the Ly emission from these areas has been imaged and the amount of observed activity was unexpected. The brightenings seem to be associated with the emergence of magnetic field elements and their subsequent movement towards the cell boundary. These motions are regularly seen with sub-arcsecond resolution magnetographs (e.g., SOUP instrument, \opencite1989ApJ…336..475T) but we did not have any available during the flight. The relation between the emerging flux and the Ly brigtenings remains to be confirmed in a future flight but if it is true it suggests that the effects of even such small magnetic elements reach substantial heights in the solar atmosphere. We wonder whether some of those jets are the Ly counterparts of the Type II spicules seen in the SOT observations de Pontieu et al. (2007a).
Another rather surprising observation is the relative scarcity of microflaring events. We have been able to identify a handful in the five minutes of observation. These have been previously identified by \inlinecite1998A&A…336.1039B. They suggest a possible link with atmospheric turbulence. In our observations we have observed them in both active regions and Quiet Sun regions. The largest of them had a light curve and energy consistent with a microflare and was detected in He ii as well (Figure \ireffig:blob). Others had energies in the range of ergs. Although the short duration of the observation does not allow proper statistics for the occurrence of these events, our field of view covers a substantial part of the solar disk. Therefore, it seems unlikely that microflares are a common occurrence in this temperature range.
9 Conclusions \ilabels:con
We conclude our overview of Ly imaging observations with a set of “lessons learned” that may be useful in the design of future Ly instruments or observation campaigns.
-
•
Ly is formed at the critical interface between the upper chormosphere and the low TR. Thus, imaging is very useful and the well-known difficulties surrounding the interpretation of Ly emission are not insurmountable anymore. We can rely on models to derive reasonable physical parameters for the observed structures.
-
•
We see few Ly structures close to the instrument resolution limit of . Only absorbing (dark) features and off-limb structures (in emission) can be identified at that resolution. Most of the on-disk structures are much larger. This could be due to the high optical thickness of the line throughout these structures. In any case, this observation should be considered in the design of future Ly telescopes. Extreme resolutions may not be useful unless the instruments can spectrally resolve the line or their science objectives include absorption or off-limb features.
-
•
There is evidence of optically thin emission in many locations besides the obvious limb structures. Areas around filaments are especially interesting. This would require observations of the spectral profiles to be confirmed.
-
•
There is considerable structure and variability within the cell interiors which is probably linked to photospheric flux emergence. This is a new area for Ly studies and to understand it will require a future telescope sensitivity equal or better than VAULT.
-
•
Even if flaring activity is relatively unimportant, there is variability. Future instruments should achieve both high signal-to-noise ratio and cadence to allow the study of both.
-
•
Both types of spicules are observable and given the significant temperature range of Ly formation, observations in Ly are excellent tracers of the injection of material from the chomosphere to the oorona.
For the near future, the advent of Hinode/SOT has created a new and unique opportunity to address the nature of the transition region by combining VAULT and SOT observations of Quiet Sun structures and spicules. We plan to seek funding for refurbishment of the VAULT payload, which was damaged during its last flight, and for an underflight with SOT with the specific objectives of addressing the nature of the long Ly fibrils over the quiet network and investigate type-II spicule dynamics particularly at coronal holes. However the dynamics of the type-I spicules and macro-spicules may need longer time series due to their longer lifetimes Xia et al. (2005).
To summarize, we presented a broad overview of the morphology and dynamics of the Sun’s Ly atmosphere; an important but rarely imaged region. These were the first sub-arcsecond, high sensitivity observations of this line and, at that time, the highest resolution observations of any solar structure from space. The VAULT observations showed that Ly emission arises from every location and in every solar feature, and generated new ideas about the nature of the transition region and coronal heating. These results demonstrate the wideranging value of sounding rocket experiments despite their short observing windows.
Acknowledgements
This work is dedicated to the memories of D. Prinz, G. Bruecker, and D. Lilley whose efforts have contributed enormously to the success of the NRL sounding rocket programs. We are grateful to V. Yurchyshyn for providing calibrated BBSO H images, and to J. Cook, J. Koza, S. Martin, R. Rutten, J.C. Vial, for useful discussions and constant encouragement. The achievements presented in this paper are the product of many years of development work at the Naval Research Laboratory Solar Physics Branch and the NASA sounding rocket program. The VAULT instrument borrows heavily from the High Resolution Telescope and Spectrograph. The NRL rocket team of J. Smith, R. Moye, R. Hagood, R. Feldman, J. Moser, D. Roberts, T. Spears and R. Waymire did a superb job in preparing and launching the instrument. We would like to acknowledge the efforts of the sounding rocket support team that made the VAULT launches possible. We would like to particularly acknowledge the following individuals. Tracy Gibb did a superb job managing the launch of the VAULT payload. Frank Lau managed the development of the Mark 7 digital SPARCS attitude control system. We would like to acknowledge the SPARCS team for their superb efforts in the support of our launch. Jesus and Carlos Martinez developed and operated the Mark 7 SPARCS. Richard Garcia, Shelby Elborn and Kenneth Starr developed the VAULT telemetry section. The support from the White Sands Missile Range and Wallops Flight Facility NASROC personnel was of the highest caliber. The VAULT instrument development work has been supported by the ONR task area SP033-02-43 and by NASA defense procurement request S-84002F.
References
- Antiochos and Noci (1986) Antiochos, S.K., Noci, G.: 1986, Astrophys. J. 301, 440. doi:10.1086/163912.
- Bartoe and Brueckner (1975) Bartoe, J.D.F., Brueckner, G.E.: 1975, In: Bulletin of the American Astronomical Society, Bulletin of the American Astronomical Society 7, 432.
- Benz and Krucker (2002) Benz, A.O., Krucker, S.: 2002, Astrophys. J. 568, 413. doi:10.1086/338807.
- Berghmans, Clette, and Moses (1998) Berghmans, D., Clette, F., Moses, D.: 1998, Astron. Astrophys. 336, 1039.
- Bonnet and Tsiropoula (1982) Bonnet, R.M., Tsiropoula, G.: 1982, Solar Phys. 75, 139. doi:10.1007/BF00153467.
- Bonnet et al. (1980) Bonnet, R.M., Decaudin, M., Bruner, E.C. Jr., Acton, L.W., Brown, W.A.: 1980, Astrophys. J. 237, L47. doi:10.1086/183232.
- Budnik et al. (1998) Budnik, F., Schroeder, K.P., Wilhelm, K., Glassmeier, K.H.: 1998, Astron. Astrophys. 334, L77.
- Curdt et al. (2008) Curdt, W., Tian, H., Teriaca, L., Schühle, U., Lemaire, P.: 2008, Astron. Astrophys. 492, L9. doi:10.1051/0004-6361:200810868.
- de Pontieu et al. (1999) de Pontieu, B., Berger, T.E., Schrijver, C.J., Title, A.M.: 1999, Solar Phys. 190, 419. doi:10.1023/A:1005220606223.
- de Pontieu et al. (2007a) de Pontieu, B., McIntosh, S., Hansteen, V.H., Carlsson, M., Schrijver, C.J., Tarbell, T.D., Title, A.M., Shine, R.A., Suematsu, Y., Tsuneta, S., Katsukawa, Y., Ichimoto, K., Shimizu, T., Nagata, S.: 2007, Publ. Astron. Soc. Japan 59, 655.
- de Pontieu et al. (2007b) de Pontieu, B., Hansteen, V.H., Rouppe van der Voort, L., van Noort, M., Carlsson, M.: 2007, In: Heinzel, P., Dorotovič, I., Rutten, R.J. (eds.) The Physics of Chromospheric Plasmas, Astronomical Society of the Pacific Conference Series 368, 65.
- de Pontieu et al. (2009) de Pontieu, B., Hansteen, V.H., McIntosh, S.W., Patsourakos, S.: 2009, Astrophys. J. 702, 1016. doi:10.1088/0004-637X/702/2/1016.
- De Pontieu et al. (2009) De Pontieu, B., McIntosh, S.W., Hansteen, V.H., Schrijver, C.J.: 2009, Astrophys. J. 701, L1. doi:10.1088/0004-637X/701/1/L1.
- de Wijn and De Pontieu (2006) de Wijn, A.G., De Pontieu, B.: 2006, Astron. Astrophys. 460, 309. doi:10.1051/0004-6361:20065864.
- Dowdy, Rabin, and Moore (1986) Dowdy, J.F. Jr., Rabin, D., Moore, R.L.: 1986, Solar Phys. 105, 35. doi:10.1007/BF00156374.
- Emerich et al. (2005) Emerich, C., Lemaire, P., Vial, J.C., Curdt, W., Schühle, U., Wilhelm, K.: 2005, Icarus 178, 429. doi:10.1016/j.icarus.2005.05.002.
- Engvold (1998) Engvold, O.: 1998, In: Webb, D.F., Schmieder, B., Rust, D.M. (eds.) IAU Colloq. 167: New Perspectives on Solar Prominences, Astronomical Society of the Pacific Conference Series 150, 23.
- Feldman (1983) Feldman, U.: 1983, Astrophys. J. 275, 367. doi:10.1086/161539.
- Feldman (1987) Feldman, U.: 1987, Astrophys. J. 320, 426. doi:10.1086/165556.
- Feldman, Dammasch, and Landi (2009) Feldman, U., Dammasch, I.E., Landi, E.: 2009, Astrophys. J. 693, 1474. doi:10.1088/0004-637X/693/2/1474.
- Feldman, Dammasch, and Wilhelm (2000) Feldman, U., Dammasch, I.E., Wilhelm, K.: 2000, Space Science Reviews 93, 411.
- Fontenla, Reichmann, and Tandberg-Hanssen (1988) Fontenla, J., Reichmann, E.J., Tandberg-Hanssen, E.: 1988, Astrophys. J. 329, 464. doi:10.1086/166392.
- Fontenla, Avrett, and Loeser (2002) Fontenla, J.M., Avrett, E.H., Loeser, R.: 2002, Astrophys. J. 572, 636. doi:10.1086/340227.
- Gouttebroze (2004) Gouttebroze, P.: 2004, Astron. Astrophys. 413, 733. doi:10.1051/0004-6361:20031570.
- Gouttebroze, Vial, and Tsiropoula (1986) Gouttebroze, P., Vial, J.C., Tsiropoula, G.: 1986, Astron. Astrophys. 154, 154.
- Gunár et al. (2006) Gunár, S., Teriaca, L., Heinzel, P., Schühle, U.: 2006, In: SOHO-17. 10 Years of SOHO and Beyond, ESA Special Publication 617.
- Innes et al. (2009) Innes, D.E., Genetelli, A., Attie, R., Potts, H.E.: 2009, Astron. Astrophys. 495, 319. doi:10.1051/0004-6361:200811011.
- Judge (2008) Judge, P.: 2008, Astrophys. J. 683, L87. doi:10.1086/591470.
- Judge and Centeno (2008) Judge, P., Centeno, R.: 2008, Astrophys. J. 687, 1388. doi:10.1086/590104.
- Korendyke et al. (2001) Korendyke, C.M., Vourlidas, A., Cook, J.W., Dere, K.P., Howard, R.A., Morrill, J.S., Moses, J.D., Moulton, N.E., Socker, D.G.: 2001, Solar Phys. 200, 63.
- Koza, Rutten, and Vourlidas (2009) Koza, J., Rutten, R.J., Vourlidas, A.: 2009, Astron. Astrophys. 499, 917. doi:10.1051/0004-6361/200810710.
- Krucker and Benz (1998) Krucker, S., Benz, A.O.: 1998, Astrophys. J. 501, L213. doi:10.1086/311474.
- Landi and Feldman (2004) Landi, E., Feldman, U.: 2004, Astrophys. J. 611, 537. doi:10.1086/422169.
- Langangen et al. (2008) Langangen, Ø., Carlsson, M., Rouppe van der Voort, L., Hansteen, V., De Pontieu, B.: 2008, Astrophys. J. 673, 1194. doi:10.1086/524377.
- Lemaire et al. (2004) Lemaire, P., Emerich, C., Vial, J.C., Curdt, W., Schühle, U., Wilhelm, K.: 2004, In: 35th COSPAR Scientific Assembly, COSPAR, Plenary Meeting 35, 510.
- Lin, Engvold, and Wiik (2003) Lin, Y., Engvold, O.R., Wiik, J.E.: 2003, Solar Phys. 216, 109. doi:10.1023/A:1026150809598.
- Millard, Vial, and Vourlidas (2009) Millard, A.A., Vial, J.C., Vourlidas, A.: 2009, Astron. Astrophys., submitted.
- Miller, Mercure, and Rense (1956) Miller, S.C. Jr., Mercure, R., Rense, W.A.: 1956, Astrophys. J. 124, 580. doi:10.1086/146263.
- Ofman and Wang (2008) Ofman, L., Wang, T.J.: 2008, Astron. Astrophys. 482, L9. doi:10.1051/0004-6361:20079340.
- Okamoto et al. (2007) Okamoto, T.J., Tsuneta, S., Berger, T.E., Ichimoto, K., Katsukawa, Y., Lites, B.W., Nagata, S., Shibata, K., Shimizu, T., Shine, R.A., Suematsu, Y., Tarbell, T.D., Title, A.M.: 2007, Science 318, 1577. doi:10.1126/science.1145447.
- Patsourakos, Gouttebroze, and Vourlidas (2007) Patsourakos, S., Gouttebroze, P., Vourlidas, A.: 2007, Astrophys. J. 664, 1214. doi:10.1086/518645.
- Peter (2001) Peter, H.: 2001, Astron. Astrophys. 374, 1108. doi:10.1051/0004-6361:20010697.
- Prinz (1974) Prinz, D.K.: 1974, Astrophys. J. 187, 369. doi:10.1086/152641.
- Prinz and Brueckner (1977) Prinz, D.K., Brueckner, G.E.: 1977, J. Geophys. Res. 82, 1481. doi:10.1029/JA082i010p01481.
- Purcell and Widing (1972) Purcell, J.D., Widing, K.G.: 1972, Astrophys. J. 176, 239. doi:10.1086/151626.
- Puschmann and Sailer (2006) Puschmann, K.G., Sailer, M.: 2006, Astron. Astrophys. 454, 1011. doi:10.1051/0004-6361:20053918.
- Rutten, van Veelen, and Sütterlin (2008) Rutten, R.J., van Veelen, B., Sütterlin, P.: 2008, Solar Phys. 251, 533. doi:10.1007/s11207-008-9116-9.
- Schrijver (2001) Schrijver, C.J.: 2001, Solar Phys. 198, 325. doi:10.1023/A:1005211925515.
- Schrijver et al. (1997) Schrijver, C.J., Title, A.M., van Ballegooijen, A.A., Hagenaar, H.J., Shine, R.A.: 1997, Astrophys. J. 487, 424. doi:10.1086/304581.
- Stenborg, Vourlidas, and Howard (2008) Stenborg, G., Vourlidas, A., Howard, R.A.: 2008, Astrophys. J. 674, 1201. doi:10.1086/525556.
- Teriaca et al. (2005) Teriaca, L., Schühle, U., Solanki, S.K., Curdt, W., Marsch, E.: 2005, In: Innes, D.E., Lagg, A., Solanki, S.A. (eds.) Chromospheric and Coronal Magnetic Fields, ESA Special Publication 596.
- Title et al. (1989) Title, A.M., Tarbell, T.D., Topka, K.P., Ferguson, S.H., Shine, R.A., SOUP Team: 1989, Astrophys. J. 336, 475. doi:10.1086/167026.
- Trujillo Bueno, Shchukina, and Asensio Ramos (2004) Trujillo Bueno, J., Shchukina, N., Asensio Ramos, A.: 2004, Nature 430, 326. doi:10.1038/nature02669.
- Tsiropoula et al. (1986) Tsiropoula, G., Alissandrakis, C., Bonnet, R.M., Gouttebroze, P.: 1986, Astron. Astrophys. 167, 351.
- Vernazza, Avrett, and Loeser (1981) Vernazza, J.E., Avrett, E.H., Loeser, R.: 1981, ApJS 45, 635. doi:10.1086/190731.
- Vourlidas et al. (2001) Vourlidas, A., Klimchuk, J.A., Korendyke, C.M., Tarbell, T.D., Handy, B.N.: 2001, Astrophys. J. 563, 374. doi:10.1086/323835.
- Wilhelm (2000) Wilhelm, K.: 2000, Astron. Astrophys. 360, 351.
- Wilhelm et al. (1995) Wilhelm, K., Curdt, W., Marsch, E., Schühle, U., Lemaire, P., Gabriel, A., Vial, J.C., Grewing, M., Huber, M.C.E., Jordan, S.D., Poland, A.I., Thomas, R.J., Kühne, M., Timothy, J.G., Hassler, D.M., Siegmund, O.H.W.: 1995, Solar Phys. 162, 189. doi:10.1007/BF00733430.
- Woods et al. (1995) Woods, T.N., Rottman, G.J., White, O.R., Fontenla, J., Avrett, E.H.: 1995, Astrophys. J. 442, 898. doi:10.1086/175492.
- Xia et al. (2005) Xia, L.D., Popescu, M.D., Doyle, J.G., Giannikakis, J.: 2005, Astron. Astrophys. 438, 1115. doi:10.1051/0004-6361:20042579.