The variability of the quasar 3C 273: a radio to gamma-ray view
Abstract
We have analysed the first 15 months of Fermi/LAT data of the radio loud quasar 3C 273. Intense gamma-ray activity has been detected, showing an average flux of , with a peak at detected during a flare in September 2009. Together with the brightening of the source, a possible hardening of the gamma-ray spectrum is observed, pointing to a shift of the inverse Compton peak toward higher energies than the 1–10 MeV range in which 3C 273 inverse Compton emission is typically observed to peak. During the 15 months of observations the photon index is measured to vary between and , with an average value of . When compared to the observations at other wavelengths, the gamma-rays show the largest flux variations and we discuss the possibility that two different components are responsible for the inverse Compton hump emission below and above the MeV peak.
I Introduction
3C 273 is a bright, radio loud quasar that shares most of the characteristic properties of blazars, like strong radio emission, a jet with apparent superluminal motion, large flux variations, and, occasionally, polarisation of the optical emission (see Courvoisier et al. 1998 for a review). On the other hand, this AGN presents also characteristics more common in Seyfert galaxies, like a prominent blue bump shields78 and the signature of non-thermal Comptonisation processes in the X-ray spectrum grandi04 .
3C 273 was the first extragalactic source to be detected at gamma-rays by COS-B observations in 1976 swanenburg78 and later on was detected several times by the EGRET instrument on board the CGRO satellite vonmontigny97 . Thanks to its early discovery as a multiwavelength emitter and to its brightness, 3C 273 is one of the best observed AGN at all energies. The multiwavelength on-line database of 3C 273 (http://isdc.unige.ch/3c273/) contains about 40 years of data from radio to gamma-rays soldi08 . This set of data constitutes a very precious starting point for studying the multi-band variability of this object. In particular, with the launch of Fermi in June 2008 an intense gamma-ray monitoring of the source has started abdo09a and triggered observations along the whole electromagnetic spectrum, coordinated by several groups. This extensive and regular look at the source, together with the comparison with the historical long-term behaviour at all wavelengths, will allow us to investigate the properties and origin of the high-energy emission in greater detail than it had ever been done before.
II From radio to X-rays
II.1 The 3C 273 multiwavelength database
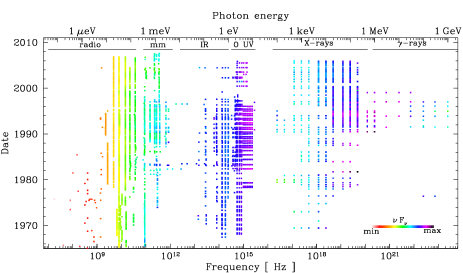
The 3C 273 database, first created in 1999 turler99 , has been recently updated with observations up to 2007 soldi08 in order to provide the community with one of the most complete multiwavelength databases for an AGN. At the time being the database contains 70 light curves covering 17 decades in energy and spanning up to 40 years of observations (Fig. 1). In addition, for the X-ray band, information about the spectral parameters used to extract the fluxes is also available. The bulk of the high-energy data has been collected in the last 10–15 years, thanks to the intense X-ray monitoring provided by BeppoSAX, CGRO/BATSE, RXTE, XMM-Newton, INTEGRAL and Swift. In the gamma-ray domain, the data collected by CGRO/OSSE and EGRET have already been included in the database, while we plan to include also results from AGILE/GRID and Fermi/LAT observations, within the upcoming months.
II.2 The variability study
As a first application of the on-line database, we studied the variability properties of 3C 273 at different wavelengths and, correlating the behaviour in the different energy bands, we tried to identify the emission processes and understand their inter-connections soldi08 .
The amplitude and the time scales of the variations of 3C 273 depend strongly on the frequency and show trends that are characteristic of the underlying emission processes (Fig. 2). For example, the increasing amplitude of the variations and the decreasing time scales when going from long radio to short millimeter wavelengths is the typical signature of the superposition of synchrotron flares from shock waves propagating along the jet.

The different variability properties in the X-rays below and above 20 keV seem to support the possibility of two separated emitting components, possibly non thermal Comptonisation (as in Seyfert galaxies) and inverse Compton from the jet (as in blazars). As an alternative, a single component characterised by at least two independently varying parameters could also explain the X-ray timing properties.
In any case, the dominant hard X-ray () emission is most probably not due to electrons accelerated by the shock waves in the jet as their variability does not correlate with the flaring millimeter emission at short time lags (Fig. 3). Instead, the hard X-rays seem to be associated to long-timescale variations in the optical domain. This optical component is consistent with being optically thin synchrotron radiation from the base of the jet and the hard X-rays would be produced through inverse Compton processes (synchrotron self-Compton and/or external Compton) by the same electron population.

In the gamma-ray domain, the limited data available before AGILE and Fermi observations did not allow to draw a firm conclusion about the variability in the MeV-GeV energy range. The increase of the variability amplitude observed in the X-rays seems to continue up to the gamma-rays, possibly even above 100 MeV where the observed decrease is likely due to the large uncertainties of the EGRET fluxes (circles in Fig. 2).
III The gamma-ray emission
III.1 Before Fermi
During CGRO/EGRET observations, 3C 273 was either found below the EGRET sensitivity level, or detected at a relatively low gamma-ray flux, with an average flux of , between 1991 and 1995, and a maximum detected flux of in 1997 collmar00 . The EGRET average spectrum has a power law shape with photon index , but variations of the spectral slope have been observed, with the spectrum hardening while the source brightened vonmontigny97 ; collmar00 . A flux variability by a factor of 4 within one week is the most extreme behaviour observed for 3C 273 at gamma-rays by EGRET collmar00 . Multiwavelength campaigns have been carried out simultaneously to the the gamma-ray observations in 1993–1995 and showed that the emission detected by EGRET can be equally well explained with synchrotron self-Compton (SSC), external Compton (EC) or proton-initiated cascade (PIC) models vonmontigny97 .
During the first year of observations, AGILE/GRID has detected 3C 273 with an average flux of , consistent with EGRET measurements pittori09 . During the multiwavelength campaign of December–January 2008, the source was detected only during the second week of observations at a flux of pacciani09 . The hard X-ray to gamma-ray emission is modeled as external Compton radiation on thermal disc photons, and the variability of this high-energy component is consistent with an acceleration phase of the electron distribution that moves the inverse Compton peak to higher energies.
III.2 Fermi/LAT data analysis
The Fermi satellite, launched in June 2008, carries two instruments able to observe the gamma-ray sky: the Large Area Telescope (LAT), a pair conversion gamma-ray telescope sensitive to gamma-rays from 30 MeV to 200 GeV atwood09 ; and the GLAST Burst Monitor (GBM), observing the sky in the 8 keV to 30 MeV energy range meegan09 . The main instrument LAT is 10 times more sensitive than its predecessors CGRO/EGRET and AGILE/GRID and, thanks to its large field of view of , it can scan the full sky every 3 hours. Already after the first 3 months of observations, the LAT had detected 205 objects with high-confidence, of which 106 are AGN abdo09a ; abdo09b , including 3C 273.
We analysed the Fermi/LAT data collected during the first 15 months of observations, between August 10, 2008 and October 19, 2009. We first downloaded the 0.1–300 GeV light curve of 3C 273 provided through the Fermi Monitored Source List Light Curves page111http://fermi.gsfc.nasa.gov/ssc/data/access/lat/msl_lc/, selected only the detections on daily basis and rebinned the light curve to 3-day bins. We then performed the analysis on each of these 3-day time intervals selecting the event data with the gtselect tool distributed as part of the Fermi-LAT ScienceTools (version 9.15.2). For each bin (corresponding in average to an integration time slightly smaller than 200 ks), the count map and exposure map were generated.
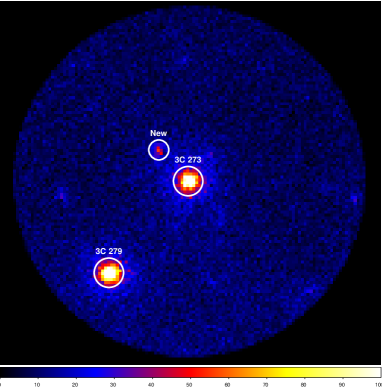
For source detection and flux estimate, we used the gtlike tool, based on a maximum likelihood algorithm. For a region of interest (ROI) of 15∘ around 3C 273, a model containing the isotropic and Galactic diffuse background models (as given by default) and all the sources in the field was fitted to the data. For the field and data analysed, beside 3C 273 two additional sources were considered: the blazar 3C 279 and the unidentified source at , (Fig. 4). All the sources have been modeled with simple power laws in the energy range 0.1–200 GeV, in order to obtain their spectral parameters and test statistic, TS. We note that for each source the square root of TS provides an approximate estimate of the detection significance.
Following abdo09a , we added 3% systematics to the uncertainties on the estimated fluxes.
III.3 Fermi/LAT preliminary results
Figure 5 shows the results obtained during the first 15 months of observations. In the selected time intervals analysed, 3C 273 was always detected with . Since the launch of Fermi, 3C 273 has undergone several episodes of very intense gamma-ray activity. The average flux above 100 MeV, , is significantly larger than the historical measurements of EGRET, with a peak flux of detected during a large flare in September 2009. The amplitude of the variations, (quantified through the fractional variability amplitude; see soldi08 for more detail), measured by Fermi, is consistent with the EGRET one at 100 MeV, but it is significantly larger above 100 MeV, confirming the increasing trend of already observed in the X-ray domain (Fig. 2). The decrease of observed with EGRET above 100 MeV was likely due to its limited sensitivity. In addition, the amplitude of the variations measured in the gamma-rays by Fermi is the highest across the whole electromagnetic spectrum, confirming the extreme variability nature of the gamma-ray emission.

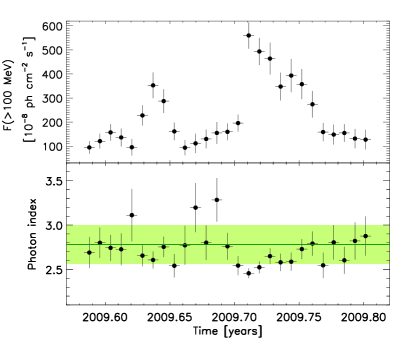
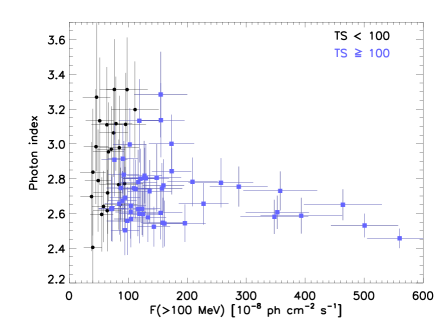
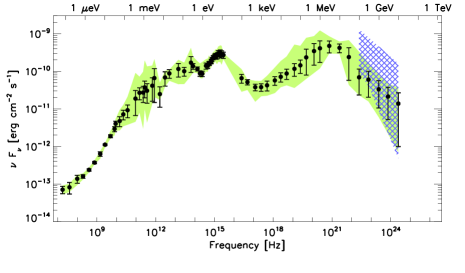
The bottom panel of Figure 5 shows the evolution of the gamma-ray photon index during the LAT observations. The photon index varies between and , with an average value of . In general, the variations of the spectral slope do not seem to be significant, when the uncertainties are taken into account, with the exception of a decrease of the photon index when the source brightened during the last 3 months of observations (Fig. 6). In fact, when plotting the photon index versus flux, the source behaviour “harder when brighter” is clearly observed (Fig. 7): when 3C 273 was brighter than , the photon index was always smaller than 2.8. The same effect was observed also in EGRET data during two flares of 3C 273 vonmontigny97 ; collmar00 and seems to be a common behaviour of the gamma-ray emission of blazars (see for example 3C 454.3 and AO 0235+164; lott09 ; escande09 ). As proposed by Pacciani et al. (2009) to explain the gamma-ray variability observed with AGILE, the inverse Compton peak might be shifted toward higher frequencies following an accelaration episode of the electron population. Since the inverse Compton peak of 3C 273 usually falls in the 1–10 MeV range johnson95 ; vonmontigny97 (Fig. 8), a shift toward higher energies could indeed produce a harder spectrum in the LAT energy band.
IV The inverse Compton peak
Gamma-ray observations of 3C 273 are essential to constrain the overall shape of the inverse Compton branch and to better understand the connection between the jet emission in different energy domains. The most recent radio to gamma-ray campaigns carried out on this object, together with the numerous ones performed in the past, provide a large set of data to model the spectral energy distribution (SED) during several epochs and with different integration times (the average SED in Fig. 8).
Multiwavelength campaigns performed during EGRET observations could not discriminate between the most common models used to describe the high-energy emission of blazars vonmontigny97 . A different variability behaviour below and above suggested that two different mechanisms are responsible for the emission in the MeV and in the EGRET domain, with the latter one being most likely produced by inverse Compton scattering of accretion disc photons collmar00 . On the other hand, the different variability of the hard X-rays and gamma-rays detected by INTEGRAL and AGILE has been explained by a single external Compton component shifted toward higher energies following an acceleration of the electron population, whereas a synchrotron self-Compton contribution is evident at lower energies pacciani09 .
Several multiwavelength monitoring programs are on-going to follow the evolution of 3C 273 and many other gamma-ray sources. The preliminary results presented during the 2009 Fermi Symposium for 3C 273 indicate that there is a correlation between the gamma-ray flaring states and the brightening of the VLBI core, with gamma-ray flare following the ejection of a superluminal knot by up to 70 days jorstad09 . This would indicate that the gamma-ray high states are related to a disturbance crossing the millimeter-jet core. An increase of the radio emission at 15 GHz has been observed quasi-simultaneously to the large September 2009 gamma-ray flare, and the optical flux started also to increase in July/August 2009, but no data were available at the time of the gamma-ray flare chatterjee09 . In addition, a correlation between the small gamma-ray flare of April 2009 and the optical emission is clearly detected chatterjee09 .
As the flaring optical emission of 3C 273 is believed to be synchrotron emission related to the millimeter jet, a gamma-ray/optical correlation would support the origin of the high-energy emission in the millimeter jet and could indicate that the same electron population is responsible for both emissions through synchrotron and inverse Compton processes. On the other hand, we found the hard X-ray emission to be related rather to another optical component, varying on longer time scales, and produced as synchrotron emission further away from the millimeter jet soldi08 . Therefore, this would point to a different origin of the hard X-ray and gamma-ray emissions.
V Conclusions
Thanks to its large field of view and its unprecedented sensitivity above 100 MeV, the LAT instrument is providing us with long-term, well sampled light curves and spectral information for a large number of AGN abdo09b ; lott09 ; beckmann09 . Among them, 3C 273 is a bright quasar extensively observed at all wavelengths and showing a particularly intense gamma-ray activity since the launch of Fermi. This source was detected during the first 15 months of observations with an average flux of , corresponding to an average luminostity of , and an average photon index of . In September 2009, during a very bright flare reaching a peak flux of , the hint of a spectral hardening accompanied the brightening of the source, possibly indicating a shift of the inverse Compton peak from 1–10 MeV (as typically observed in 3C 273) toward higher energies.
When looking at the multi-band behaviour, the amplitude of the variations seems to constantly increase from the X-rays up to the gamma-rays, with the MeV-GeV range showing the largest variations along the electromagnetic spectrum. On one side the correlation of the gamma-rays with the millimeter jet and with the optical flaring component jorstad09 ; chatterjee09 , and on the other side the lack of correlation between the hard X-rays and the millimeter emission soldi08 might indicate a different origin of the high-energy emission below and above the peak of the inverse Compton hump.
An extensive correlation study and an accurate modelling of the broad band spectral energy distribution during several epochs cutini09 ; abdo09c will allow to shed more light on the origin of the gamma-rays in 3C 273 and their connection to the emission in other bands.
References
- (1) Courvoisier T. J.-L. 1998, A&A Rev., 9, 1
- (2) Shields G. A. 1978, Nature, 272, 706
- (3) Grandi P. & Palumbo G. G. C. 2004, Science, 306, 998
- (4) Swanenburg B. N., Hermsen W., Bennett K., et al. 1978, Nature, 275, 298
- (5) Von Montigny C., Aller H., Aller M., et al. 1997, ApJ, 483, 161
- (6) Soldi S., Türler M., Paltani S., et al. 2008, A&A, 486, 411
- (7) Abdo A. A., Ackermann M., Ajello M., et al. 2009, ApJ, 183, 46
- (8) Türler M., Paltani S., Courvoisier T. J.-L., et al. 1999, A&AS, 134, 89
- (9) Collmar W., Reimer O., Bennett K., et al. 2000,A&A, 354, 513
- (10) Pittori C., Verrecchia F., Chen A. W., et al. 2009, A&A, 506, 1563
- (11) Pacciani L., Donnarumma I., Vittorini V., et al. 2009, A&A, 494, 49
- (12) Atwood W. B., Abdo A. A., Ackermann M., et al. 2009, ApJ, 697, 1071
- (13) Meegan C., Lichti G., Bhat P.N., et al. 2009, ApJ, 702, 791
- (14) Abdo A. A., Ackermann M., Ajello M., et al. 2009, ApJ, 700, 597
- (15) Lott B. 2009, these proceedings, AGNs with the Fermi-LAT: what we have seen
- (16) Escande L. & Lott B. 2009, these proceedings, Spectral properties of bright Fermi detected blazars in the gamma-ray band
- (17) Johnson W. N., Dermer C. D., Kinzer R. L., et al. 1995, ApJ, 445, 182
- (18) Jorstad S., Marscher A., D’Arcangelo F. & Harrison B. 2009, these proceedings, Connection between gamma-ray variations and disturbances in the jets of blazars
- (19) Chatterjee R., Bonning E. W., Bailin C., et al. 2009, these proceedings, Multi-waveband variability of eight blazars in the first year of observations with Fermi
- (20) Cutini S. Giommi P., Gasparrini D., et al. 2009, these proceedings, Analysis of the spectral energy distributions of Fermi bright blazars
- (21) Beckmann V., Ricci C. & Soldi S. 2009, these proceedings, Fermi detected blazars seen by INTEGRAL, [arXiv:0912.2254]
- (22) Abdo A. A., Ackermann M., Ajello M., et al. 2009, submitted to ApJ, [arXiv:0912.2040]