On the nuclear obscuration of H2O maser galaxies
Abstract
To shed light onto the circumnuclear environment of 22 GHz ( 1.3 cm) H2O maser galaxies, we have analyzed some of their multi-wavelength properties, including the far infrared luminosity (FIR), the luminosity of the emission line, the nuclear X-ray luminosity, and the equivalent width of the neutral iron emission line (EW (Kα)). Our statistical analysis includes a total of 85 sources, most of them harboring an active galactic nucleus (AGN). There are strong anti-correlations between EW () and two “optical thickness parameters”, i.e. the ratios of the X-ray luminosity versus the presumably more isotropically radiated and far infrared (FIR) luminosities. Based on these anti-correlations, a set of quantitative criteria, EW ()300 eV, 2 and 600 can be established for Compton-thick nuclear regions. 18 H2O maser galaxies belong to this category. There are no obvious correlations between the EW (Kα), the luminosity and the isotropic H2O maser luminosity. When comparing samples of Seyfert 2s with and without detected H2O maser lines, there seem to exist differences in EW (Kα) and the fraction of Compton-thick nuclei. This should be studied further. For AGN masers alone, there is no obvious correlation between FIR and H2O maser luminosities. However, including masers associated with star forming regions, a linear correlation is revealed. Overall, the extragalactic FIR-H2O data agree with the corresponding relation for Galactic maser sources, extrapolated by several orders of magnitude to higher luminosities.
1 Introduction
Thanks to a large number of dedicated surveys during the last 15 years, the number of galaxies known to host 22 GHz (1.3 cm) H2O masers has increased tenfold and 85 sources at distances larger than those of the Magellanic Clouds have been reported so far to exhibit H2O maser emission (e.g., Braatz & Gugliucci 2008, Darling et al. 2008, Greenhill et al. 2008). Some of them are AGN-related, while others are found in off-nuclear star forming regions. Among the masers clearly identified as AGN-related, a large fraction (40%) have been identified as “disk-maser” candidates (Kondratko et al. 2006). Their maser spots are associated with central, typically parsec sized molecular accretion disks and maser line spectra show “high velocity features” (red-shifted and blue-shifted features), in addition to the systemic velocity components. The study of disk-maser sources has become a very important subject, permitting mass estimates of supermassive black holes, distance estimates of galaxies, and providing a perspective to improve the accuracy of the Hubble constant and to constrain the equation of state for the elusive dark energy (e.g. Braatz et al. 2009).
Observations show that among AGN masers, H2O maser spots locate preferentially in the nuclear regions of Seyfert 2 or LINER galaxies and most of them are heavily obscured (1023cm-2; Braatz et al. 1997, Madejski et al. 2006, Zhang et al. 2006, Greenhill et al. 2008). The nuclear X-ray source is generally believed to heat the gas to temperatures suitable for 22 GHz H2O maser emission (Neufeld et al. 1994), which is supported by a relation between maser luminosity, the unabsorbed intrinsic nuclear X-ray luminosity, and the mass of the black hole (Kondratko et al. 2006, Su et al. 2008).
For the obscured nuclear regions H2O masers and X-rays provide, unlike optical data, deeply penetrating views. The X-ray absorption along the line-of-sight to the nucleus can provide through spectral model fitting important information on the nature of the circumnuclear environment. With modern X-ray telescopes, high quality X-ray spectra have been obtained for more than 30 H2O maser galaxies. Based on an analysis of such spectra, the nuclear column densities of maser host galaxies were investigated by Zhang et al. (2006) and Greenhill et al. (2008). While these studies have shown that nuclear H2O masers are mostly found in environments with high column density, it is still open whether H2O masers preferentially arise from Compton-thick (1024cm-2) AGN.
To reduce limitations and uncertainties when modeling X-ray spectra, here we try to provide additional constraints to evaluate line-of-sight column densities. The iron emission line (6.4 keV) is the most prominent line in the X-ray spectra of AGN. It is believed to be produced either by transmission through the absorbing material (Leahy & Creighton 1993) or via the process of X-ray scattering/reflection by the cold iron in the nuclear accretion disk (e.g., Lightman & White 1988; Fabian et al. 2000) or torus (Ghisellini et al. 1994). So it provides useful information to constrain the column density that absorbs the continuum and, in some cases, to distinguish between Compton-thick and -thin sources. Flat hard X-ray spectra and high equivalent widths (EW (Kα)) of the iron line were found in highly absorbed sources and are generally used to identify Compton-thick nuclei (e.g., Matt 1997). However, currently there are no quantitative criteria on EW (Kα) yet as a probe of the gas absorption.
Unlike the X-ray absorption, and FIR emission have often been used as comparatively isotropic indicators of the intrinsic nuclear power (e.g, Mulchaey et al. 1994, Alonso-Herrero et al. 1997, Shu et al. 2007). The forbidden line emission originates in the narrow line region (NLR), which is assumed to be isotropic for both type 1 and type 2 systems. Due to possible shielding effects in the torus, Netzer et al. (2006) proposed that the line is a better tracer than for its considerably larger emission region. However, this still needs to be checked, since the line can also arise from high mass star formation. And their results are based on a high-luminosity high-redshift AGN sample. For the less luminous, relatively nearby AGN as those of our maser sample, the luminosity has been extensively used as an indicator of the intrinsic AGN power (e.g., Mulchaey et al. 1994, Alonso-Herrero et al. 1997, Maiolino & Rieke 1995, Heckman et al. 2005, Risaliti et al. 1999, Bassani et al. 1999, Panessa et al. 2006, Lamastra et al. 2009). The FIR emission, produced on linear scales much larger than the nuclear torus, should be free of biases caused by the viewing angle and should be highly isotropic (e.g., Mulchaey et al. 1994). So even without a detailed knowledge of the X-ray spectrum, a comparison of the observed X-ray luminosity with those of the more isotropic tracers of nuclear power can help us to determine the gas absorption along the line of sight toward the AGN (e.g., Bassani et al. 1999).
In the following, X-ray, , and FIR data are collected for those H2O maser galaxies which are located farther than the Magellanic Clouds and which are known to host 22 GHz H2O masers. The data are analyzed to determine gas column densities along the line of sight toward the AGN and to derive properties related to activity in highly obscured and therefore particularly elusive Compton-thick nuclear environments.
2 Data
Data related to the galaxies with detected H2O maser emission, located at larger distances than the Magellanic Clouds, are compiled in Table 1. Among the 85 published H2O maser sources, there are 66 AGN masers (63 “megamasers” with isotropic luminosities and 3 “kilomasers” with ). The megamasers are classified as such because of their luminosity. While most of them have not yet been studied in detail, all thoroughly investigated megamasers are not separated by more than a few pc from the line of sight to the AGN of their parent galaxy. Ten kilomasers are related to star formation regions and another nine kilomasers are still awaiting interferometric observations to investigate their nature. All activity types of these H2O maser galaxies are listed in Table 1 and their dominant types (following Bennert et al. 2009) are used for the statistics (for details, see Table 2). Most of the AGN maser sources are Seyfert 2 galaxies or LINERs.
| Source | Type | Tel. | EW () | Ref. | FFIR | Hα/Hβ | Ref. | ||
|---|---|---|---|---|---|---|---|---|---|
| NGC 17 | Sy2,LIRG, H II | 1.33 | |||||||
| NGC 23 | LINER,LIRG, H I | 1.09 | 5.89 | 37.9 | Ho97 | ||||
| IC 10 | 3.65 | 12.5 | 442.85 | Ho97 | |||||
| NGC 235A | Sy1 | 1.1 | |||||||
| NGC 253 | Sy2,SBG,H II | 73.56 | |||||||
| NGC 262(Mrk 348) | Sy2 | A | 482 | Awa00 | 0.34 | 6.02 | 177 | Dah88 | |
| G | 1270 | Bas99 | |||||||
| IRAS F01063-803 | 0.37 | ||||||||
| NGC 449(Mrk 1) | Sy2 | 0.32 | 5.86 | 236.51 | Dah88 | ||||
| NGC 520 | SBG,H II | 2.86 | |||||||
| NGC 598 | H II | 67.71 | 4.55 | 0.24 | Ho97 | ||||
| NGC 591 | Sy2 | X | 20 | Gua05b | 0.28 | 178 | Whi92 | ||
| NGC 613 | Sy2,H II | 2.6 | |||||||
| IC 0184 | Sy2,H II | ||||||||
| NGC 1052 | Sy2,LINER | B | 400 | Ter02 | 0.14 | 2.82 | 13.3 | Dah88 | |
| NGC 1068 | Sy2,Sy1 | X | 462 | Cap06 | 25.01 | 7.00 | 6780 | Dah88 | |
| A | 350 | Bas99 | |||||||
| NGC 1106 | Sy2 | 0.19 | |||||||
| Mrk 1066 | Sy2 | C | 23 | Shu07 | 1.14 | 8.51 | 514 | Whi92 | |
| NGC 1320 | Sy2 | X | 496.2 | Gre08 | 0.29 | ||||
| NGC 1386 | Sy2 | X | Gua05b | 0.72 | 5.7 | 1020 | Sto89 | ||
| A | 20 | Bas99 | |||||||
| IRAS03355+0104 | Sy2 | 0.13 | |||||||
| IC 342 | Sy2,H II | 8.29 | 7.69 | 3.4 | Ho97 | ||||
| MG J0414+0534 | QSO1 | ||||||||
| UGC 3193 | 0.36 | ||||||||
| UGC 3255 | Sy2 | 0.19 | |||||||
| Mrk 3 | Sy2 | X | 590 | Bia05 | 0.57 | 6.67 | 4610 | Whi92 | |
| B | 650 | Cap99 | |||||||
| A | 650 | Bas99 | |||||||
| NGC 2146 | H II | 12.54 | 11.1 | 30.47 | Ho97 | ||||
| VII ZW 73 | Sy2 | 0.21 | |||||||
| NGC 2273 | Sy2 | X | Gua05b | 0.7 | 6.92 | 164 | Whi92 | ||
| A | 125 | Ter02 | |||||||
| UGC 3789 | 0.26 | ||||||||
| Mrk 78 | Sy2 | 0.15 | 6.50 | 242.76 | Dah88 | ||||
| J0804+3607 | QSO2 | ||||||||
| He 2-10 | SBG | C | 9.56 | Jür05 | 2.40 | ||||
| 2MASX J08362280 | Sy2 | 0.17 | |||||||
| Mrk 1210 | Sy2,Sy1 | C | 188 | 840 | Zha09 | 0.36 | 5.20 | 580 | Ter91 |
| X | 130 | 970 | Gua02 | ||||||
| B | 930 | Ohn04 | |||||||
| A | 160 | Awa00 | |||||||
| NGC 2639 | Sy1.9 | A | 25.3 | Ter02 | 0.43 | 4.16 | 4 | Ris99 | |
| NGC 2782 | Sy1,SBG | C | 990 | 30 | Zha06 | 0.91 | 6.67 | 62.19 | Ho97 |
| NGC 2824(Mrk 394) | Sy? | 0.12 | |||||||
| SBS 0927+49 | LINER | 0.29 | |||||||
| NGC 2960 | LINER | 0.24 | |||||||
| UGC 5101 | Sy1.5,LINE R,LIRG | X | 8.1 | Ima03 | 1.06 | 191 | Kim95 | ||
| NGC 2979 | Sy2 | 0.2 | |||||||
| NGC 2989 | H II | ||||||||
| NGC3034 | SBG,H II | 96.49 | 25.0 | 1615.17 | Ho97 | ||||
| NGC 3079 | Sy2,LINER | X | 33 | Cap06 | 5.5 | 25.0 | 92 | Ho97 | |
| B | 378 | Iyo01 | |||||||
| Mrk 34 | Sy2 | 0.43 | 10.5 | 204.19 | Dah88 | ||||
| NGC 3359 | H II | 0.70 | |||||||
| IC 2560 | Sy2 | X | 2320 | 38.8 | Til08 | 4.29 | Ris99 | ||
| C | 2770490 | 38.4 | Mad06 | ||||||
| NGC 3393 | Sy2 | X | Gu05a | 0.33 | 4.12 | 316 | Dia88 | ||
| A | 40 | Bas99 | |||||||
| NGC 3556 | H II | 7.29 | 7.14 | 2.24 | Ho97 | ||||
| ARP 299(NGC 3690) | X,C | 43.7 | Bal04 | 9.43 | 5.88 | 35.6 | Ho97 | ||
| B | Del02 | ||||||||
| NGC 3735 | Sy2 | 1.02 | 6.31 | 33 | Ho97 | ||||
| Antennae | SBG | C | |||||||
| NGC 4051 | Sy1.5 | X | 627 | Cap06 | 1.32 | 3.33 | 59.99 | Ho97 | |
| NGC 4151 | Sy1.5 | X | 4510 | Cap06 | 1.11 | 3.45 | 1695.39 | Ho97 | |
| A | 1015 | 20000 | Wea01 | ||||||
| NGC 4214 | SBG | C | 243 | Har04 | 1.81 | ||||
| NGC 4258 | Sy1.9,LINER | X | 837 | Cap06 | 5.08 | 9.12 | 262 | Hec80 | |
| A | 250100 | 300 | Bas99 | ||||||
| NGC 4293 | LINER | 0.58 | 7.69 | 5.95 | Ho97 | ||||
| NGC 4388 | Sy2 | X | 762 | Cap06 | 1.44 | 5.50 | 37450 | Bas99 | |
| A | 1200 | Bas99 | |||||||
| NGC 4527 | LINER,H II | 3.80 | |||||||
| ESO 269-G012 | Sy2 | 0.23 | |||||||
| NGC 4922 | Sy2,LINER | 0.58 | 7.14 | 33.03 | Kim95 | ||||
| NGC 4945 | Sy2 | C | 1300 | 500 | Don03 | 41.38 | Ris99 | ||
| B | 1300 | 540 | Gua00 | ||||||
| A | 350 | Bas99 | |||||||
| NGC 5194 | Sy2,H II | X | 48 | Cap06 | 6.62 | 8.33 | 228 | Ho97 | |
| A | 91.9 | Ter02 | |||||||
| NGC 5253 | SBG,H II | C | 29.9 | Jür05 | 3.16 | ||||
| Mrk 266(NGC 5256) | Sy2,LIRG,SBG | B | 575 | 56 | Ris00 | 0.84 | 5.92 | 44.33 | Dah88 |
| NGC 5347 | Sy2 | C | 22 | Lev06 | 0.27 | 114 | Tra01 | ||
| NGC 5495 | Sy2,H II? | 0.27 | |||||||
| Circinus | Sy2 | C | 1400 | Smi01 | 26.11 | 19.1 | 6970 | Bas99 | |
| NGC 5506(Mrk 1376) | Sy1.9 | X | 5800 | Bia03 | 1.06 | 7.20 | 333 | Lum01 | |
| A | 8380 | Bas99 | |||||||
| NGC 5643 | Sy2 | X | 500 | 84 | Gua04 | 2.59 | 6.40 | 662 | Whi92 |
| A | 130 | Bas99 | |||||||
| NGC 5728 | Sy2,H II | C | 133 | Shu07 | 0.96 | 5.96 | 761 | Sto95 | |
| C | 1130 | Zha06 | |||||||
| UGC09618NED02 | LINER,H II | 0.92 | |||||||
| NGC 5793 | Sy2 | 0.6 | |||||||
| NGC 6240 | Sy2,LINER | C | 170 | Pta03 | 2.18 | 17.2 | 13520 | Kim95 | |
| A | 190 | Bas99 | |||||||
| NGC6264 | Sy2 | ||||||||
| NGC 6300 | Sy2 | X | Mat04b | 2.34 | 320 | Lum01 | |||
| NGC 6323 | Sy2 | ||||||||
| ESO 103-G035 | Sy2,Sy1 | A | 907 | Tur97 | 0.37 | 6.31 | 112 | Po196 | |
| IRAS F19370-013 | Sy2,H II | 0.26 | |||||||
| 3C 403 | FR | C | 24420 | Kra05 | 0.1 | ||||
| NGC 6926 | Sy2,H II | 0.65 | 15.6 | 21.98 | Kim95 | ||||
| AM 2158-380NED02 | Sy2,RG | ||||||||
| TXS 2226-184 | LINER | ||||||||
| NGC 7479 | Sy2,LINER | 0.83 | 10.0 | 37.9 | Kim95 | ||||
| IC 1481 | LINER | 0.12 |
Note. — 85 published extragalactic H2O maser sources with available physical parameters are listed (10 masers arise in star forming regions marked by italics and 29 out of 66 AGN-masers are potential disk-masers, their source names are presented in boldface). Recently reported masers, not being part of the 78 sources listed by Bennert et al. (2009), are one type I quasar from Impellizzeri et al. (2008), two sources (NGC 17 and NGC 1320) from Greenhill et al. (2008), and four new masers related with star formation (He 2-10, Antennae, NGC 4214, NGC 5253) from Darling et al. (2008).
| Typea) | SF-masersb) | Kilomasers of unknown originc) | AGN-masersd) | the whole sample |
|---|---|---|---|---|
| Seyfert 2 | 0 | 4 | 45 | 49 |
| LINER | 0 | 2 | 8 | 10 |
| Inter Sy. | 0 | 1 | 2 | 3 |
| Seyfert 1 | 0 | 0 | 2 | 2 |
| SBG | 5 | 1 | 0 | 6 |
| H II | 4 | 1 | 1 | 6 |
| FR II | 0 | 0 | 1 | 1 |
| Quasar | 0 | 0 | 2 | 2 |
a) Types from NED: Inter Sy., intermediate Seyfert types; LINER, low-ionization nuclear emission line region; SBG, StarBurst Galaxy; FR II, Fanaroff-Riley type II radio galaxy; H II, classified as H II region galaxy; b) SF-masers, H2O masers associated with off-nuclear star formation regions; c) kilomasers without known type; d) AGN-masers, H2O masers associated with AGN.
Besides the type of nuclear activity, we collected multi-wavelength data and parameters for all of the 85 extragalactic H2O maser sources, including the EW () of the iron emission line, the observed X-ray (2-10 keV) flux FX, the FIR flux FFIR, the observed H line intensity ratio and the flux density, F. These data are also presented in Table 1.
The X-ray data of our sample are collected from the literature, based on observations from ASCA, BeppoSAX, Chandra, and the XMM-Newton satellite. For some sources more than one value were reported in the literature for parameters such as the EW (Kα) of the iron line and the observed X-ray flux, either due to intrinsic variability of the source or due to a different modeling of the spectra. For comparison, all results available from the literature are listed in Table 1. For our statistical analyses, observational results were taken from XMM-Newton and Chandra whenever possible. Otherwise the most recent measurements were used.
For the emission line, the fluxes are mainly compiled from Dahari & De Robertis (1988), Ho et al. (1997), Kim et al. (1995) and Whittle (1992). Again the most recent result was adopted when two or more observations were found. Since the NLR may be obscured by material in the host galaxy, the observed flux should be corrected to determine its intrinsic flux. The narrow-line Balmer decrement was used to estimate this extinction. Assuming an intrinsic Balmer decrement , the intrinsic line fluxes were derived from the formula (Bassani et al. 1999). The fluxes were obtained for 46 maser sources and their luminosities were calculated from their extinction-corrected fluxes.
The IRAS (Infrared Astronomical Satellite) point source catalogue was used to obtain the infrared fluxes (12, 25, 60, 100m) for our H2O maser host galaxies. Following the method of Wouterloot & Walmsley (1986), the infrared flux (m) was derived by extrapolating flux densities beyond 12 and 100m and assuming a grain emissivity proportional to frequency . In this way, infrared luminosities could be determined for 76 H2O maser galaxies. Throughout the paper, the luminosity distance was derived using Calculators I provided by the NASA Extragalactic Database (NED), assuming = 0.270, = 0.730, and =70 km s-1 Mpc-1 (e.g., Spergel et al. 2007).
3 Results

3.1 Isotropic indicators of the intrinsic nuclear power
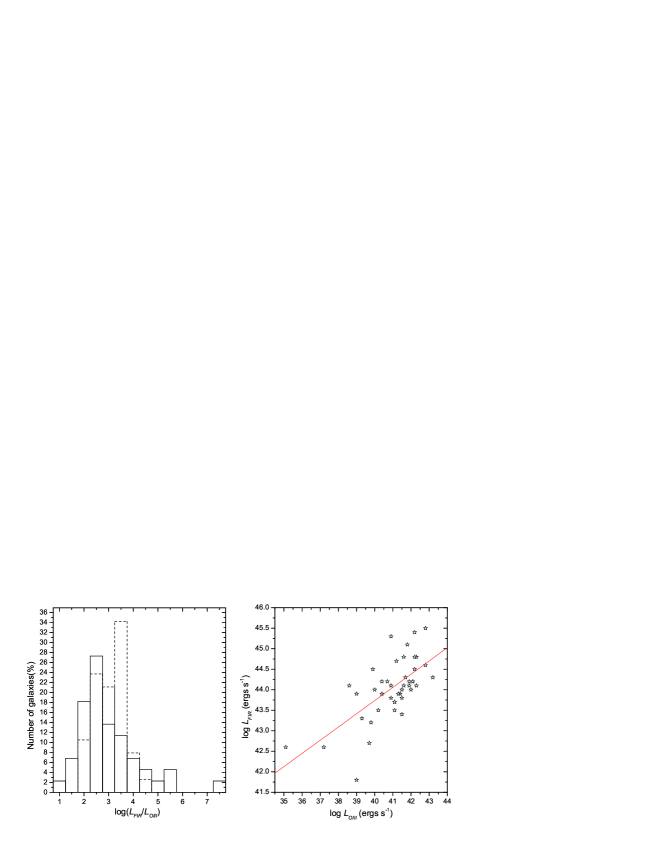
For our H2O maser galaxies with available data, the luminosity distributions of both isotropic indicators, the line and the FIR luminosities, are presented in Fig. 1. The left panel shows the histogram of the infrared luminosities for all 76 H2O maser galaxies with available data (, hereafter luminosity in logarithmic scale and in units of erg s-1). ranges from 41.8 to 45.5, with a mean value of 44.10.1 (the error denotes the standard deviation of the mean). For the sub-sample of 10 masers associated with massive star formation, the mean value of =43.30.2 is slightly fainter than that of the AGN masers. However, the difference between both distributions (not shown here) is not significant. The histogram shown in the right panel presents the number of the H2O maser sources as a function of the line luminosity. It gives the range of from 39 to 43.2 and a mean value of 40.90.3, comparable to results of Seyfert 2 galaxies not associated with detected H2O maser (Mulchaey et al. 1994). For comparison, the latter sample is also presented in Fig. 1 (dashed lines).
For the two tracers and , the ratio was calculated and the distribution of the ratio is shown as a histogram in Fig. 2 (left panel). No significant difference can be found for the distribution of the ratio between our H2O maser galaxies and the Seyfert 2 galaxy sample not containing galaxies with known masers (Mulchaey et al. 1994). This is in agreement with the fact that most H2O maser sources have been found in Seyfert 2 systems. The good agreement between Seyfert 1 and Seyfert 2 galaxies (Mulchaey et al. 1994) with respect to this parameter, in spite of different viewing angles, lends further support to an approximately isotropic emission of both tracers. In order to further compare those two isotropic tracers, the FIR luminosity is plotted against the extinction-corrected luminosity of our maser sample in the right panel of Fig. 2. A correlation is found, log LFIR=(30.862.30)+ (0.320.06)log L with a Spearman’s rank correlation coefficient r=0.66 and a chance probability 510-3. Assuming the corrected line luminosity to be a good isotropic tracer (Bassani et al. 1999), the strong correlation between FIR luminosity and line luminosity may suggest that the FIR luminosity is to some extent also an indicator of intrinsic nuclear activity, even though the FIR flux may be contaminated by a spatially extended starburst component.
3.2 Optical thickness parameters and the 6.4 keV iron line
As mentioned above, nuclear absorbing columns can be obtained by analyzing X-ray spectra. These analyses are model dependent. Comparing the observed 2-10 keV X-ray emission from the nuclear region, absorbed by the obscuring material along the line-of-sight, with the intrinsic nuclear power provides another method for evaluating the absorbing column density. The ratio of the observed 2-10 keV luminosity and the luminosity of the nuclear isotropic indicators was assumed to represent the optical thickness parameter, which allows us to diagnose the gas absorption (Bassani et al. 1999). Here the LX/L and LX/LFIR ratios are used as optical thickness parameters. In addition, high EW () values of the iron emission line are considered as a qualitative feature indicating a heavily obscured nucleus (e.g., Maiolino & Risaliti 2007). Combining the EW () and the optical thickness parameters, we probe the circumnuclear environment of the maser sources.
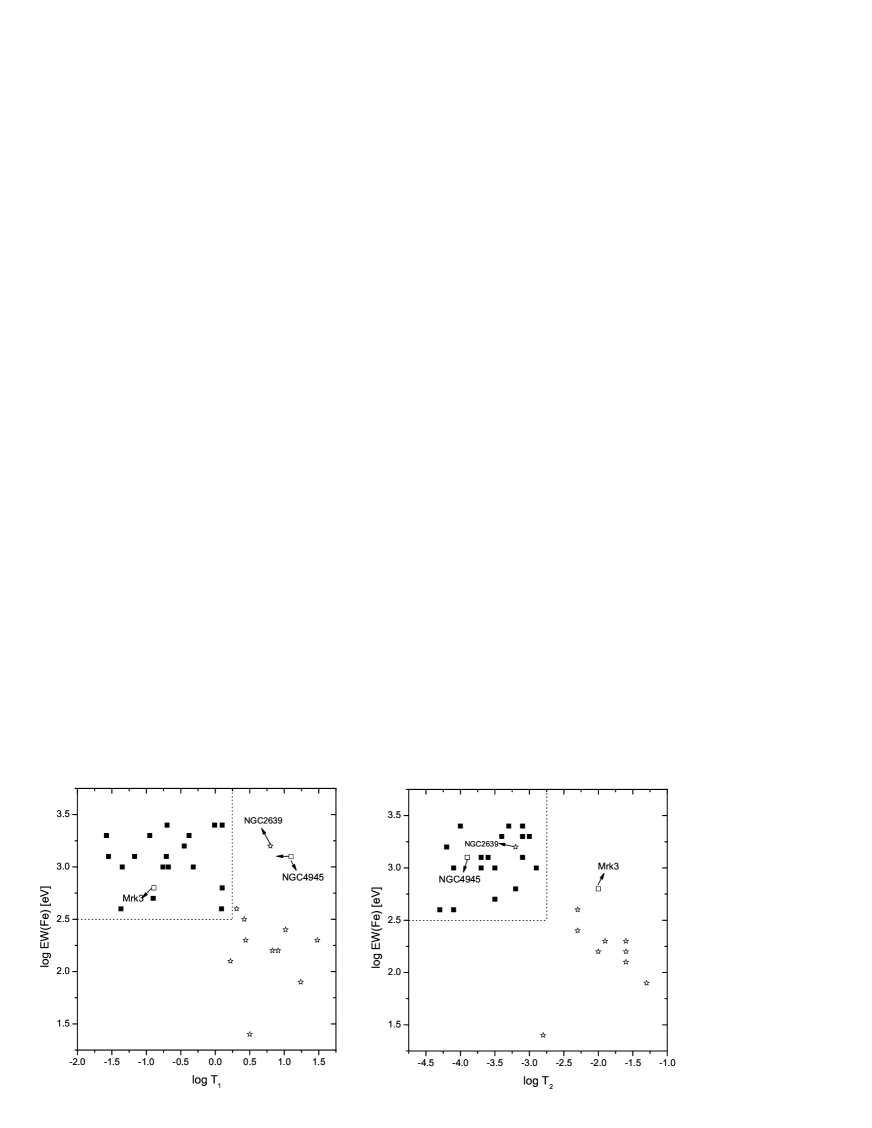
For the maser galaxies with available data (EW (), LX, L and LFIR, in total 31 AGN maser sources), the EW (Kα) of the iron lines is plotted against the optical thickness parameters in Fig. 3. The prominent feature of the figure is the existence of an anti-correlation, which is similar to that obtained for the Seyfert 2 sample of Bassani et al. (1999), which is predominantly containing targets without known maser lines. In the left panel (EW () v.s. LX/L), a least-squares fit shows log (EW ())=(2.740.08)+ (-0.310.08)log LX/L, with Spearman’s rank correlation coefficient R=-0.57 and a chance probability of P 0.001. The possibly Compton-thick sources (shown by squares in Fig. 3), determined by modeling their X-ray spectra, cluster in the upper left region, the region with high EW (Kα) and low LX/L values. This area is marked by dashed lines. The approximate boundaries between Compton-thick and -thin sources, the latter shown by pentacles, are log (LX/L)0.25 (i.e., 2 ) and log EW ()2.5 (i.e, EW300 eV). For comparison with Seyfert 2 galaxies without detected H2O maser emission, the Seyfert 2 sample of Bassani et al. (1999) is used, excluding those objects with maser emission. The trend is the same for this sample (here not shown). Compton-thick sources fall again into the upper left region with high EW (Kα) and low LX/L values, while Compton-thin sources are located in the lower right. The right panel of Fig. 3 shows a similarly clear anti-correlation between EW (Kα) and LX/LFIR. Linear fitting results in log (EW ())=(1.71 0.26) + (-0.36 0.08)log LX/LFIR, with R=-0.61 and P 2 10-4. Most of those sources with high EW (Kα) and low LX/LFIR value (upper-left region, in square symbols) are Compton-thick sources, while those sources with low EW (Kα) and high LX/LFIR value (in pentacles) are Compton-thin as determined from X-ray spectral fitting. The approximate boundaries between Compton-thick and -thin environments are in this case log LX/LFIR-2.75 (i.e., 600 ) and log EW ()2.5, i.e. again EW300 eV.
We like to emphasize that these boundaries are not arbitrary. Among the 20 Compton-thick candidate sources from our sample, classified by conventional X-ray spectroscopy, we find 19 in each of our limited “Compton-thick” regions, related either to LX/L or to LX/LFIR. 18 of these sources are identical (see also Sect. 4).
The results obtained so far could be affected by systematic errors in the measurements. Assuming for the [O III] values uncertainties of 20% (Dahari & De Robertis 1988) results in LX/L errors of order 0.08 dex. Obviously, this does not affect the robust fundamental trend in our diagnostic Fig. 3. Compton-thick sources are still placed in the upper left and Compton-thin sources in the lower right. The anti-correlation between the EW () and the optical thickness parameters are readily explained. With an increase of the absorbing column density, the X-ray luminosity will decrease so that LX/L and LX/LFIR are reduced with respect to L and LFIR. On the other hand, the EW () values will increase, since these are measured against a reduced 6.4 keV continuum level.
With Compton-thick galaxies being located in the upper left part of the panels in Fig. 3, we find for our H2O maser galaxies three criteria hinting at a Compton-thick nuclear environment: EW ()300 eV, 2 and 600 . These are independent of the detailed shape of the X-ray spectrum.
3.3 Indicators for H2O maser emission
The search for new extragalactic H2O masers is ongoing and important with respect to several key aspects of modern astrophysics (see, e.g., Sect. 1 and Braatz et al. 2009). Here we therefore investigate possible indicators of H2O maser emission. We analyze relationships between H2O maser luminosity and the iron line EW (Kα), FIR, and luminosity.

For 33 maser sources with available EW () of the iron line in Table 1, we obtain an EW (Kα) mean value of eV. X-ray observations show that strong iron line emission is common in the spectra of AGN hosting H2O masers. It is interesting to check if the 6.4 keV line can be used as a criterion to search for AGN masers. Have Seyfert 2s with detected maser emission higher EW (Kα) values than non-maser Seyfert 2s? Our statistical results show that the iron line EW () of masing Seyfert 2 galaxies (mean value eV and median value 800 eV for our 19 maser sources) is higher than that of the non-maser Seyfert 2 sample (mean value eV and median value 200eV for 34 sources from Bassani et al. 1999 ). Figure 4 shows the distributions of both samples. While the difference seems to be obvious at first sight, we should cautiously avoid a definite conclusion due to the large scatter, the still too small number of sources, and the incompleteness of the studied samples. Potential differences in sensitivity have also to be addressed. For our maser host Seyfert 2s, the EW () values were taken almost exclusively (except four sources) from XMM-Newton or Chandra observations. The results for Seyfert 2s without known masers (Bassani’s sample) come mostly from ASCA data of lower sensitivity, which might lead to an increase in the real average (only sources with a strong iron line could be detected). This strengthens our result and amplifies the difference between Seyfert 2s with and without detected 22 GHz H2O maser. Nevertheless, we consider our result as tentative.
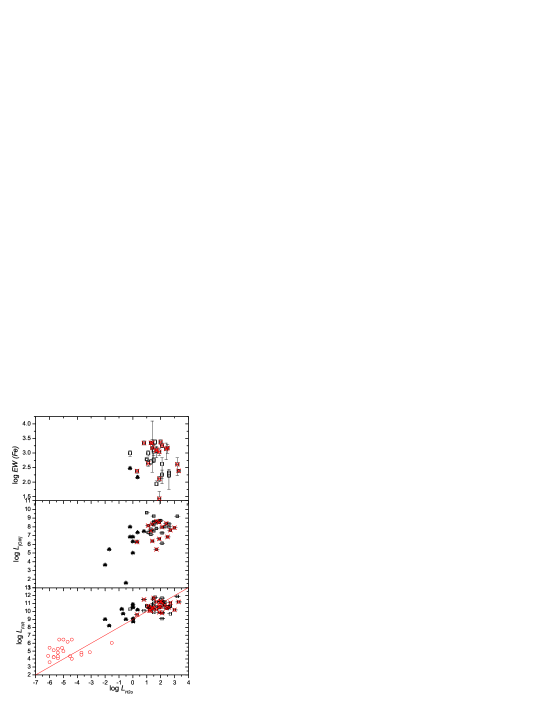
In order to investigate possible correlations between H2O maser and iron emission lines, the EW () of the Fe line was plotted against the isotropic H2O luminosity in Fig. 5 (upper panel). As already mentioned, H2O maser emission can be produced by collisional pumping in a dense molecular layer, which is heated by irradiated X-rays from the nucleus (Neufeld et al. 1994). Strong Fe emission is believed to be produced via X-ray reflection by the cold iron in the circumnuclear region (e.g., Fabian et al. 2000). In those cases where H2O maser and iron line emission are detected, the nuclear X-ray emission plays a key role. Correlations between maser and iron line emission are therefore expected. However, our results show no apparent trend between the iron line EW (Kα) and the isotropic H2O maser luminosity, neither for the entire sample nor the two subsamples, AGN- and star-forming masers (squares and triangles, respectively, in Fig. 5). In view of alternative H2O excitation mechanisms (see, e.g., Lo 2005), the subsample of possible disk-masers (with detected high velocity maser features) was analyzed separately (see the crosses in Fig. 5). However, even in this case no significant correlation can be found.
The [O III] and FIR luminosities were also plotted against H2O maser luminosity in Fig. 5 (central and bottom panel respectively). There is no significant correlation between and , although maser sources related to star formation seem to have lower [O III] luminosities than AGN masers. For FIR versus H2O maser luminosities, there appears to be a correlation, similar to that previously found by Henkel et al. (2005), Castangia et al. (2008), Bennert et al. (2009) and Surcis et al. (2009). The relation was first found for galactic star forming regions by Jaffe et al. 1981, i.e., luminous H2O masers form in star formation regions with high FIR luminosity. For comparison, values of Galactic H2O masers are also plotted in Fig. 5 (empty circles) and the line shows the correlation of /10-9 from Jaffe et al. (1981). Apparently, there exists a correlation between FIR and H2O maser luminosity over many orders of magnitude. When considering AGN-masers only (squares in Fig. 5, lowest panel), the strongest masers appear to be overluminous with respect to the - correlation. This is likely caused by the different properties of AGN versus star-forming masers.
4 Discussion
Compton-thick nuclei are known to contribute a significant fraction of the hard X-ray background. Their density as a function of redshift is also a relevant parameter when studying the evolution of the universe. Thus our newly defined criteria identifying such nuclei may be helpful when trying to reach this goal.
Based on our new approach introduced in Sect. 3.2, 18 H2O maser sources in the upper left part of the panels in Fig. 3 (see the solid squares) can be considered to be Compton-thick. These are NGC 591, NGC 1068, Mrk 1066, NGC 1386, NGC 2273, UGC 5101, NGC 2782, NGC 3079, IC 2560, NGC 3393, Arp 299, NGC 5194, Mrk 266, NGC 5347, Circinus, NGC 5643, NGC 5728 and NGC 6240. Comparing this with Zhang et al. (2006), there are five new sources, NGC 591, UGC 5101, NGC 3072, IC 2560, Mrk 266. About 60% of the 31 AGN masers turn out to be Compton-thick. This is consistent with the result found by Greenhill et al. (2008). For maser sources associated with Seyfert 2 nuclei, 60% (15/25) are Compton-thick, which is, however, not significantly, higher than that of Seyfert 2 objects without detected maser emission (45%, 9/20 from Risaliti et al. 1999; 19/42 from Bassani et al. 1999).
Our sample also contains a few exceptional sources, which show the limits of our selection criteria. For NGC 4945, its low [O III] line flux places the source outside our Compton-thick border (EW ()-/, see left panel in Fig. 3). However, the [O III] flux from Risaliti et al. (1999) only gives a very stringent lower limit to the actual intrinsic [O III] emission. The lack of a reliable [O III] flux is thought to be due to high absorption in the edge-on galactic disk, instead of its intrinsic weakness. This is supported by its hard X-ray spectrum, which indicates that NGC 4945 hosts one of the brightest AGN in the hard X-ray range (100 keV) and can therefore be considered to contain a ‘bona-fide’ Compton-thick nucleus (e.g., Guainazzi et al. 2000b). Similar to NGC 4945, Mrk 3 is also considered to be a ‘Bona-fide’ Compton-thick Seyfert 2 from its large brightness in the hard X-ray range (e.g., Cappi et al. 1999). However, the source is found outside our limited EW ()-LX/LFIR region (right panel in Fig. 3) for its relatively low value of the infrared flux. More constraints are desirable to probe its circumnuclear environment. The disk-maser galaxy NGC 2639 is located inside the required EW ()-LX/LFIR region and outside the EW ()-LX/L area. However, large uncertainties in the X-ray results (ASCA observations) have to be noted. NGC 2639 is a weak X-ray source with an ASCA count rate 0.01 counts s-1. The ASCA data were analyzed by Wilson et al. (1998) and Terashima et al. (2002) and the source was considered to be Compton-thin (510 23 cm-2). Low photon statistics lead to uncertainties in the fitting models and Chandra observation are therefore needed to investigate its highly obscured nucleus.
We conclude with some cautionary notes. First, uncertainties are involved when using the line and FIR luminosity as nuclear isotropic indicators. Although assumed to be isotropic, the line luminosity might depend on the geometry of the system, for example on the opening angle of the torus and the inclination of the large scale disk. Shielding effects may affect the ionizing radiation seen by the NLR. FIR emission of H2O megamaser galaxies may mainly arise from the AGN environment, but there is possible contamination from a starburst component and it is unclear how much it contributes. Second, the EW (Kα) of the iron line can be affected by other factors, such as the geometry of the accretion disk and the inclination angle at which the reflecting surface is viewed (e.g., Fabian et al. 2000 , Bianchi et al. 2005). A high EW (Kα) of the iron line can also appear if the radiation is anisotropic or if there is a time lag between a drop in the continuum and the line emission (Bassani et al. 1999). With future advanced X-ray telescopes, sensitive observations of more H2O maser host galaxies at higher energies (above 10 keV) will provide important complementary information, further constraining nuclear column density.
5 Summary
In this paper, multi-wavelength data from the complete sample of galaxies (100 kpc) so far reported to host 22 GHz H2O masers are analyzed, including the equivalent width (EW) of the iron line, the line, and the X-ray and FIR emission. The latter two are considered to be the isotropic tracers of intrinsic nuclear power. The observed nuclear X-ray luminosity, compared with the luminosities of these two isotropic tracers (our optical thickness parameters), can be used as a measure of the circumnuclear absorption. The EW () and the optical thickness parameters (/, /) are combined here to probe the obscuration of maser host AGN. The main results are summarized below:
(1) Our statistical analysis shows obvious anti-correlations between the EW () of the Fe emission line and the two optical thickness parameters. Without requiring a full X-ray spectrum, Compton-thick nuclear environments can be identified with these parameters and are found to be characterized approximately by EW ()300 eV, 2 and 600 ;
(2) 18 H2O maser sources matching these criteria are identified to be Compton-thick. A comparison with Zhang et al. (2006) shows, that among these there are five newly identified H2O maser galaxies which are Compton-thick, i.e., NGC 591, UGC 5101, NGC 3072, IC 2560 and Mrk 266. Masers associated with Seyfert 2 nuclei may be more likely Compton-thick (60%) than Seyfert 2s without detected maser emission (45%). However, this still has to be confirmed with larger samples;
(3) In an attempt to guide future H2O maser surveys, new ways to find extragalactic H2O sources are also explored. H2O maser sources may show larger EW (Kα) values than non-maser Seyfert 2s, which, however, also needs further support. No significant correlations have been found between EW (Kα), and . There appears a linear correlation between and , which is consistent with the correlation found for Galactic H2O masers. However, the strongest H2O masers appear overluminous with respect to their . This may be related to their different origin when compared with masers associated with sites of massive star formation well outside the nuclear region of their parent galaxy.
References
- (1) Alonso-Herrero, A., Ward, M. J. & Kotilainen, J. K. 1997, MNRAS, 288, 947
- (2) Awaki, H., Ueno, S., Taniguchi, Y. & Weaver, K. A. 2000, ApJ, 542, 175
- (3) Ballo, L., Braito, V., Della Ceca, R., Maraschi, L., Tavecchio, F. & Dadina, M. 2004, ApJ, 600, 634
- (4) Bassani, L., Dadina, M., Maiolino, R., Salvati, M., Risaliti, G., della Ceca, R., Matt, G. & Zamorani, G. 1999, ApJS, 121, 473
- (5) Beckmann, V., Gehrels, N., Favre, P., Walter, R., Courvoisier, T. J.-L., Petrucci, P.-O. & Malzac, J. 2004, ApJ, 614, 641
- (6) Bennert, N., Barvanis, R., Henkel, C. & Antonucci, R. 2009, ApJ, 695, 276
- (7) Bianchi, S., Balestra, I., Matt, G., Guainazzi, M. & Perola, G. C. 2003, A&A, 402, 141
- (8) Bianchi, S., Miniutti, G., Fabian, A. C., & Iwasawa, K. 2005, MNRAS, 360, 380
- (9) Braatz, J. A., Wilson, A. S., & Henkel, C. 1997, ApJS, 110, 321
- (10) Braatz, J. A. & Gugliucci, N. E. 2008, ApJ, 678, 96
- (11) Braatz, J. A., Condon, J. J., Henkel, C., Lo, K.-Y. & Reid, M.J. 2009, astro2010, 23
- (12) Cappi, M. et al. 1999, A&A, 344, 857
- (13) Cappi, M. et al. 2006, A&A, 446, 459
- (14) Castangia, P., Tarchi, A., Henkel, C. & Menten, K. M. 2008, A&A, 479, 111
- (15) Dahari, O. & De Robertis, M. M. 1988, ApJS, 67, 249
- (16) Darling, J., Brogan, C. & Johnson, K. 2008, ApJS 685, 39
- (17) Della Ceca, R. et al. 2002, ApJ, 581, 9
- (18) Diaz, A. I., Prieto, M. A. & Wamsteker, W. 1988, A&A, 195, 5
- (19) Done, C., Madejski, G. M., Zycki, P. T., & Greenhill, L. J. 2003, ApJ, 588, 763
- (20) Fabian, A. C., Iwasawa, K., Reynolds, C. S. & Young, A. J. 2000, PASP, 112, 1145
- (21) Ghisellini, G., Haardt, F. & Matt, G. 1994, MNRAS, 267 743
- (22) Greenhill, L. J., Tilak, A. & Madejski, G. 2008, ApJ, 686, L13
- (23) Guainazzi, M., Matt, G., Brandt, W. N., Antonelli, L. A., Barr, P. & Bassani, L. 2000a, A&A, 356, 463
- (24) Guainazzi, M., Matt, G., Fiore, F., & Perola, G. C., 2002, A&A, 388, 787
- (25) Guainazzi, M., Rodriguez-Pascual, P., Fabian, A. C., Iwasawa, K. & Matt, G. 2004, MNRAS, 355, 297
- (26) Guainazzi, M., Fabian, A. C., Iwasawa, K., Matt, G. & Fiore, F. 2005a, MNRAS, 356, 295
- (27) Guainazzi, M., Matt, G. & Perola, G. C. 2005b, A&A, 444, 119
- (28) Heckman, T. M., Balick, B. & Crane, P. C. 1980, A&AS, 40, 28
- (29) Heckman, T. M., Ptak, A., Hornschemeier, A. & Kauffmann, G., 2005, ApJ, 634, 161
- (30) Henkel, C., Peck, A. B., Tarchi, A., Nagar, N. M., Braatz, J. A., Castangia, P.& Moscadelli, L. 2005, A&A, 436, 75
- (31) Ho, L. C., Filippenko, A. V. & Sargent, W. L. W. 1997, ApJS, 112, 315
- (32) Imanishi, M., Terashima, Y., Anabuki, & N., Nakagawa, T. 2003, ApJ, 596, 167
- (33) Impellizzeri, C. M. V., McKean, J. P., Castangia, P., Roy, A. L., Henkel, C., Brunthaler, A. & Wucknitz, O. 2008, Nature, 456, 927
- (34) Iwasawa, K., Maloney, P. R. & Fabian, A. C. 2002, MNRAS, 336, 71
- (35) Iyomoto, N., Fukazawa, Y., Nakai, N. & Ishihara, Y. 2001, ApJ, 561, 69
- (36) Jaffe, D. T., Guesten, R. & Downes, D. 1981, ApJ, 250, 621
- (37) Jenkins, L. F., Roberts, T. P., Ward, M. J. & Zezas, A. 2004, MNRAS, 352, 1335
- (38) Kim, D.-C., Sanders, D. B., Veilleux, S., Mazzarella, J. M. & Soifer, B. T 1995, ApJ, 98, 129
- (39) Kondratko, P.T., Greenhill, L. J. & Moran, J. M. 2006, ApJ, 652, 136
- (40) Kraft, R. P., Hardcastle, M. J., Worrall, D. M. & Murray S. S. 2005, ApJ, 622, 149
- (41) Lamastra, A., Bianchi, S., Matt, G., Perola, G. C., Barcons, X. & Carrera, F. J. 2009, A&A, 504, 73
- (42) Leahy, D. A., & Creighton, J. 1993, MNRAS, 263, 314
- (43) Levenson, N. A., Heckman, T. M., Krolik, J. H., Krolik, J. H., Weaver, K. A. & Zycki, P. T. 2006, ApJ, 648, 111
- (44) Lightman, A. P. & White, T. R. 1988, ApJ, 335, 57
- (45) Lo, K. Y. 2005, ARA&A, 43, 625
- (46) Lumsden, S. L. & Alexander, D. M. 2001, MNRAS, 328, L32
- (47) Madejski, G., Done, C., Zycki, P. T. & Greenhill, L. 2006, ApJ, 636, 75
- (48) Maiolino, R. & Rieke, G. H., 1995, ApJ, 454, 95
- (49) Maiolino, R. & Risaliti, G. 2007, in ASP Conf. Ser., 373, The Central Engine of Activ e Galactic Nuclei, ed. L. C. Ho & J.-M.Wang (SanFrancisco, CA: ASP), 447
- (50) Matt, G., Guainazzi, M., Perola, G. C., Fiore, F., Nicastro, F., Cappi, M. & Piro, L. 2001, A&A, 377, 31
- (51) Matt, G. 1997, Mem. Soc. Astron. Ital., 68, 127
- (52) Matt, G., Bianchi, S., Guainazzi, M. & Molendi, S., 2004, A&A, 414, 155
- (53) Matsumoto, C., Nava, A., Maddox, L. A., Leighly, K. M., Grupe, D., Awaki, H. & Ueno, S. 2004, ApJ, 617, 930
- (54) Mulchaey, M. et al. 1994, ApJ, 436, 586
- (55) Netzer, H., Mainieri, V., Rosati, P. & Trakhtenbrot, B. 2006, A&A, 453, 525
- (56) Neufeld, D. A., Maloney, P. R., & Conger, S. 1994, ApJ, 436L, 127
- (57) Ohno, M., Fukazawa, Y. & Iyomoto, N. 2004, PASJ, 56, 425
- (58) Panessa, F., Bassani, L., Cappi, M., Dadina, M., Barcons, X., Carrera, F. J., Ho, L. C. & Iwasawa, K. 2006, A&A, 455, 173
- (59) Polletta, M., Bassani, L., Malaguti, G., Palumbo, G. G. C. & Caroli, E. 1996, ApJ, 106, 399
- (60) Ptak, A., Heckman, T., Levenson, N. A., Weaver, K. & Strickland, D. 2003, ApJ, 592, 782
- (61) Risaliti, G., Maiolino, R. & Salvati, M. 1999, ApJ, 522, 157
- (62) Risaliti, G., Gilli, R., Maiolino, R. & Salvati M., 2000, A&A, 357, 13
- (63) Shu, X. W., Wang, J. X., Jiang, P., Fan, L. L. & Wang, T,G., 2007, ApJ, 657, 167
- (64) Smith, D. A. & Done, C., 1996, MNRAS, 280, 355
- (65) Smith, D. A. & Wilson, A. S., 2001, ApJ, 557, 180
- (66) Spergel, D. N. et al. 2003, ApJS, 148, 175
- (67) Storchi-Bergmann, T. & Pastoriza, M. G. 1989, ApJ, 347, 19
- (68) Storchi-Bergmann, T., Kinney, A. L. & Challis, P. 1995, ApJS, 98, 10
- (69) Su, J. B., Zhang, J. S. & Fan, J.H., Chin. J. Astron. Astrophys., 8, 547
- (70) Surcis, N., Tarchi, A., Henkel, C., Ott, J., Lovell, J. & Castangia, P. 2009, A&A, 502, 529
- (71) Terlevich, R., Melnik, J., Masegosa, J., Moles, M. & Copetti, M. V. F. 1991, A&AS, 91, 285
- (72) Terashima, Y., Iyomoto, N., Ho, L. C. & Ptak, A. F., 2002, ApJS, 139, 1
- (73) Tran, H. D. 2001, ApJ, 554, L19
- (74) Turner, T. J., George, I. M., Nandra, K. & Mushotzky, R. F. 1997, ApJS, 113, 23
- (75) Weaver, K. A., Gelbord, J. & Yaqoob, T. 2001, ApJ, 550, 261
- (76) Whittle, M. 1992, ApJS, 79, 49
- (77) Wilson, A. S. et al. 1998, ApJ, 505, 587
- (78) Wouterloot, J. G. A. & Walmsley, C. M. 1986, A&A, 168, 237
- (79) Zhang, J. S., Henkel C., Kadler, M., Greenhill, L. J., Nagar, N., Wilson, A. S. & Braatz, J. A. 2006, A&A, 450, 933
- (80) Zhang, J. S. & Fan, J. H. 2009, Sci Chin. G, 6, 960