Updated stellar yields from Asymptotic Giant Branch models
Abstract
An updated grid of stellar yields for low to intermediate-mass thermally-pulsing Asymptotic Giant Branch (AGB) stars are presented. The models cover a range in metallicity , and , and masses between 1 to 6. New intermediate-mass () AGB models are also presented, along with a finer mass grid than used in previous studies. The yields are computed using an updated reaction rate network that includes the latest NeNa and MgAl proton capture rates, with the main result that between to 30 times less Na is produced by intermediate-mass models with hot bottom burning. In low-mass AGB models we investigate the effect on the production of light elements of including some partial mixing of protons into the intershell region during the deepest extent of each third dredge-up episode. The protons are captured by the abundant 12C to form a 13C pocket. The 13C pocket increases the yields of 19F, 23Na, the neutron-rich Mg and Si isotopes, 60Fe, and 31P. The increase in 31P is by factors of to 20, depending on the metallicity. Any structural changes caused by the addition of the 13C pocket into the He-intershell are ignored. However, the models considered are of low mass and any such feedback is likely to be small. Further study is required to test the accuracy of the yields from the partial-mixing models. For each mass and metallicity, the yields are presented in a tabular form suitable for use in galactic chemical evolution studies or for comparison to the composition of planetary nebulae.
keywords:
stars: AGB and post-AGB stars — ISM: abundances — nuclear reactions, nucleosynthesis, abundances, population II1 Introduction
The Asymptotic Giant Branch (AGB) phase is the last nuclear burning phase for stars with initial masses between to 8, where the exact limits depend on the initial metallicity, . During the AGB there is a complex interplay of nucleosynthesis and mixing that alters the surface composition of the star. The enriched AGB envelope is eventually expelled into the interstellar medium (ISM) by a slow stellar wind thus enriching the local ISM with the products of hydrogen and helium burning, and heavy elements produced by the slow neutron capture process (the process). Hence these stars are important contributors to the chemical evolution of galaxies and stellar systems. For recent reviews of AGB evolution and nucleosynthesis see Busso et al. (1999) and Herwig (2005).
Briefly, during the TP-AGB phase the He-burning shell becomes thermally unstable every years or so, depending on the core mass. The energy from the thermal pulse (TP) or flash drives a convective pocket in the He-rich intershell, that mixes the products of He-burning nucleosynthesis within this region. Following a TP, the convective envelope may move inward (in mass) to regions previously mixed by the flash-driven convective pocket. This inward movement of the convective envelope is known as the third dredge-up (TDU), and is responsible for enriching the surface in and other products of He-burning, as well as heavy elements produced by the process in the He-rich intershell. Following the TDU, the star contracts and the H-shell is re-ignited, providing most of the surface luminosity for the next interpulse period. In AGB stars with initial masses , the base of the convective envelope becomes hot enough to sustain proton-capture nucleosynthesis (hot bottom burning, HBB). HBB can change the surface composition because the entire envelope is exposed to the hot burning region a few thousand times per interpulse period. AGB stars with HBB have short lifetimes ( Myr) and are one of the stellar sites proposed as the polluters of globular clusters (Cottrell & Da Costa, 1981; Gratton et al., 2004; Renzini, 2008), even if quantitative problems with the models exist (e.g., Fenner et al., 2004).
In Karakas & Lattanzio (2007) we presented AGB model data and stellar yields for masses between 1 and 6, and for metallicities , and . The main drawbacks of that study were that the reaction network dated back to 2003 and there have been significant changes to some of the important proton and -capture rates since that time. Second, the initial compositions for the and 0.004 models were not scaled solar, but had sub-solar C, N, and O compositions that were thought appropriate for the Large and Small Magellanic Clouds. We also did not investigate the effect of including a pocket in the top of the intershell region, which is required to produce neutrons by the reaction () during the interpulse period (Straniero et al., 1995). The neutrons released are required for the process but can also effect the abundance of elements lighter than iron in the He-intershell, and hence the stellar yields. Here we include a partially mixed zone in low-mass AGB models of 2, , and 3, , 0.008, and 0.004.
The main aims of this paper are to provide an update to the stellar yields presented in Karakas & Lattanzio (2007) using newer reaction rates, and to provide yields calculated from scaled-solar initial abundances for the and 0.004 models. We also present yields covering a finer mass grid than used previously, and new intermediate-mass AGB models. Here we define intermediate-mass models as having , except at where . Furthermore, we examine the effect of a partial mixing zone on the stellar yields of low-mass AGB stars. The new results are compared to the yields presented in Karakas & Lattanzio (2007), and to other recent AGB yields in the literature (e.g., Stancliffe & Jeffery, 2007; Stancliffe & Glebbeek, 2008; Cristallo et al., 2009; Ventura & D’Antona, 2009). Only comparisons between detailed AGB models are made; comparisons to synthetic AGB models (e.g., Marigo, 2001) was discussed in detail in Izzard et al. (2004). We also limit our discussion to AGB models with [Fe/H] ; see Campbell & Lattanzio (2008) for yields from very low-metallicity AGB models.
2 Numerical method
We calculate the structure first and perform detailed nucleosynthesis calculations afterward, using a post-processing algorithm. The details of this procedure and the codes used to compute the models have been previously described in some detail, see for example Karakas et al. (2002), Lugaro et al. (2004) and Karakas & Lattanzio (2007). In regards to the input physics used in the stellar structure computations, we employ the mixing-length theory of convection with (Frost & Lattanzio, 1996). At high temperatures we use the OPAL opacities (Iglesias & Rogers, 1996), and at low temperatures we employ two different prescriptions. The models of Karakas & Lattanzio (2007) and most of the new models here (see below) include an approximate treatment for the molecular opacities (in particular CN, CO, H2O, TiO) using the formulations from Bessell et al. (1989) and corrected by Chiosi et al. (1993). These fits do include some compositional dependence, but do not account for large variations in C/O or nitrogen. The second prescription we use is to include the low-temperature opacity tables from Ferguson et al. (2005) in place of the Bessell et al. (1989) fits.
The new AGB structure models are presented in Section 3. Some of these models have Vassiliadis & Wood (1993, hereafter VW93) mass loss on the AGB, as do the models presented in Karakas & Lattanzio (2007). We also compute new intermediate-mass AGB models using the Reimer’s mass-loss formula (Reimers, 1975, hereafter R75), and use them in place of the VW93 models presented in Karakas & Lattanzio (2007). The main reason for this is to use a higher mass loss rate than given by VW93 at this metallicity, which would allow the 6, model to be evolved to very low envelope mass. The VW93 6 model presented in Karakas & Lattanzio (2007) had TPs with very little reduction in envelope mass. The VW93 models are compared to the R75 models in Section 3.
We scale the R75 mass-loss formula to the metallicity of the model according to
| (1) |
where is in , the global metallicity of the stellar model, and the solar metallicity (0.02), and
| (2) |
here , and are the radius, luminosity and mass of the star (in solar units), respectively. We note that Decressin et al. (2004) apply a similar scaling to their low-metallicity, intermediate-mass AGB models. The free parameter used for each model is provided in Section 3. Equation 2 was used on the the first giant branch with in all stellar models.
The new stellar structure models are mostly computed with the same version of the Monash stellar structure code used in Karakas & Lattanzio (2007). The intermediate-mass AGB models of 4, 4.5, 5, 5.5, and 6 are computed using an updated version of the structure code that includes Ferguson et al. (2005) low-temperature opacities. To check for consistency, we compute a 4, model using both versions of the code. The results of the models are presented in Section 3.
The technique used in the post-processing nucleosynthesis computations have been described in detail elsewhere, see for example Karakas et al. (2009). Here we summarize information pertinent to the current models. We assume a network of 77 species from hydrogen to sulphur, along with a small group of iron-peak elements. Hence this study is limited to the nucleosynthesis of light elements. Yields of heavy elements produced by the process using the same codes are now becoming available, see Karakas et al. (2009) and Church et al. (2009). Most of the 589 reaction rates are from the JINA REACLIB database (Sakharuk et al., 2006)111http://groups.nscl.msu.edu/jina/reaclib/db/. The details of the reaction rates used are described in Section 2.1. We assume for the solar composition and take the initial abundances from Anders & Grevesse (1989). For all other models we assumed a scaled solar initial composition for all species.
2.1 Updated reaction rates
The reaction rate network used in the post-processing calculations is the recommended JINA REACLIB library (Sakharuk et al., 2006) with the following changes. We included the recommended rate for the (,)e reaction from Lee (2006) and used in Karakas et al. (2008). We used the e()g and e()g rates from Karakas et al. (2006), and the ()e rate from Ugalde et al. (2008).
Our current reaction rates differ significantly to the rates used in Karakas & Lattanzio (2007) for the following reasons. First, the NeNa and MgAl chain proton-capture rates have been updated. The most important changes are the e()a rate from Iliadis et al. (2001), the e()a rate from Hale et al. (2002), and the a()g and a()e rates from Hale et al. (2004). The g()l, the g()lg,m (where lg,m are the ground and meta-stable state of l respectively), the g()l and the l()i and l()g reaction rates are taken from Iliadis et al. (2001). Other important updates include the most recent evaluation of the () CNO rate from Bemmerer et al. (2006), and the revised triple- rate from Fynbo et al. (2005). Many of the rates are now from the NACRE compilation (Angulo et al., 1999) including the following CNO reactions: (), (), (), () and () rates. The () and () rates are from the more recent Chafa et al. (2007).
The neutron source reactions have also been updated including the () rate which is taken from NACRE, whereas previously we used the Denker et al. (1995) rate. Previously we used the Kaeppeler et al. (1994) rates for the e()g and e()g reactions, now we use the rates from Karakas et al. (2006).
Some of the important -decay rates have also been updated or corrected. For example, the REACLIB database used in Karakas & Lattanzio (2007) had an incorrect decay rate for e of 0.22 Myr; this has been corrected to 1.5 Myr in the current JINA REACLIB library.
2.2 The inclusion of a partial mixing zone
In AGB stars there are two important neutron producing reactions. The e()g reaction operates during the convective thermal pulses when K. This has been suggested to be the dominant neutron source in intermediate-mass AGB stars, whereas these temperatures are reached only in the last few TPs of lower mass () stars. The other potential source of neutrons in AGB stars is the () reaction, which operates at lower temperatures () than the e source. Observational and theoretical evidence suggests this is the dominant neutron source in low-mass AGB stars (Smith et al., 1987; Gallino et al., 1998).
To operate efficiently the () reaction requires more than is left over from CN cycling in the H-shell. Hence some mechanism to mix protons from the H-rich envelope into the intershell is needed to produce the extra . In our models, protons are mixed into the intershell region by artificially adding a partial mixing zone (PMZ) at the deepest extent of each TDU. These protons are captured by the abundant to form and , resulting in the formation of a pocket. In the pocket, neutrons are liberated by the reaction () during the interpulse period (Straniero et al., 1995).
The timescale for neutron production and the neutron source determine the resulting -process element distribution. The details of how the pocket forms and its extent in mass in the He-intershell are still unknown, although various mechanisms have been proposed including convective overshoot, rotation, and gravity waves; see Herwig (2005) for a discussion of the relative merits of each mechanism. In this study we are concerned with the effect of a PMZ and the () on light-element nucleosynthesis. The neutrons from this reaction are important for the production of e.g., (Forestini et al., 1992; Lugaro et al., 2004). The method we use to include a PMZ has been described in Lugaro et al. (2004), and is similar to that used by Goriely & Mowlavi (2000). We include a PMZ of constant mass of 0.002 at the deepest extent of each third dredge-up episode for the 3, , 0.008, and 0.004 models, and for the 2, model.
Here we only examine the effect of the PMZ on low-mass AGB models. This is because we add the partially-mixed zone in the post-processing step, so any potential feedback on the structure of the star is ignored. In intermediate-mass models of low-metallicity ( at ) the temperature at the base of the convective envelope during dredge-up may become hot enough for proton-captures (Goriely & Siess, 2004; Herwig, 2004a). The energy produced by these hot dredge-ups may effect the structure of the star, by increasing the depth of dredge-up (Herwig, 2004a), or by terminating the AGB altogether (Woodward et al., 2008). This situation could arise if the ingestion of protons leads to an hydrogen flame that produces enough energy to eject the envelope (Woodward et al., 2008). Consequences of proton ingestion on the nucleosynthesis is largely unknown but could include the inhibition of formation of the pocket (Goriely & Siess, 2004).
The models we consider in this study do not fall into the region of the mass–-plane where hot dredge-ups are predicted to occur (see Fig. 4 from Goriely & Siess, 2004). The 3, model is the only candidate for hot dredge-ups and in this model the peak temperature is K during a few dredge-up episodes, but accompanied by low densities (g/cm3). It is unlikely that proton captures occur during the TDU under these conditions, although further study into the inclusion of a PMZ on the structure of the 3, model is required. Note that we do not include a PMZ into the 3, model, as this would suffer hot dredge-ups, where the peak temperature at the base of the envelope during dredge-up is K.
Even if proton ingestion is unlikely to occur in our low-mass AGB models, these studies do point out the inconsistency of adding a PMZ into the post-processing calculation. For this reason the results presented in Section 4.2 should be treated with some caution. The trends described in this paper are likely to be qualitatively accurate but the actual extent of the effect of a PMZ may be different to that described here. Further detailed studies into the effects of a partial mixing zone on AGB nucleosynthesis is required, and will be the subject of a future investigation.
3 The AGB models
| Mass | ||||
|---|---|---|---|---|
| 1.0 | CHe | CHe | CHe | CHe,TDU |
| VW93 | VW93 | VW93 | VW93 | |
| 1.25 | CHe | CHe | CHe | CHe,TDU |
| VW93 | VW93 | VW93 | VW93 | |
| 1.5 | CHe | CHe | CHe,TDU | CHe,TDU |
| VW93 | VW93 | VW93 | VW93 | |
| 1.75 | CHe | CHe,TDU | CHe,TDU | CHe,TDU |
| VW93 | VW93 | VW93 | VW93 | |
| 1.9 | CHe | CHe,TDU | CHe,TDU | CHe,TDU |
| VW93 | VW93 | VW93 | VW93 | |
| 2.0(2.1) | CHe | CHe,TDU | CHe,TDU | TDU |
| VW93 | VW93 | VW93 | VW93 | |
| 2.25 | CHe,TDU | TDU | TDU | TDU |
| VW93 | VW93 | VW93 | VW93 | |
| 2.5 | TDU | TDU | TDU | TDU |
| VW93 | VW93 | VW93 | VW93 | |
| 3.0 | TDU | TDU | TDU | TDU,HBB |
| VW93 | VW93 | VW93 | R75, | |
| 3.5 | TDU | TDU | TDU | TDU,HBB |
| VW93 | VW93 | VW93 | R75, | |
| 4.0 | TDU | TDU,HBB | TDU,HBB | TDU, HBB |
| VW93 | VW93 | VW93 | R75, | |
| 4.5 | TDU,HBB | TDU,HBB | TDU,HBB | TDU, HBB |
| VW93 | VW93 | VW93 | R75, | |
| 5.0 | TDU,HBB | TDUHBB | TDU,HBB | TDU,HBB |
| VW93 | VW93 | VW93 | R75, | |
| 5.5 | TDU,HBB | TDUHBB | TDU,HBB | TDU,HBB |
| VW93 | VW93 | VW93 | R75, | |
| 6.0 | TDU,HBB | TDU,HBB | TDU,HBB | TDU,HBB |
| VW93 | VW93 | VW93 | R75, | |
| 6.5 | TDU,HBB | – | – | – |
| VW93 | – | – | – |
The grids of AGB models used to compute the updated yields are provided in Table 1. In this table it is noted if the model experienced the core He-flash, TDU and/or HBB, and the mass loss formulation employed on the AGB. Most of the models listed in Table 1 have been previously described in detail (e.g., Karakas & Lattanzio, 2003, 2007; Karakas et al., 2009). Here we restrict the discussion to the new AGB models, which are the 4.5 and 5.5, and 0.004, the 2.1, , and the 1.0, 1.5, 1.9, models with VW93 mass loss. The new intermediate-mass AGB models of 3.0, 3.5, 4.0, 4.5, 5.0, 5.5, and 6 are computed using R75 as described in Section 2. The parameter used for each model is listed in Table 1. These parameters were chosen as follows. Little is known about mass loss from low-metallicity AGB stars of intermediate mass. However, detailed evolution and nucleosynthesis models of such stars indicate that the total CNO content of the envelope quickly reaches similar levels found in AGB stars of much higher metallicity owing to a very efficient TDU (see in particular, §2.1 from Herwig, 2004b). Hence there is no good reason to suspect that the mass loss from these stars should be significantly lower than, say, AGB stars of . For this reason, we choose the parameters such that the final number of thermal pulses is similar to that found in models of the same mass. We note that these choices are arbitrary, and changes in will have a strong impact on the chemical yields.
In Table 2 we present some structural details from the new models including the initial mass and metallicity, the final core and envelope mass ( and , respectively), the number of TPs computed, and the total amount of matter dredged up into the envelope during the TP-AGB phase (). All masses are in solar units. There are two entries for the 4, case. The first line shows the results computed with the code that includes Ferguson et al. (2005) low-temperature opacities, the second with the older version used to compute the models listed above that in Table 2. The most important parameters, from a nucleosynthetic point of view, are the total number of thermal pulses as this determines how much material from the He-shell is mixed into the envelope, and the efficiency of HBB. These numbers are similar, although the model computed with the older code ended with a higher final envelope mass and could, in principle, experience at least one more TP. The effect of the (scaled solar composition) Ferguson et al. (2005) low-temperature opacities on the evolution is small at such low metallicities, and is the main reason for the consistency between the two 4 models. The use of carbon-rich low temperature opacities may have a much larger impact, owing to the fact that all of the models, even the 1 and 6 models, become carbon rich with a final C/O .
We provide an electronic on-line table with details of each new stellar model as a function of TP number; (Table A1). This data are similar to the tables presented in Karakas & Lattanzio (2007) but with the inclusion of the radius, bolometric luminosity, and effective temperature. These tables include, for each TP, the core mass (), the maximum extent of the flash-driven convective region (), the duration of flash-driven convection (), the amount of matter dredged into the envelope after that pulse (Ddredge), the third dredge-up efficiency parameter (), and defined by Goriely & Mowlavi (2000) to be . The TDU efficiency parameter, , is usually defined according to , where is the amount by which the core mass has grown between the present and previous TPs.
Further, we provide the maximum temperature in the He-shell (THeshell), the maximum temperature at the base of the convective envelope during the previous interpulse period (Tbce), the maximum temperature in the H-shell (THshell), the interpulse period, the total mass at the beginning of the TP, the maximum radiated luminosity during the previous interpulse period (MaxL), the maximum luminosity generated by the TP (MaxLHe), the maximum radius during the previous interpulse period (maxR), the bolometric luminosity (), and finally, the effective temperature (). All units are in solar units with the exception of temperatures, that are in kelvin, and all times which are in years.
| Mass | No. TP | ||||
|---|---|---|---|---|---|
| 4.5 | 0.02 | 0.853 | 0.692 | 21 | 0.053 |
| 5.5 | 0.02 | 0.900 | 0.800 | 36 | 0.075 |
| 4.5 | 0.008 | 0.861 | 0.670 | 38 | 0.141 |
| 5.5 | 0.008 | 0.907 | 0.864 | 56 | 0.143 |
| 2.1 | 0.004 | 0.650 | 0.090 | 20 | 0.058 |
| 4.5 | 0.004 | 0.873 | 1.160 | 50 | 0.177 |
| 5.5 | 0.004 | 0.932 | 0.484 | 71 | 0.154 |
| 1.0 | 0.0001 | 0.726 | 8.5() | 26 | 2.6 |
| 1.5 | 0.0001 | 0.662 | 0.022 | 18 | 0.06 |
| 1.9 | 0.0001 | 0.682 | 0.029 | 24 | 0.170 |
| 3.0 | 0.0001 | 0.812 | 0.120 | 20 | 0.106 |
| 3.5 | 0.0001 | 0.854 | 0.136 | 27 | 0.103 |
| 4.0 | 0.0001 | 0.872 | 0.133 | 37 | 0.128 |
| 0.876 | 0.477 | 36 | 0.115 | ||
| 4.5 | 0.0001 | 0.898 | 0.085 | 41 | 0.109 |
| 5.0 | 0.0001 | 0.929 | 0.123 | 56 | 0.122 |
| 5.5 | 0.0001 | 0.966 | 0.085 | 77 | 0.124 |
| 6.0 | 0.0001 | 1.008 | 0.183 | 109 | 0.127 |
We briefly comment on the 1, model. This model experienced 26 TPs and had a final core mass of 0.72, higher than found in metal-rich models of the same initial mass (e.g., 0.56 at ). The 1, experienced shallow TDU after the 5th and 6th TPs (the core mass was at the 6th TP). The small amount of TDU was enough to make the star carbon rich, where C/O . The addition of primary into the envelope had a dramatic effect on the evolution of the star. This is because the extra changed the rate of nuclear burning in the H-shell. The additional energy caused a significant shortening of the interpulse period from 440,000 years at the 6th TP to 240,000 years, followed by a steady decrease to 45,000 years, and there was no further TDU. Similar behaviour was reported by Stancliffe & Glebbeek (2008) for the same mass and metallicity.
For the remainder of this section we compare the R75 models to the VW93 models from Karakas & Lattanzio (2007). We will use the 3 and 6, models as examples. The 3 model with VW93 had 40 TP and dredged a total of 0.242 into the envelope. This model also experienced HBB with a peak temperature of K. The final core mass was 0.82. In comparison, the model with R75 mass loss had 20 TPs and dredged 0.106 into the envelope. This model only had mild HBB, with a peak temperature of K. The final core mass was 0.81, probably the only similarity to the VW93 model.
In contrast, both 6, models had about the same number of TPs: 106 in the VW93 case compared to 109 in the case of the R75 model. The peak temperature at the base of the envelope was also similar at K, along with the total amount of matter dredged into the envelope, (0.114 for the VW93 model compared to 0.127). The real difference between the models is that the R75 model was evolved to a small envelope mass of only , which led to the cessation of HBB. This can be seen in Figure 1 where we illustrate the evolution of the temperature at the base of the convective envelope during the TP-AGB for the R75 (top panel) and VW93 (lower panel) models. In the top panel the temperature drops dramatically to below K during the last few TPs. This is caused by the rapid reduction in the envelope mass. In comparison the VW93 model (top panel) only loses during the AGB and we expect that this model may experience at least another TPs, setting the yields presented in Karakas & Lattanzio (2007) as lower limits.


4 Stellar Yields
To compute the yields we integrate the mass lost from the model star during the entire stellar lifetime according to
| (3) |
where is the yield of species (in solar masses), is the current mass-loss rate, and refer to the current and initial mass fraction of species , and is the total lifetime of the stellar model. The yield can be negative, in the case where the element is destroyed, and positive if it is produced. We also present the total amount of (in ) expelled into the ISM, noting that this value is always positive.
The stellar yields for the models listed in Table 1 are available as electronic on-line tables. We provide one table for each metallicity (Tables A2 to A5). in the Appendix for an example. Each table contains the following: 1) the nuclear species, , 2) the atomic mass, A(), 3) the net stellar yield defined above, 4) the amount of species in the wind lost from the star, mass, 5) the amount of that would have initially been present in the wind, mass. The quantity mass is the mass expelled during the stellar lifetime multiplied by the initial mass fraction. We next include 6) the average mass fraction of in the wind, , 7) the initial mass fraction , and 8) the production factor defined by . All yields are in solar masses and abundances in mass fraction. These yields are presented in the same format as in Karakas & Lattanzio (2007). We note that there are two entries for l: the first shows the yields for the longer-lived ground state lg which has a half life of years and is denoted by the symbol “al-6” in the on-line tables; “al” refers to the short-lived meta-stable state. The yields of “al-6” should be added to that of g for chemical evolution studies.
In Karakas & Lattanzio (2007) we discussed the inclusion of of synthetic TPs to account for TPs not computed in detail. This was done because some of the models had reasonably large envelope masses at the end of the computation and could, in principle, experience further TPs and dredge-up. We do not repeat that discussion here but we also do not include the contribution of these synthetic TPs for the following reason. We would need to make an assumption about the efficiency of the third dredge-up parameter at small envelope mass, and this is a unknown. There is evidence to suggest that decreases with decreasing envelope masses for low-mass (Straniero et al., 1997; Karakas et al., 2002) and intermediate-mass AGB stars (Vassiliadis & Wood, 1993). The new intermediate-mass AGB models presented here were evolved to small envelope masses ( in some cases). These models do not in general show any decrease in with decreasing envelope mass. However, it should be pointed that low-metallicity models tend to experience more efficient mixing than metal-rich AGB stellar models (e.g., Boothroyd & Sackmann, 1988; Karakas et al., 2002).
One last difference between the yields presented here and in Karakas & Lattanzio (2007) is that we do not specifically provide yields for planetary nebulae (PNe). That is because column 6 of the on-line yield tables provides the average mass fraction of the wind. This value is weighted toward the composition of the envelope during the last few TPs, because that is when most of the mass is lost from the star. Hence this value is suitable for comparison to PNe abundances. The models computed using the R75 mass-loss formula have not had their mass loss weighted toward the final few TPs, as they would have if we were to use the VW93 prescription. However few, if any, PNe should exist that have evolved from intermediate-mass AGB stars. The few PNe found in the Galactic Halo likely evolved from stars with initial masses closer to .
4.1 Comparison to previous work
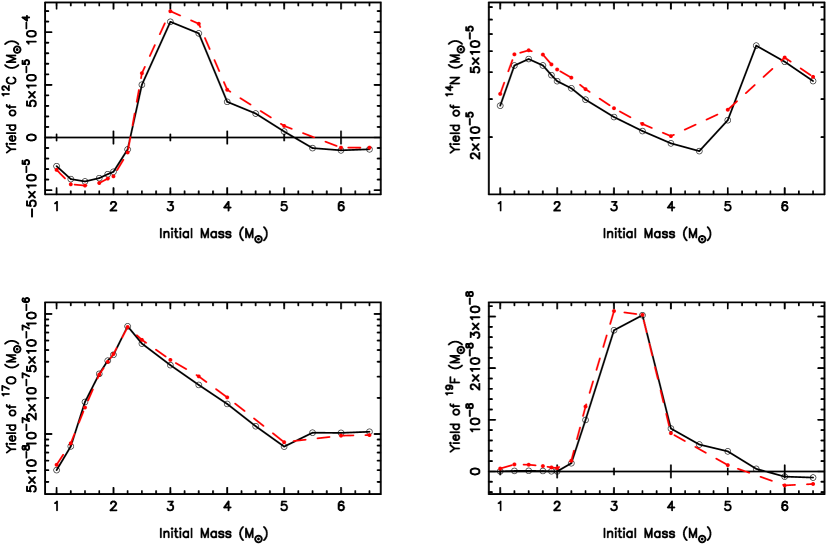
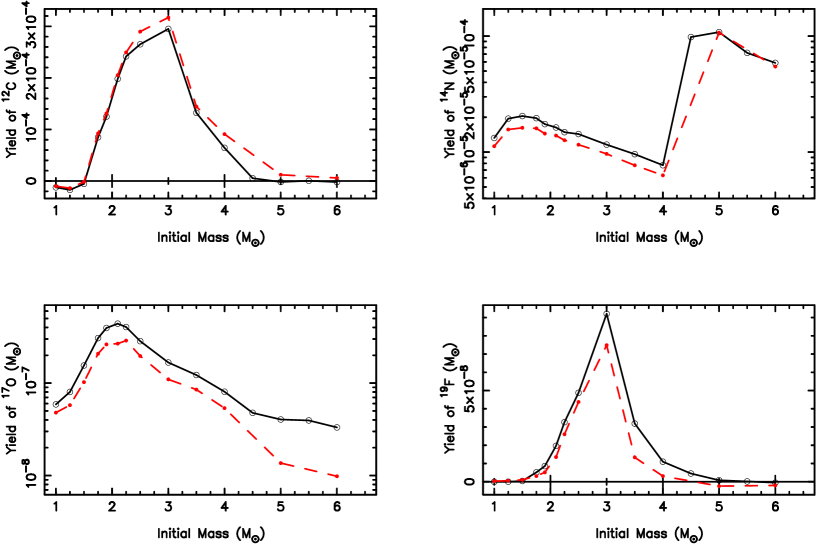
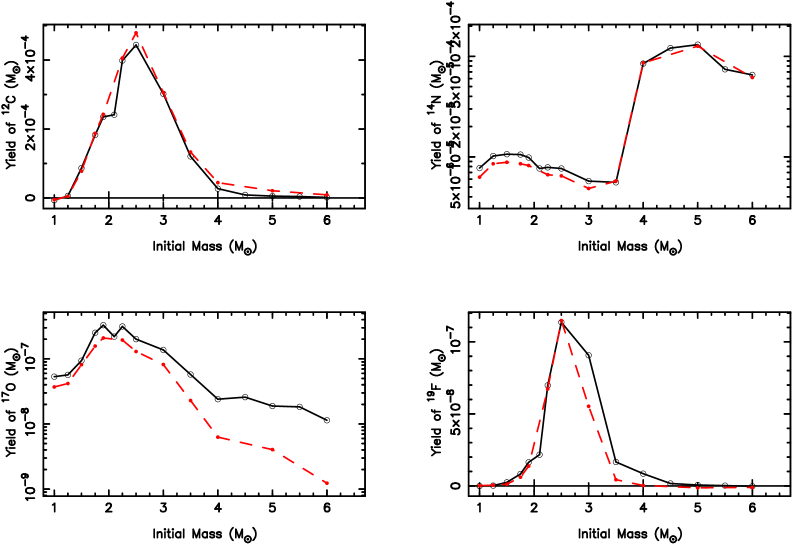
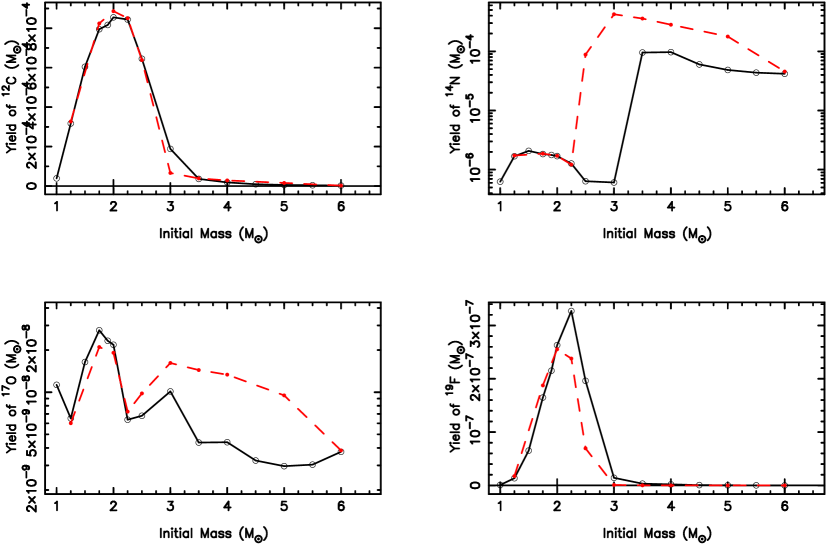
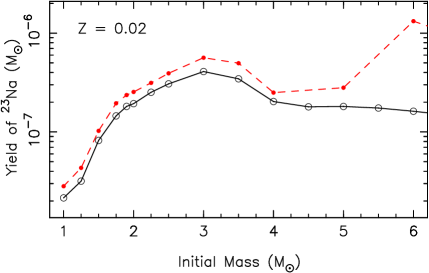
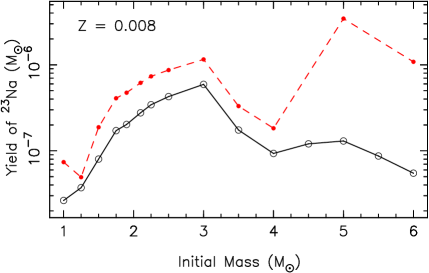
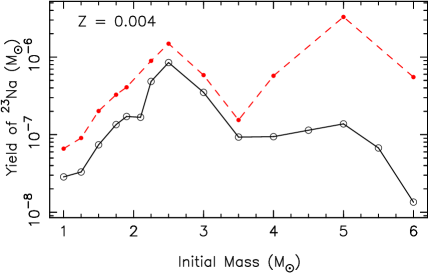
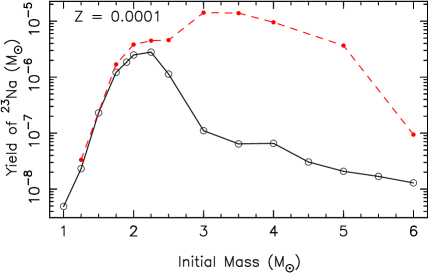
In Figures 2 to 5 we show the weighted yields of , , , and from this study and from Karakas & Lattanzio (2007) for the , and models, respectively. In each plot, the yields have been weighted by the initial mass function (IMF) from Kroupa et al. (1993). Note for this comparison that we are using the yields from Karakas & Lattanzio (2007) with no contribution from synthetic TPs. These isotopes were chosen to be representative of light element nucleosynthesis in AGB stars of various mass.
At , the new yields of , , and are reasonably consistent with the yields from Karakas & Lattanzio (2007). We see small reductions in the yield of for , and small increases in the yields of for . The yields of are systematically lower for masses less than 4, whereas above this we can see the effect of a finer mass grid on the shape of the yield as a function of stellar mass. For the and 0.004 models (Figures 3 and 4) we see a similar trend as seen for , although the new yields of and are generally larger. The and yields are remarkably consistent, indicating that the change of reaction rates or initial abundances has not had a significant impact on the yields of these important isotopes.
The new model yields are consistent with the old yields for and for . The main difference for fluorine is that the peak production is shifted to 2.5 from 2.25, as a consequence of using the lower ()e destruction rate from Ugalde et al. (2008). The main difference between the yields in Figure 5 are for and . In both cases, the new yields produce less of each isotope at a given mass for . The differences observed at 2.5 are surprising, since we are using the same structure model. The changes in the yields at this mass are a consequence of the new reaction rates (and in particular the new () and rates). However the difference for is most apparent at 3, where the variation is a factor of . If we assume that the rates have introduced at least a factor of two variation, then the change of structure model (using the R75 model instead of the VW93) is still by far the most significant factor. For , the new intermediate-mass models result in smaller yields for , with the biggest variation at .
In Figure 6 we show the weighted yields of a for the , 0.008, 0.004, and 0.0001 models, again comparing the new yields to the yields from Karakas & Lattanzio (2007). It is for this element that we see the largest differences as a result of using the new reaction rates. The new yields are systematically lower for all stellar models computed. Table 3 shows that the variation increases with increasing mass, and at a given mass, with decreasing metallicity. That is, models with HBB show the largest impact of using the new a()g and a()e reaction rates from Hale et al. (2004), which are faster than the El Eid & Champagne (1995) rates that we used previously. This has resulted in higher rates of a destruction and dramatically lower yields of sodium for for all metallicities. Izzard et al. (2007) found a similar result using both detailed and synthetic AGB models and a similar set of reaction rates. Ventura & D’Antona (2005) discussed the variation of a production as a result of uncertainties in reaction rates. They compared the Caughlan & Fowler (1988) rates to the NACRE database, and found similarly large differences as reported here.
| Initial mass | New a yield | Old a yield | Factor difference | |
|---|---|---|---|---|
| 3.0 | 0.02 | 5.0942(5) | 7.0317(5) | 1.38 |
| 3.5 | 0.02 | 6.5188(5) | 9.3885(5) | 1.44 |
| 4.0 | 0.02 | 5.5071(5) | 6.7809(5) | 1.23 |
| 5.0 | 0.02 | 8.9715(5) | 1.3889(4) | 1.55 |
| 6.0 | 0.02 | 1.3131(4) | 1.0715(3) | 8.16 |
| 6.5 | 0.02 | 1.4863(4) | 1.0026(3) | 6.75 |
| 3.0 | 0.008 | 7.3897(5) | 1.4416(4) | 1.95 |
| 3.5 | 0.008 | 3.2963(5) | 6.2545(5) | 1.90 |
| 4.0 | 0.008 | 2.5255(5) | 4.9604(5) | 1.96 |
| 5.0 | 0.008 | 6.4444(5) | 1.7090(3) | 26.5 |
| 6.0 | 0.008 | 4.4473(5) | 8.7833(4) | 19.7 |
| 3.0 | 0.004 | 4.3768(5) | 7.2967(5) | 1.67 |
| 3.5 | 0.004 | 1.7585(5) | 2.9209(5) | 1.66 |
| 4.0 | 0.004 | 2.5553(5) | 1.5553(4) | 6.09 |
| 5.0 | 0.004 | 6.8179(5) | 1.6316(3) | 23.9 |
| 6.0 | 0.004 | 1.0933(5) | 4.4738(4) | 40.9 |
| 3.0 | 0.0001 | 1.3794(5) | 1.7719(3) | 128 |
| 3.5 | 0.0001 | 1.2139(5) | 2.6254(3) | 216 |
| 4.0 | 0.0001 | 1.7816(5) | 2.5865(3) | 145 |
| 5.0 | 0.0001 | 1.0310(5) | 1.8136(3) | 176 |
| 6.0 | 0.0001 | 7.0570(6) | 7.6308(5) | 10.8 |
| 6.0 | 0.0001 | 1.0482(5) | – | – |
4.2 The effect of a partial mixing zone
In this section we consider the effect of a partially mixed zone inserted at the deepest extent of each third dredge-up episode on the stellar yields. In Table 4 we show the yields for selected isotopes from the 3 models. The yields for all species for each model with a PMZ is included as an on-line data table (Table A6). The effect of a PMZ on the nucleosynthesis of a 2, model of is discussed in Section 4.3 in comparison to results from Cristallo et al. (2009). In each model, a PMZ of 0.002 has been inserted. Note that in the computations the same initial abundances and reaction rate network are used. The only variation is the inclusion of a partially mixed zone at the deepest extent of each dredge-up episode.
The extra in the intershell results in higher yields of e, and hence also a. The production of a occurs via the e()e()a sequence of reactions (Goriely & Mowlavi, 2000; Herwig, 2004b), and is the main explanation for the increase in this element in Table 4. The neutrons from the () reaction are also responsible for enrichments in other isotopes, including , e, g, g, l, l, i, i, , and e.
The isotopes of and e are only produced by neutron capture in AGB stars. The production of the radioactive e requires high neutron densities to overcome the branching at e. Hence e production is primarily via the e()g source during TPs. Hence the 3, model without a PMZ produces very little or e, as it is not hot enough to sustain the e()g source during TPs, and without a PMZ, does not have enough present to produce any neutron capture elements. The increase of e caused by the PMZ is the result of the extra e in the intershell (from ) causing a slightly higher activation of the e()g reaction. The difference in the production of and e is lessened in the lower metallicity models, mostly as a consequence of partial activation of the e neutron source in models without a PMZ.
| e | a | g | g | i | e | |||
|---|---|---|---|---|---|---|---|---|
| 0.02 | 3.4087() | 1.8092() | 5.0942() | 1.0767() | 1.3568() | 7.7026() | 8.0023() | 9.5257() |
| 4.1292() | 3.4512() | 9.2811() | 2.1733() | 2.5835() | 3.1746() | 1.6082() | 2.2711() | |
| 21.1% | 90.8% | 82.2% | 102% | 90.4% | 312% | 1910% | 138% | |
| 0.008 | 1.1481() | 4.2290() | 7.3897() | 6.7804() | 7.3233() | 2.5349() | 2.7079() | 3.4270() |
| 1.3700() | 7.5472() | 1.6357() | 1.0954() | 1.3010() | 3.1024() | 2.1346() | 4.0355() | |
| 19.3% | 78.5% | 121% | 61.6% | 77.6% | 22.4% | 688% | 17.8% | |
| 0.004 | 1.1311() | 3.4789() | 4.3768() | 1.0715() | 1.4453() | 2.9138() | 4.1899() | 1.4891() |
| 1.4083() | 6.9083() | 1.0657() | 1.8292() | 2.7583() | 3.8189() | 1.9773() | 1.7557() | |
| 24.5% | 98.6% | 143% | 70.7% | 90.8% | 31.1% | 372% | 18.0% |
4.3 Comparison to other authors
In this section we compare the structure and yields from the 2, model to the comparative model from Cristallo et al. (2009). For the sake of the comparison we compute a 2, model with a PMZ of 0.002, which results in a pocket that is % of the mass of the intershell. This is because all the models in Cristallo et al. (2009) have pockets that formed as a consequence of the algorithm used to find the convective border following a TP. We assumed an exponentially-decaying proton profile in our PMZ models and this results in a pocket that is similar in shape to the case in Cristallo et al. (2009, see the top panel of Fig. 4). The case is their adopted value in the full detailed nucleosynthesis computations. An important difference is the mass extent of the pocket. From the top panel of Fig. 4 in Cristallo et al. (2009), we estimate222these mass estimates are smaller than the effective pocket size defined in Cristallo et al. (2009). In either case our pockets are somewhat smaller. that the extent of the pocket (where the abundance is larger than the abundance) to be , whereas in our model we obtain a value about 1.5 times smaller, at . This mass difference has important implications for the nucleosynthesis as discussed below.
The main difference between the models is the treatment of convective borders, and the use of carbon and nitrogen-rich low-temperature opacities in the Cristallo et al. (2009) model. The effect of C-rich opacities on AGB evolution was first discussed by Marigo (2002), who noted that once C/O the star cools and mass loss increases, shortening the TP-AGB lifetime. This has the effect of reducing the total number of TPs (Cristallo et al. find 15, we have 26), and the total amount of mass dredged up into the envelope (our model dredges up 30% more He-shell material).
| Model | a | g | i | e | ||||||
|---|---|---|---|---|---|---|---|---|---|---|
| No PMZ | 3.57() | 7.08() | 5.15() | 1.10() | 1.04() | 4.87() | 6.53() | 1.39() | 1.18() | |
| PMZ | 3.27() | 6.73() | 1.07() | 9.52() | 1.30() | 2.26() | 7.64() | 9.14() | 1.30() | 7.04() |
| C09 | 1.71() | 3.40() | 4.03() | 2.44() | 1.38() | 2.55() | 9.89() | 3.53() | 5.76() | |
| 91.2% | 98.0% | 152% | 136% | 433% | 154% | 200% | 7.60% | % | 87.8% |
The structural differences between the Cristallo et al. (2009) model and ours is reflected in the stellar yields provided in Table 5. Cristallo et al. also used different initial abundances, scaling their model to the solar abundances of Asplund et al. (2005) (, smaller than our ). The differences caused by this are hard to asses, as they did not provide their initial abundances (ours are given in column 7 in the on-line yield data tables). Even so, we find relatively large variations for all isotopes, even those not directly produced by He-burning such as . In these low-metallicity models, most of the is produced during the AGB, as a consequence of the dredge-up of material processed by CNO cycling in the H-shell. Our yields of He-burning products including , , , are larger as expected from our model dredging up more He-intershell material. The increase in the surface abundance of results in a final [O/Fe] , and the planetary nebulae formed from such an object would show the dredge-up of oxygen. The metallicity dependent enrichment in O predicted by our models has been reported by Magrini & Gonçalves (2009) for planetary nebulae in the galaxy IC 10.
Back to the comparison to Cristallo et al. (2009), while our yields of He-burning products are larger, the products of neutron captures (e.g., ) along with l and l are smaller. This is a consequence of our smaller pocket (at least as measured at the 2nd TDU). The variations range from only % for l up to % for e. These variations may also reflect different choices of reaction rates (e.g., for Al). One interesting difference is that our 2 model with a PMZ produces a positive yield of , whereas both the model without a PMZ and the Cristallo et al. (2009) model have negative yields, indicating a net destruction. The positive yield indicates that some is produced during TPs by the () reaction rate, which is part of the fluorine production chain (see Lugaro et al., 2004). The difference in the surface abundance between the models with and without a PMZ is %, and most of this extra is produced during the first few TPs when the temperature is not yet hot enough for efficient destruction (or production). By the last TPs, the produced in the convective TP is rapidly destroyed in models with and without a PMZ.
Stancliffe & Jeffery (2007) made a careful comparison between the 1.5, yields from Karakas & Lattanzio (2007) to their VW93 model, whereas Stancliffe & Glebbeek (2008) compared models of . The main difference that Stancliffe & Jeffery (2007) found for the 1.5, model was that their calculation experienced more efficient dredge-up, and hence positive net yields of , e, and g. In comparison, our model had little dredge-up with only a total of 1.47 of He-shell material mixed into the envelope. Stancliffe & Jeffery (2007) noted that the yields of isotopes dependent on the efficiency of the first dredge-up (e.g., ) were reasonably consistent, given that their models had scaled-solar initial abundances and the Karakas & Lattanzio (2007) model did not. From our updated model with scaled-solar initial abundances, we find an agreement of % between the yields.
Stancliffe & Glebbeek (2008) have made a detailed comparison to the models available in Karakas & Lattanzio (2007); here we limit our discussion to the new 1.5, model. Our model has 18 TPs compared to their 10, and dredged up % more material from the He-intershell (R. Stancliffe, private communication). Hence our yields of , , and e are larger by 9%, 64%, and 62% respectively. The Stancliffe & Glebbeck yields for a are almost identical, differing by less than 1%, whereas their model produces almost 100% more g and . The last point can be understood by considering that the e()g reaction is marginally activated during TPs at this mass and metallicity, and Stancliffe & Glebbeek (2008) used the faster rate from Kaeppeler et al. (1994). That the yields for a are the same is a coincidence. Our model produces more e and would produce more a, but we use the new faster a proton destruction rates.
Lastly, we compare the results from the new intermediate-mass models to the models presented by Ventura & D’Antona (2009). These authors also provide a detailed comparison to Karakas & Lattanzio (2007) so here we comment on some of the major changes introduced by using the new R75 structure models and the large reduction in the Na yields. The new 4, model has a similar number of TPs (37) to the 4 model computed by Ventura & D’Antona (2009) (32), whereas our 6 had 109 TPs compared to their 77 TPs. Furthermore, owing to the different convective model used in the Ventura & D’Antona (2009) calculations (the Full Spectrum of Turbulence compared to our use of the mixing-length theory with ), the temperatures at the base of the envelope in our models were significantly lower. Our 4 model peaked at 88K compared to 92K; likewise our 6 peaked at 104K compared to 127K in the Ventura & D’Antona (2009) model. Finally, one other major difference is evident in the efficiency of the third dredge-up where our models show for whereas in the Ventura & D’Antona models varied from at to 0.3 at 6.
These structural differences show up vividly in the chemical yields. All our models have a final C/O , whereas only the 6, Ventura & D’Antona (2009) model has C/O and only as a consequence of O destruction. The final surface [O/Fe] of our 4 and 6 models are 1.19 and 1.14, respectively, compared to 1.08 and for the Ventura & D’Antona (2009) models. The 4 yields for Na are the same, where the final surface [Na/Fe] abundance is 1.89 compared to 1.90 for the Ventura & D’Antona (2009) model. In contrast, the [Na/Fe] abundances from the 6 models are vastly different: ours is 1.71 compared from Ventura & D’Antona (2009) model. This is almost entirely owing to their choice of convective model that results in much higher HBB temperatures and hence higher rates of a destruction.
5 Conclusions
In this paper we present new stellar yields of AGB models covering a range in initial mass from 1 to 6, and initial metallicity from to 0.0001. These yields are an update to the results presented in Karakas & Lattanzio (2007), using newer reaction rates and scaled-solar initial abundances for the and 0.004 models. We also present yields covering a finer mass grid than used previously, and new intermediate-mass AGB models between 3 and 6. The new models were evolved to low () envelope masses, with no reduction in the third dredge-up parameter () observed.
The main result of this paper is large reductions in the yields of a from models with HBB. This has implications for the chemical evolution of galaxies and stellar systems, and in particular for globular clusters. In contrast, the updated reaction network only results in small changes to the yields of , , and . The largest changes for these isotopes are caused by using new structure models at . These new structure models experience fewer TPs and TDU episodes, and this results in large reductions in the yields of and .
We examine the effect of a partial mixing zone on the stellar yields of low-mass AGB models. Partial mixing zones are added into models of 2, , and 3, and 0.004. The partial mixing zone results in a pocket in the top of the He-intershell and releases neutrons via the () reaction. The pocket not only affects the production of but also other isotopes including a, the neutron-rich Mg and Si isotopes, , and e. In particular, the yields of and e are the most affected by the introduction of the PMZ, where the yields of increase by factors of to 20 at 3 depending on metallicity. Larger variations are found in the most metal-rich models. Because the PMZ is added into the post-processing step we ignore any feedback onto the stellar structure caused by the formation of the pocket. For this reason the yields should be treated with some caution. A full detailed study taking into account the feedback onto the stellar structure is necessary.
The new results are compared to the yields from Karakas & Lattanzio (2007), and to other recent AGB yields in the literature including Stancliffe & Jeffery (2007), Cristallo et al. (2009), and Ventura & D’Antona (2009). The main result is that the structural differences between the calculations are still the dominant cause of variations between the nucleosynthesis predictions. In particular, the treatment of convection and the algorithm used to determine convective borders are still important problems that need to be addressed in the future.
One important piece of input physics missing from the models presented here is the inclusion of carbon and nitrogen-rich low-temperature opacities. While the approximate treatment of molecular opacities we used in most models does include some compositional dependence, the low-temperature tables from Ferguson et al. (2005) are for solar or scaled-solar mixtures only. The yields presented here and by many other authors show the complex nucleosynthesis that can occur during the TP-AGB (e.g., C/O , C/N ). The composition of the envelope needs to be properly taken into account when determining the opacities of the outer layers. Such C and N-rich low-temperature opacity tables are now becoming available (Lederer & Aringer, 2009; Helling & Lucas, 2009; Marigo & Aringer, 2009), and used in detailed stellar-structure computations (Cristallo et al., 2009). Stellar models using these opacities will need to be computed in the future for the size of the mass and metallicity grid presented here.
Acknowledgments
The author thanks the referee, Falk Herwig, for critical comments concerning 13C pockets in AGB stars. The author thanks Maria Lugaro for reading the manuscript and for help with the reaction rate network. She thanks Simon Campbell for sharing opacity subroutines used in the stellar evolution code, and Richard Stancliffe for providing results ahead of publication. AIK acknowledges support from the Australian Research Council’s Discovery Projects funding scheme (project number DP0664105). This study was made possible thanks to the support of the NCI National Facility at the ANU.
References
- Anders & Grevesse (1989) Anders E., Grevesse N., 1989, Geochim. Cosmochim. Acta, 53, 197
- Angulo et al. (1999) Angulo C., et al. 1999, Nucl. Phys. A, 656, 3
- Asplund et al. (2005) Asplund M., Grevesse N., Sauval A. J., 2005, in Barnes III T. G., Bash F. N., eds, ASP Conf. Ser. 336, “Cosmic Abundances as Records of Stellar Evolution and Nucleosynthesis”, 25
- Bemmerer et al. (2006) Bemmerer D., et al. 2006, Nucl. Phys. A, 779, 297
- Bessell et al. (1989) Bessell M. S., Brett J. M., Wood P. R., Scholz M., 1989, A&AS, 77, 1
- Boothroyd & Sackmann (1988) Boothroyd A. I., Sackmann I.-J., 1988, ApJ, 328, 653
- Busso et al. (1999) Busso M., Gallino R., Wasserburg G. J., 1999, ARA&A, 37, 239
- Campbell & Lattanzio (2008) Campbell S. W., Lattanzio J. C., 2008, A&A, 490, 769
- Caughlan & Fowler (1988) Caughlan G. R., Fowler W. A., 1988, Atomic Data and Nuclear Data Tables, 40, 283
- Chafa et al. (2007) Chafa A., et al. 2007, Phys. Rev. C, 75, 035810
- Chiosi et al. (1993) Chiosi C., Wood P. R., Capitanio N., 1993, ApJS, 86, 541
- Church et al. (2009) Church R. P., Cristallo S., Lattanzio J. C., Stancliffe R. J., Straniero O., Cannon R. C., 2009, Publications of the Astronomical Society of Australia, 26, 217
- Cottrell & Da Costa (1981) Cottrell P. L., Da Costa G. S., 1981, ApJ, 245, L79
- Cristallo et al. (2009) Cristallo S., Straniero O., Gallino R., Piersanti L., Domínguez I., Lederer M. T., 2009, ApJ, 696, 797
- Decressin et al. (2004) Decressin T., Charbonnel C., Siess L., Palacios A., 2004, Memorie della Societa Astronomica Italiana, 75, 682
- Denker et al. (1995) Denker A., et al. eds, Nuclei in the Cosmos III Vol. 327, 255
- El Eid & Champagne (1995) El Eid M. F., Champagne A. E., 1995, ApJ, 451, 298
- Fenner et al. (2004) Fenner Y., Campbell S., Karakas A. I., Lattanzio J. C., Gibson B. K., 2004, MNRAS, 353, 789
- Ferguson et al. (2005) Ferguson J. W., et al. 2005, ApJ, 623, 585
- Forestini et al. (1992) Forestini M., Goriely S., Jorissen A., Arnould M., 1992, A&A, 261, 157
- Frost & Lattanzio (1996) Frost C. A., Lattanzio J. C., 1996, ApJ, 473, 383
- Fynbo et al. (2005) Fynbo H. O. U., et al. 2005, Nature, 433, 136
- Gallino et al. (1998) Gallino R., et al. 1998, ApJ, 497, 388
- Goriely & Mowlavi (2000) Goriely S., Mowlavi N., 2000, A&A, 362, 599
- Goriely & Siess (2004) Goriely S., Siess L., 2004, A&A, 421, L25
- Gratton et al. (2004) Gratton R., Sneden C., Carretta E., 2004, ARA&A, 42, 385
- Hale et al. (2002) Hale S. E., Champagne A. E., Iliadis C., Hansper V. Y., Powell D. C., Blackmon J. C., 2002, Phys. Rev. C, 65, 015801
- Hale et al. (2004) Hale S. E., Champagne A. E., Iliadis C., Hansper V. Y., Powell D. C., Blackmon J. C., 2004, Phys. Rev. C, 70, 045802
- Helling & Lucas (2009) Helling C., Lucas W., 2009, MNRAS, 398, 985
- Herwig (2004a) Herwig F., 2004a, ApJ, 605, 425
- Herwig (2004b) Herwig F., 2004b, ApJS, 155, 651
- Herwig (2005) Herwig F., 2005, ARA&A, 43, 435
- Iglesias & Rogers (1996) Iglesias C. A., Rogers F. J., 1996, ApJ, 464, 943
- Iliadis et al. (2001) Iliadis C., D’Auria J. M., Starrfield S., Thompson W. J., Wiescher M., 2001, ApJS, 134, 151
- Izzard et al. (2007) Izzard R. G., Lugaro M., Karakas A. I., Iliadis C., van Raai M., 2007, A&A, 466, 641
- Izzard et al. (2004) Izzard R. G., Tout C. A., Karakas A. I., Pols O. R., 2004, MNRAS, 350, 407
- Kaeppeler et al. (1994) Kaeppeler F., et al. 1994, ApJ, 437, 396
- Karakas & Lattanzio (2003) Karakas A. I., Lattanzio J. C., 2003, PASA, 20, 393
- Karakas & Lattanzio (2007) Karakas A. I., Lattanzio J. C., 2007, PASA, 24, 103
- Karakas et al. (2002) Karakas A. I., Lattanzio J. C., Pols O. R., 2002, PASA, 19, 515
- Karakas et al. (2008) Karakas A. I., Lee H. Y., Lugaro M., Görres J., Wiescher M., 2008, ApJ, 676, 1254
- Karakas et al. (2006) Karakas A. I., Lugaro M., Wiescher M., Goerres J., Ugalde C., 2006, ApJ, 643, 471
- Karakas et al. (2009) Karakas A. I., van Raai M. A., Lugaro M., Sterling N. C., Dinerstein H. L., 2009, ApJ, 690, 1130
- Kroupa et al. (1993) Kroupa P., Tout C. A., Gilmore G., 1993, MNRAS, 262, 545
- Lederer & Aringer (2009) Lederer M. T., Aringer B., 2009, A&A, 494, 403
- Lee (2006) Lee H. Y., 2006, PhD thesis, University of Notre Dame
- Lugaro et al. (2004) Lugaro M., Ugalde C., Karakas A. I., Görres J., Wiescher M., Lattanzio J. C., Cannon R. C., 2004, ApJ, 615, 934
- Magrini & Gonçalves (2009) Magrini L., Gonçalves D. R., 2009, MNRAS, 398, 280
- Marigo (2001) Marigo P., 2001, A&A, 370, 194
- Marigo (2002) Marigo P., 2002, A&A, 387, 507
- Marigo & Aringer (2009) Marigo P., Aringer B., 2009, A&A, submitted
- Reimers (1975) Reimers D., 1975, Circumstellar envelopes and mass loss of red giant stars. Problems in stellar atmospheres and envelopes., pp 229–256
- Renzini (2008) Renzini A., 2008, MNRAS, 391, 354
- Sakharuk et al. (2006) Sakharuk A., et al., “Capture Gamma-Ray Spectroscopy and Related Topics Vol. 819 of American Institute of Physics Conf. Series”, 118
- Smith et al. (1987) Smith V. V., Lambert D. L., McWilliam A., 1987, ApJ, 320, 862
- Stancliffe & Glebbeek (2008) Stancliffe R. J., Glebbeek E., 2008, MNRAS, 389, 1828
- Stancliffe & Jeffery (2007) Stancliffe R. J., Jeffery C. S., 2007, MNRAS, 375, 1280
- Straniero et al. (1997) Straniero O., Chieffi A., Limongi M., Busso M., Gallino R., Arlandini C., 1997, ApJ, 478, 332
- Straniero et al. (1995) Straniero O., Gallino R., Busso M., Chiefei A., Raiteri C. M., Limongi M., Salaris M., 1995, ApJ, 440, L85
- Ugalde et al. (2008) Ugalde C., et al. 2008, Phys. Rev. C, 77, 035801
- Vassiliadis & Wood (1993) Vassiliadis E., Wood P. R., 1993, ApJ, 413, 641
- Ventura & D’Antona (2005) Ventura P., D’Antona F., 2005, A&A, 439, 1075
- Ventura & D’Antona (2009) Ventura P., D’Antona F., 2009, A&A, 499, 835
- Woodward et al. (2008) Woodward P., Herwig F., Porter D., Fuchs T., Nowatzki A., Pignatari M., 2008, in O’Shea B. W., Heger A., eds, “First Stars III”, Vol. 990 of American Institute of Physics Conference Series, 300
Appendix A Examples of the on-line tables
In Table 6 we show the first few lines of the on-line table containing structural information from the new AGB models. In Tables 7, 8, 9, 10 we show the first few lines of the on-line stellar yield tables for the , , , and models, respectively. An example of the on-line stellar yield for the models with partial mixing zones is shown in Table 11.
| #Minitial = 4.50 msun, Z = 0.0200 | |||||||
|---|---|---|---|---|---|---|---|
| #pulse | |||||||
| 1 | 8.395468E-01 | 2.890170E-03 | 4.988529E+01 | 0.000000E+00 | 0.000000E+00 | 0.000000E+00 | 2.125615E+08 |
| 2 | 8.407463E-01 | 4.578114E-03 | 3.937420E+01 | 0.000000E+00 | 0.000000E+00 | 0.000000E+00 | 2.376553E+08 |
| 3 | 8.421246E-01 | 4.609287E-03 | 3.606038E+01 | 1.928210E-04 | 1.426807E-01 | 4.183316E-02 | 2.482608E+08 |
| # Minitial = 1.00 msun, Z = 0.0200, Mfinal = 0.564 msun | |||||||
|---|---|---|---|---|---|---|---|
| Isotope | yield | mass | mass | ||||
| 1 | 8.1815390E-09 | 3.2919932E-08 | 2.4738393E-08 | 7.5504431E-08 | 5.6745975E-08 | 1.2403737E-01 | |
| n | 1 | -3.9796876E-43 | -3.9796876E-43 | 0.0000000E+00 | -9.1224530E-43 | 0.0000000E+00 | 0.0000000E+00 |
| p | 1 | -8.1048310E-03 | 2.9179156E-01 | 2.9989639E-01 | 6.6924673E-01 | 6.8791503E-01 | -1.1948545E-02 |
a represents the sum of abundances from i to Bi; an increase in indicates that neutron-captures have occurred beyond the end of the network.
| # Minitial = 1.00 msun, Z = 0.0080, Mfinal = 0.577 msun | |||||||
|---|---|---|---|---|---|---|---|
| Isotope | yield | mass | mass | ||||
| g | 1 | 3.3505394E-09 | 1.2944828E-08 | 9.5942889E-09 | 3.0602433E-08 | 2.2684230E-08 | 1.3003190E-01 |
| n | 1 | 0.0000000E+00 | 0.0000000E+00 | 0.0000000E+00 | 0.0000000E+00 | 0.0000000E+00 | 0.0000000E+00 |
| p | 1 | -8.7296963E-03 | 3.0307159E-01 | 3.1180128E-01 | 7.1648133E-01 | 7.3720652E-01 | -1.2384283E-02 |
| # Minitial = 1.00 msun, Z = 0.0040, Mfinal = 0.610 msun | |||||||
|---|---|---|---|---|---|---|---|
| Isotope | yield | mass | mass | ||||
| g | 1 | 1.6834560E-09 | 6.1053904E-09 | 4.4219344E-09 | 1.5654848E-08 | 1.1339757E-08 | 1.4004514E-01 |
| n | 1 | 0.0000000E+00 | 0.0000000E+00 | 0.0000000E+00 | 0.0000000E+00 | 0.0000000E+00 | 0.0000000E+00 |
| p | 1 | -8.1304908E-03 | 2.8376853E-01 | 2.9189903E-01 | 7.2761166E-01 | 7.4855560E-01 | -1.2324413E-02 |
| # Minitial = 1.00 msun, Z = 0.0001, Mfinal = 0.720 msun | |||||||
|---|---|---|---|---|---|---|---|
| Isotope | yield | mass | mass | ||||
| g | 1 | 5.8190168E-09 | 5.8983649E-09 | 7.9347945E-11 | 2.1065592E-08 | 2.8343647E-10 | 1.8711179E+00 |
| n | 1 | -3.2538150E-42 | -3.2538150E-42 | 0.0000000E+00 | -1.1620968E-41 | 0.0000000E+00 | 0.0000000E+00 |
| p | 1 | -5.6426227E-03 | 2.0989175E-01 | 2.1553437E-01 | 7.4961346E-01 | 7.6990402E-01 | -1.1599216E-02 |
| # Minitial = 3.00 msun, Z = 0.0200, Mfinal = 0.682 msun, partial mixing zone = 2e-3 msun | |||||||
|---|---|---|---|---|---|---|---|
| Isotope | yield | mass | mass | ||||
| g | 1 | 3.4544257E-06 | 3.5859543E-06 | 1.3152861E-07 | 1.5470035E-06 | 5.6745975E-08 | 1.4355562E+00 |
| n | 1 | 0.0000000E+00 | 0.0000000E+00 | 0.0000000E+00 | 0.0000000E+00 | 0.0000000E+00 | 0.0000000E+00 |
| p | 1 | -6.9546103E-02 | 1.5249372E+00 | 1.5944833E+00 | 6.5786761E-01 | 6.8791503E-01 | -1.9396281E-02 |