Optical spectroscopy of 20 Be/X-ray Binaries in the Small Magellanic Cloud
Abstract
We present a large sample (20 in total) of optical spectra of Small Magellanic Cloud (SMC) High-Mass X-ray Binaries obtained with the 2dF spectrograph at the Anglo-Australian Telescope. All of these sources are found to be Be/X-ray binaries (Be-XRBs), while for 5 sources we present original classifications. Several statistical tests on this expanded sample support previous findings for similar spectral-type distributions of Be-XRBs and Be field stars in the SMC, and of Be-XRBs in the Large Magellanic Cloud and the Milky Way, although this could be the result of small samples. On the other hand, we find that Be-XRBs follow a different distribution than Be stars in the Galaxy, also in agreement with previous studies. In addition, we find similar Be spectral type distributions between the Magellanic Clouds samples. These results reinforce the relation between the orbital period and the equivalent width of the H line that holds for Be-XRBs. SMC Be stars have larger H equivalent widths when compared to Be-XRBs, supporting the notion of circumstellar disk truncation by the compact object.
1 Introduction
We present a detailed optical spectroscopic study of 20 High-Mass X-ray Binaries (HMXBs) in the Small Magellanic Cloud (SMC) using the 2dF (Two-degree Field) multi-object spectrograph on the 3.9m Anglo-Australian Telescope (AAT). In this study we have used the 2dF spectrograph to confirm the classification of candidate Be/X-ray binaries (Be-XRBs; the most numerous subclass of SMC HMXBs) as emission-line stars and identify their spectral type. Although this is only a pilot study, it is at the same time a spectroscopic survey of a relatively large number of Be-XRBs and candidates over a large wavelength range. This provides a deep census of the X-ray binary (XRB) population in this galaxy even in low activity levels, which is critical for understanding the characteristics of the overall population.
The SMC is one of the best targets to study a, as complete as possible, population of young XRBs. Similar studies in the Galaxy are hampered by extinction and distance uncertainties. The Large Magellanic Cloud (LMC) is much more extended than the SMC, requiring large area coverage to obtain sufficient numbers of XRBs, while other Local Group galaxies are too far to reach the quiescent population of HMXBs (typical erg s-1; van Paradijs & McClintock 1995).
In addition, the SMC hosts a large number of HMXBs (e.g. Haberl & Pietsch 2004, McBride et al. 2008, Antoniou et al. 2009) when compared to the Milky Way and the LMC. This excess is explained by the combination of a star-formation burst at Myr at regions where the HMXBs are located (Antoniou et al. 2009; consistent with the age of maximum formation of Be stars, given by McSwain & Gies 2005), and by the low SMC metallicity (Antoniou et al. 2009, McBride et al. 2008). Simulations show that neither the metallicity nor the star-formation burst alone can produce such a high number of HMXBs in the SMC (Dray 2006). Thus, the SMC is an excellent laboratory to study the Be-XRB populations.
The most representative studies of spectroscopically identified Be-XRBs are those of McBride et al. (2008), who investigated the spectral distribution of 37 in total SMC Be-XRB pulsars, and of Negueruela & Coe (2002), who presented high-resolution blue-band spectroscopy for 13 LMC Be-XRBs. However, the main limitation of detailed studies of the HMXB population in the SMC is the lack of spectral classification of the optical counterparts of a large fraction of the detected sources, while the vast majority of the studies available in the literature either do not present the spectra and/or the criteria used for the spectral classification. This severely hampers the construction of a large coherent sample of Be-XRBs. Motivated by the limitations of the current studies, and in order to classify the different type of XRBs and separate them from the various interlopers (background/foreground sources), we initiated an optical spectroscopic campaign of a large number of candidate SMC Be-XRBs, detected either in our observations or other published X-ray surveys of the SMC. The goal of this campaign is to confirm the Be classification of each system (often based on photometric data), identify its spectral type, and even identify any possible interlopers.
The structure of this paper is the following. In Section 2, we describe the sample of sources we observed with the 2dF spectrograph; and in Section 3, the observations and data reduction, along with the optical and near-infrared properties of the sources. In Section 4, we discuss the criteria used for the classification of the optical spectra, and the comparison of the classification of sources from the present work with those of previous studies. In Section 5, we discuss these results in the context of the Be stars and Be-XRB populations in the Galaxy and the LMC, and we investigate correlations between the H emission and the orbital period and infrared colors of the systems. Finally, we present the main results of this study in Section 6.
2 Sample
Our sample is primarily selected from the shallow Chandra survey of the SMC (A. Zezas et al. 2009, in preparation; Antoniou et al. 2009), and it also includes candidate and known Be-XRBs from the census of Haberl & Pietsch (2004; based mainly on observations with XMM-Newton). The overall strategy of this pilot study was to observe the optical counterparts of confirmed and candidate Be-XRBs. In total, we have observed 113 and 27 Chandra and XMM-Newton sources, respectively. We note that even though the 2dF spectrograph allows the allocation of 400 fibers, the stellar density of the selected fields, which lie along the SMC “Bar”, did not allow us to observe more objects at a given time due to collision of the fibers. Twenty-nine out of the 113 Chandra sources do not have an optical match in the OGLE-II and/or MCPS catalogs (based on the analysis of Antoniou et al. 2009), we thus obtained blind spectra, i.e. we placed the fiber at the location of an X-ray source, in order to obtain a spectrum of any object at that position. For the remaining Chandra sources, the typical V-band magnitude of the optical counterparts was mag. In addition to the Chandra sources we also observed 9 confirmed and 18 candidate Be-XRBs from the compilation of Haberl & Pietsch (2004).
3 Observations and data reduction
The optical spectra for this work were obtained during service time in 2004 November, with the 2dF multiple-fiber spectrograph at the prime focus of the 3.9-m Anglo-Australian Telescope (Lewis et al. 2002). The observations were taken at airmass between 1.35 and 1.48, and the seeing was . We used the grating (300B), which gave a 4400Å wavelength coverage (from 3640Å to 8040Å region) at an instrumental dispersion of 4.3Å/pixel. Four 2250s exposures were obtained, providing a total exposure time of 9000s. The on-target exposures were preceded and followed by arc calibration exposures (CuAr and CuHe) and fiber-flat-field exposures. Approximately 30 “sky” fibers located on star-free regions (15 for each spectrograph) were assigned, to ensure good definition of the sky background. Successful use of the 2dF spectrograph depends on the source positions being accurate to better than 0.5 arcsec, in order to avoid significant light loss from the 2-arcsec-diameter fibers. Positions were used from OGLE-II (which has a small astrometric error of ; Udalski et al. 1998) whenever possible to fulfill this requirement. In order to achieve accurate pointing and guide the telescope successfully during the observations we chose 4 sources as fiducial stars evenly spaced through the 2dF field. These stars were chosen from the 2MASS catalog, however they have consistent coordinates in the OGLE-II catalog and they abide by the suggestions listed in the 2dF manual (e.g. brighter than 15.0 magnitude stars which should not cover more than a one magnitude range). Nevertheless, some loss in counts is expected to be caused by the small number of fiducial stars used to guide the field plate and due to the small positional mismatches between fiber and object positions.
The data preparation and spectral extraction were performed using the 2dfdr software (Lewis et al. 2002). The main steps include bias subtraction, extraction of the spectra from the CCD image, division by a normalized flat-field, wavelength calibration, calibration of the fiber throughputs, and subtraction of the scaled median sky spectrum (derived from the sky-fiber spectra). Extraction of the spectra, spectral line fitting and EW line measurements were performed with the DIPSO v3.6-3 and FIGARO v4.11 packages of STARLINK. In particular, we measured the center of each H line and its Full-Width at Half-Maximum (FWHM) using a Gaussian fit (elf subroutine), while for the EW we used the ew subroutine of the DIPSO package. Due to the different throughput of each fiber (which is also wavelength-dependent), it is difficult to flux calibrate spectra from a multi-fiber instrument such as 2dF, as a flux standard should be -in principle- observed through each fiber. An average response curve can be applied to give an approximate relative flux calibration, however, the results for individual spectra can vary considerably (Lewis et al. 2002). Therefore, flux calibration was not attempted. This does not affect our analysis, as our classification criteria are based on the presence or absence of spectral lines rather than their absolute intensity. Whenever comparisons between strengths of lines are used, care is taken to use lines close in wavelength, in which case the fiber response is identical, for all practical purposes.
Fibers that were assigned to objects fainter than mag in V-band, yielded low signal-to-noise (S/N) ratio spectra. We defined a nominal ratio of each spectrum using the counts in the 5600Å-6200Å range (measured using the istat package of FIGARO v4.11) which can be considered as representative of the local continuum. Spectra with 400 average counts in this wavelength range were excluded from the present study, as it was difficult to perform accurate spectral classification for them. This leaves 58 spectra for further consideration. All but one of these 58 sources exhibit H emission.
The presence of H emission is one of the main classification criteria for Be-XRBs. We thus focus on the study of H emission-line objects. However, the inner regions of the SMC show strong and variable diffuse emission from HII regions and supernova remnants (SNRs). Due to hardware limitations it is not possible to obtain sky spectra within a few arcseconds from each source111The absolute minimum is 30 arcsec (2mm), but typically it is 30-40 arcsec depending on the location in the field and the target distribution (http://www.aao.gov.au/AAO/2df/aaomega/aaomega_faq.html#fibsep), which in turn does not allow us to accurately subtract the variable local background. Therefore, some of our object spectra may be contaminated by the typical interstellar emission lines: , , and . For this reason we adopt a conservative approach and we focus only on objects with minimal interstellar contamination. The selection of such objects is based on the width of the H line and their / ratio.
Be stars exhibit broad H emission (e.g. Coe et al. 2005), whereas the interstellar emission lines are typically narrow. Therefore, selection of objects with broad H emission allows us to identify objects with small interstellar contamination. We choose a low limit for the FWHM of the H line Å, based on the average FWHM of this line from high S/N spectra of known Be-XRBs and Be-XRB pulsars, which are observed as part of the present work. In total, we find 22 sources with H FWHM greater than 9.5Å. Two of these sources have broad but extremely weak H emission when compared to the other sources, thus they are not considered for further investigation. Based on the above criteria our sample is limited to 20 sources. We note that there could be additional bona-fide Be-XRBs in the remaining sample, however the absence of a broad H component makes their classification uncertain.
The selection of these sources as bona-fide Be-XRBs is confirmed by their high / ratio. Be stars typically do not show forbidden high excitation emission lines (with the only exception of the subclass of B[e] stars; e.g. Lamers et al. 1998). Therefore, the presence of 6716Å emission is a signature of significant contamination from the diffuse interstellar emission. We determine the average H to strength ratio of the diffuse emission from the spectra of the sky fibers which uniformly probe the observed area. This gives an average local “sky” value of to H ratio of . All objects which fulfill the H width criterion also have to H ratio at least below the average sky ratio. This gives us further confidence that the emission-line objects we selected for further study are indeed Be stars. In addition, although we cannot rule out the possibility that some of the remaining observed sources could be Be-XRBs, none of the discarded sources with good S/N has low enough to H ratio to fulfill the above criterion. This indicates that we do not miss a significant population of Be-XRBs among the remaining sources. However, because of these criteria, our sample is biased towards objects with stronger H emission.
Based on the above analysis, we found 20 objects with good quality optical spectra obtained in this run, and known X-ray properties typical of HMXBs (e.g. hard X-ray spectrum and/or detection of pulsations). Out of the 20 objects, the spectra of which are presented here, only 2 have good quality published optical spectra in the full wavelength range (), while one source has been observed only in the red portion of the optical spectrum around H (). These 20 sources are presented in Table Optical spectroscopy of 20 Be/X-ray Binaries in the Small Magellanic Cloud. In Column 1 we list the X-ray source ID as given in Antoniou et al. (2009; (Field ID)-(Src ID within the field)) for Chandra sources, while the XMM ID refers to sources from Haberl & Pietsch (2004). Other names for the XMM-Newton sources and their references (Column 2) are taken from the latter work. In Column 3 we present the X-ray pulsar ID (defined as the pulse period in seconds222Based on the online census of Malcolm Coe as of 22 August 2008 (http://www.astro.soton.ac.uk/mjc/).). Finally, in Column 4 we list the associated emission-line object from the catalog of Meyssonnier & Azzopardi (1993; hereafter [MA93]). With the present observations we will investigate the Be-XRB nature of these 20 objects and we will study their spectral characteristics, in conjunction with their optical and near-infrared properties.
The optical and near-infrared counterparts of the studied X-ray sources are present in Table 2. In particular, the optical counterparts of the Chandra sources are taken from Antoniou et al. (2009). Following the same approach for the XMM-Newton sources, we cross-correlated their positions with the OGLE-II (Udalski et al. 1998) and MCPS catalogs (Zaritsky et al. 2002) using a search radius of 5″ around each X-ray source (Brusa et al. 2007). In Column 1 we give the X-ray source ID (as in Table Optical spectroscopy of 20 Be/X-ray Binaries in the Small Magellanic Cloud), and in Columns 2 and 3 the X-ray source coordinates (Right Ascension and Declination, respectively). In Column 4 we present the optical counterpart of the X-ray source from the OGLE-II and/or MCPS catalogs. OGLE-II sources are named as O-F-NNNNNN, where F and NNNNNN are the field and optical source number, respectively (from Udalski et al. 1998), and MCPS sources are named as Z-NNNNNN where NNNNNN is the line number of the source in Table 1 of Zaritsky et al. (2002). The angular separation (in arcseconds) of the counterpart to the X-ray source is given in Column 5. The optical (V,B-V) data of the sources are presented in Columns [6] and [7] along with their errors (these data are taken directly from the original catalogs without applying any reddening or zero-point correction): apparent magnitude in the V band (Column 6), and B - V color (Column 7). For one source (XMM-47) we found an optical counterpart in slightly larger distance from the X-ray source position (within 5.3″ and 4.9″ in the OGLE-II and MCPS catalogs, respectively). The near-infrared counterparts of the Be-XRBs studied here are taken from the 2MASS catalog (Skrutskie et al. 2006). Column 8 lists the closest 2MASS counterpart ID within 2″ from the X-ray source position, and Columns 9 and 10 the J, and K magnitudes along with their errors. Four sources (4-3, XMM-15, XMM-47 and XMM-5) do not have a 2MASS counterpart within 2″ from the X-ray source position.
The full (3650Å-8000Å) wavelength calibrated spectra of the 20 SMC Be-XRBs are given in Figure 1. The early-type nature of the stars is apparent in all spectra, as is their strong H emission. The contribution of telluric emission lines is sometimes not well subtracted (due to the difficulties in sky subtraction in multifiber observations discussed earlier) leaving emission and/or absorption features around the [OI] Å lines. Moreover, telluric absorption bands of molecular oxygen are obvious in the red part of our spectra, around 6875Å, and 7610Å. Finally, some diffuse interstellar emission lines can also be seen in some of the spectra, including [OIII] Å, [OII] Å, [NII] Å and [SII] Å.
In Table Optical spectroscopy of 20 Be/X-ray Binaries in the Small Magellanic Cloud we present for each selected X-ray source (Column [1]) the measurements of the center (Column [2]), FWHM (Column [4]), and EW (Column [6]) of the H emission line, along with their errors (Columns [3], [5], and [7], respectively) from the interactive fits. The errors represent the 68% confidence intervals for one interesting parameter. We found published H EW measurements for 8 of our sources. We present these values in Column [8] along with their source (given in parenthesis). They are in good agreement, despite the expected scatter, given the variable nature of Be stars (e.g. McSwain et al. 2008), and the different disk inclination in which they may have been observed (Dachs et al. 1986). The H emission-line profiles in the spectra of Table Optical spectroscopy of 20 Be/X-ray Binaries in the Small Magellanic Cloud are very simple with no signs of double or split peaks. However, because of the resolution of the used grating, we may not have been able to resolve any asymmetries or double peaks. In addition, in Column [9] we give the orbital period of the HMXBs in this sample from the literature (Liu et al. 2005 and references therein), and we use these values in order to study the properties of the decretion disk in relation to the parameters of the binary system (see discussion in Section 5.2 below).
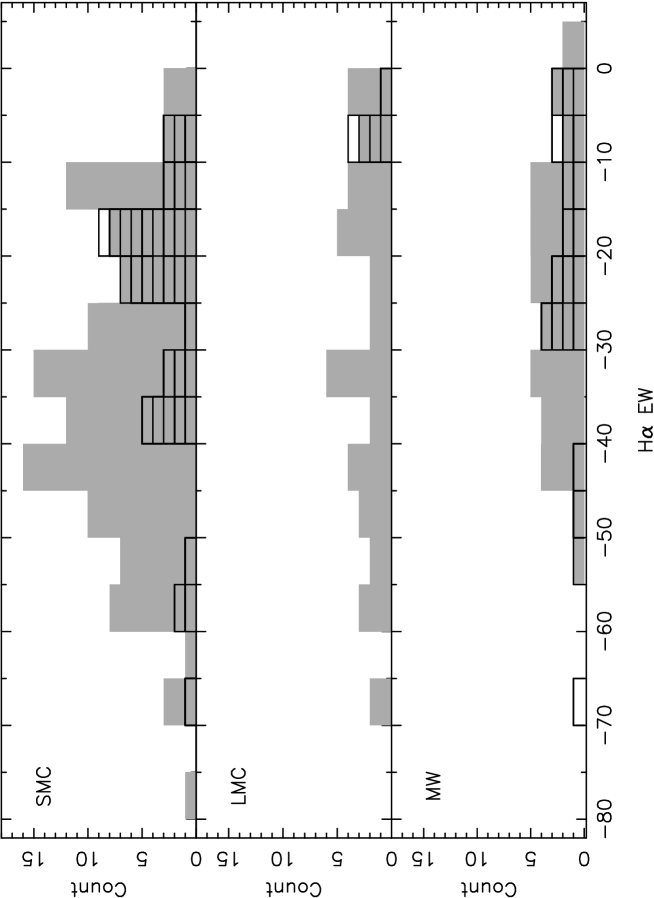
In Figure 2 we show the distribution of the H EWs for Be-XRBs (solid histograms) and Be stars (open histograms). We note here that by using the term Be stars throughout this paper we refer to field and cluster Be stars that do not exhibit X-ray emission characteristic of XRBs. These distributions are shown for the SMC (top panel), the LMC (middle panel) and the Milky Way (bottom panel). The data for the SMC Be-XRBs are taken from the present study and are supplemented by the catalog of Coe et al. (2005), while for the SMC Be stars we used data from the study of the star-cluster NGC330 by Martayan et al. (2007a). The data for the LMC Be-XRBs are taken from Liu et al. (2005; and references therein), while the LMC Be sample is from the study of the star-cluster NGC2004 by Martayan et al. (2006a). The data for the Galactic Be-XRBs are taken from Reig (2007) and Liu et al. (2006; and references therein), while for the Galactic Be stars we used data from Ashok et al. (1984), supplemented with data from Fabregat & Reglero (1990), Dachs et al. (1986), and Dachs, Hummel & Hanuschik (1992). We note that the above Galactic Be samples contain field stars. In order for the above comparisons to be valid, we selected Be-XRBs and Be stars within the same spectral-type range in each of the 3 galaxies. Be-XRBs in the Milky Way and the LMC have spectral types up to B2, while the majority of such systems in the SMC is found to have spectral types B3 or earlier (see discussion in Section 5.1 and Figure 6 below). The spectral types of Galactic sources with H EW measurements used here are taken from Andrillat & Fehrenbach (1982) and Skiff (2007; and references therein), while for the SMC and LMC Be stars we used data from Martayan et al. (2007b) and (2006b), respectively.
In total we have used 41 Galactic Be stars, 21 Galactic Be-XRBs, 116 SMC Be stars, 35 SMC Be-XRBs, 5 LMC Be-XRBs and 42 LMC Be stars. From Figure 2 we see that the H EW distribution of SMC Be-XRBs peaks at , while that of SMC Be field stars peaks at . This is in agreement with Reig et al. (1997) and Zamanov et al. (2001) who reported that Be stars in XRBs have on average a lower H EW when compared to Be stars, due to the truncation of the disk by the compact object. For the LMC and the Milky Way, the comparison is hampered by the small size of the samples. On the other hand, Dachs et al. (1992) found that Be stars with larger H EW have larger radii of their H emitting circumstellar disks. Grundstrom & Gies (2006) used numerical models to show that the predicted radius of the Be disk, based on H EW, is monotonically related to the observed disk radius with long baseline interferometry. From the above figure, we also see that the Be stars in the Magellanic Clouds (hereafter MCs) have larger H EW values when compared to the Galactic sample, thus indicating larger disks around them. Martayan et al. (2007a), who find similar results, suggest that the higher H EWs (especially in the SMC) indicate the presence of more extended circumstellar envelopes around a fraction of Be stars. We also note that some Be stars may be in fact in binary systems. However, even if some of those prove to be binaries, we do not expect their H EW distributions to change significantly.
3.1 Optical and near-infrared photometry of the Be-XRB 2dF sample
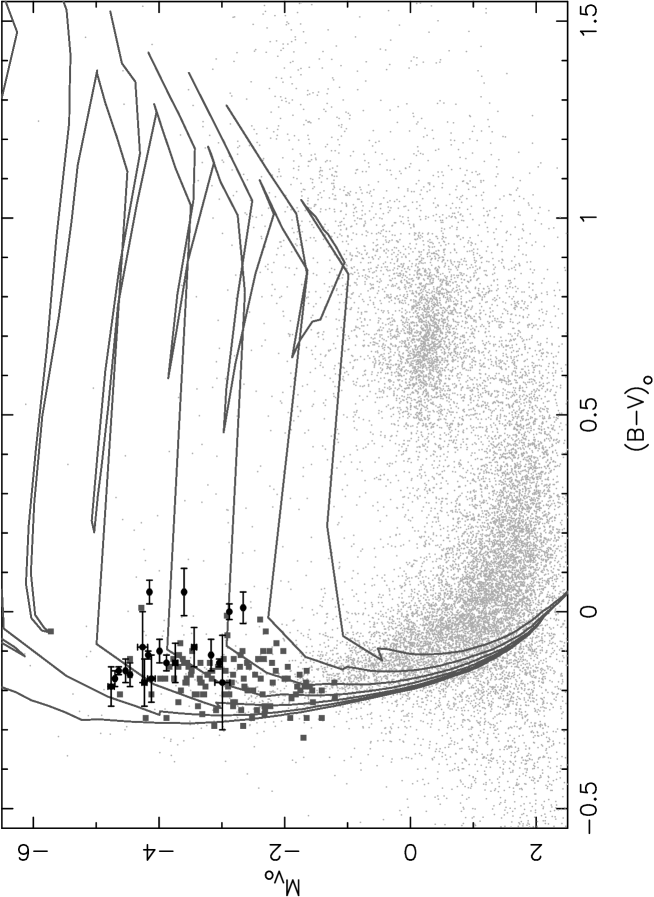
The identification and classification of the optical counterparts of the X-ray sources allow us to identify the interlopers and determine the type of XRBs (e.g. Be-XRBs, Supergiant XRBs, Low-Mass XRBs). In Figure 3 we present the extinction corrected absolute V magnitude vs. B-V color ( versus ) color-magnitude diagram (CMD) of the counterparts of the X-ray sources with 2dF spectra (black circles). The magnitudes, colors and their errors are taken from the OGLE-II catalog (Udalski et al. 1998), except for sources with matches only in the MCPS catalog (Zaritsky et al. 2002), based on data from Table 2333We correct the original data presented in this table for the extinction to the SMC using E(B-V)=0.09 and Av=0.29 (for a more detailed justification of this choice see Antoniou et al. 2009).. With gray squares we also show the NGC330 Be stars (Martayan et al. 2007a), while with gray small dots we present the OGLE-II stars that lie in our Chandra field 4 and have small errors in the V and B band ( mag). The main sequence, the red giant branch and the red clump loci are clearly seen. In this figure, we overplot the isochrones from the Geneva database (Lejeune & Schaerer 2001) for the metallicity of the young SMC stars ( dex, equivalent to 444For the conversion, we use the relation Z⊙, with Z⊙= for the solar metallicity of (Russell & Dopita 1992).; Luck et al. 1998), for ages of 8.7 Myr to 275.4 Myr. The position of all the X-ray sources in the CMD agrees well with the NGC330 Be stars. We also see that the Be-XRBs from our sample and the Be stars from Martayan et al. (2007a) are at the right of the main sequence, as expected given that Be stars are generally redder than B-type stars (e.g. McSwain & Gies 2005), while they all lie between the Myr and Myr isochrones.
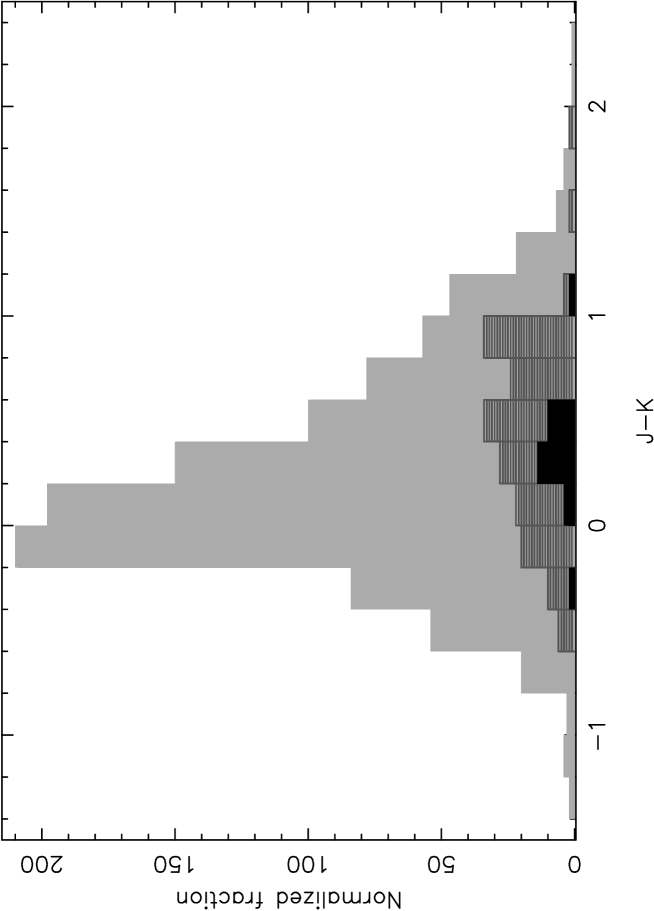
Most Be stars exhibit infrared excess (Gehrz, Hackwell & Jones 1974) due to the disk contribution to the continuum emission. Several authors have observed a similar excess in Be-XRBs (e.g. Coe et al. 2005). In Figure 4 we present the distribution of the J-K color for the Be-XRBs of the present work (black filled histogram). We also show the J-K color distribution of Be stars of luminosity class III-V (gray hatched histogram) and of all non-emission B-type stars (i.e. excluding the above Be stars sample; gray filled histogram) using data from the 2dF SMC spectroscopic survey of Evans et al. (2004). For clarity, the number of sources in the Be-XRB and Be stars sample is normalized by a factor of 2. We find that the J-K distribution of Be-XRBs peaks at 0.3 mag, while that of Be stars at 0.5-0.9 mag. Non-emission B-type stars show a skewed distribution, which peaks at -0.1 mag.
4 Determination of spectral types
The primary spectral classification criteria for OB stars are usually based on metal line strengths except for the earliest subtypes which are based on HeI and HeII lines (e.g. Lennon 1997). However, due to the low metallicity of the SMC sources, the metal lines are very weak (see also Evans et al. 2004) hampering the classification based on them. Therefore, we adopt the classification scheme of Evans et al. (2004), although, due to the lower resolution of our spectra, it was not always possible to use all the proposed indicators.
According to this scheme, the spectral classification is based on the blue part of the spectrum (3800Å-5000Å wavelength range). The presence of HeII absorption lines (HeII ) indicates spectral types earlier than or equal to B0. Strong HeI lines are also indicative of early spectral types. Their strength increases with decreasing temperature, while it peaks around B2. The main characteristic of early B-type stars is the absence of lines of ionized helium (HeII), which are still present in late O-type stars. Thus, in B0.5 stars, HeII and HeII are absent, while HeII is weak. In B1 stars, HeII disappears, while SiIV lines appear. For spectral types later than B1.5 the OII+CIII blend decreases rapidly, and disappears for stars later than B3. For spectral types B2 or later MgII and SiIII become stronger. Comparison between the strengths of these two lines is used to distinguish between B2, B2.5, and B3 types. For spectral types B5 or later the classification is based mainly on the absence of SiIII . In B8 stars HeI is stronger than SiII , which in turn is stronger than HeI . Finally, for B9 stars MgII appears stronger than HeI . In Table 4 we summarize the above line identifications (Column 1) for each B spectral type subclass (Column 2).
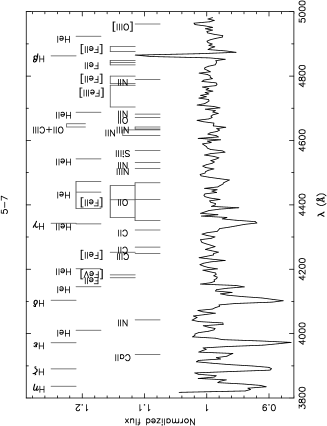
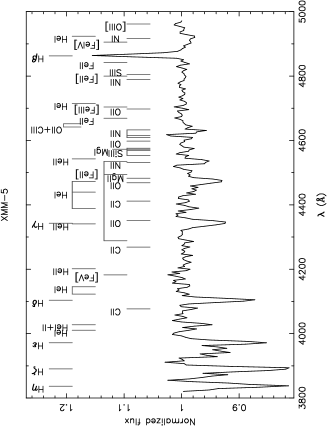
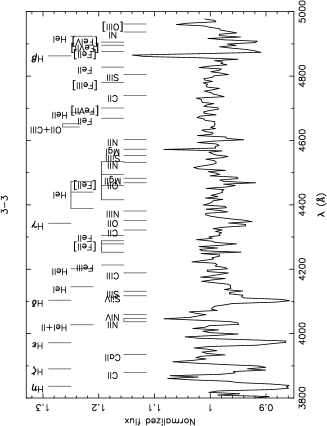
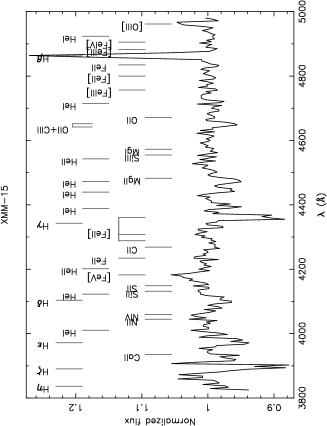
The resulting spectral types for the 20 objects of Table Optical spectroscopy of 20 Be/X-ray Binaries in the Small Magellanic Cloud are shown in Table Optical spectroscopy of 20 Be/X-ray Binaries in the Small Magellanic Cloud, while sample spectra in the 3800Å-5000Å wavelength range are shown in Figure 5, with characteristic spectral features marked. In Table Optical spectroscopy of 20 Be/X-ray Binaries in the Small Magellanic Cloud we give the X-ray source ID (Column 1), the spectral classification derived from this study (Column 2), and any previous classification of the same sources (Column 3) along with their reference (given in parenthesis). A “Be?” (i.e. tentative Be) input in Column 3 indicates sources for which the classification as a Be star is based on the positional coincidence of a hard X-ray source with an emission-line object from the catalog of [MA93] and/or with a photometrically classified early-type (OB) star (e.g. Antoniou et al. 2009). In total, 5 out of the 20 sources studied here have been previously identified as candidate Be stars based only on photometric data and/or positional coincidence with an emission-line object from the catalog of [MA93]. In addition, two sources with hard X-ray spectra have been previously spectroscopically classified as B-type stars (i.e. non-Be stars) in the study of Evans et al. (2004). Furthermore, one object was classified as B-type star showing Balmer emission, but no further classification has been provided (Garmany & Humphreys 1985). The present study examines these classifications, since only spectroscopy can unambiguously identify the nature of the donor with that of a Be star. Due to the absence of flux calibration and the relatively low resolution of our spectra it was not possible to assign with certainty a spectral luminosity class to our objects. For the same reason, Evans et al. (2004), who have used the same spectrograph, have relied on a photometric/spectroscopic approach to estimate the luminosity class.
Because later-type main-sequence stars are also fainter, and because the present spectroscopic sample is obviously flux limited, there is an obvious selection effect favoring earlier spectral types. The faintest of these 20 sources (which has counts in the 5600Å-6200Å wavelength range) has been classified here as a B0-4e star, thus our sample is complete up to mid-B.
4.1 Comparison with previous studies
We find good agreement between our and other published spectral-type
classifications for 9 out of the 15 sources with published classification. However, for 6 sources (XMM-3, XMM-5, 5-2, 5-7, XMM-39, and XMM-47) we derive different (or in some cases slightly different) spectral types. In addition, due to the low resolution of the spectra used in this work
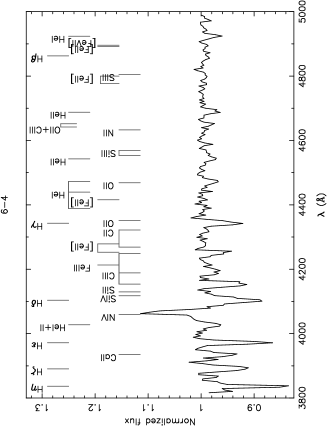
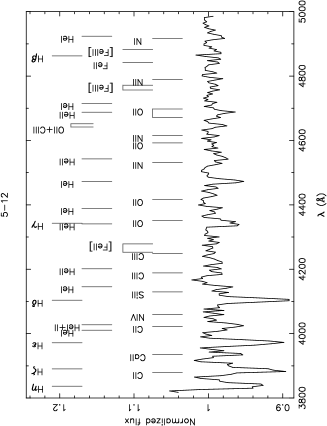
and the low S/N ratio of sources 6-1, 5-12, 6-4, and 3-3 we can only assign to them broad spectral types. The blue part of the spectrum (3800Å-5000Å) of the last three sources is presented in Figure 5. In summary, for all but four sources (5-2, 5-7, XMM-3, and XMM-47 for
which we find 0.5, 1, 0.5 and 1 spectral subtype differences,
respectively) we find spectral classifications in good agreement with
previous studies. We estimate that our spectral types are accurate to better than subclass in most cases, especially for earlier than B2 spectral types. Next we discuss in detail the spectral classification criteria for all sources in Table Optical spectroscopy of 20 Be/X-ray Binaries in the Small Magellanic Cloud:
-
•
We classify source XMM-3 as a B0.5e type star based on the presence of weak HeII , absent HeII , and very weak (almost absent) HeII . The spectrum of source XMM-3 exhibits strong Balmer lines in absorption (with the strongest one being H), and moderate H in emission. Weak HeI () lines and OII+CIII blend are also present. Source XMM-3 has been assigned a slightly later spectral type (B1-1.5Ve) by McBride et al. (2008).
-
•
Based only on photometric data, source 4-8 has been recently classified as a later than B3 emission-line star (Haberl et al. 2008). In the present work, we classify it as a B1.5e star, based on the presence of strong H , weak SiIII and OII+CIII blend, and the absence of SiIV and HeII . Similarly to source XMM-5, it shows strong HeI+II and HeI lines, while H shows weak emission.
-
•
Source XMM-5 has been classified as B0-5(II) by Evans et al. (2004). Based on the presence of strong H , weak SiIII and OII+CIII blend, and the absence of SiIV and HeII , we classify this source as B1.5e. Other present helium lines include HeI+II and HeI . The blue part of the spectrum (3800Å-5000Å) of source XMM-5 is shown in Figure 5.
-
•
Sources 4-2, 4-5, 5-4, and 6-2 are classified as B1e stars in this work. SiIV lines and OII+CIII blend are present, while HeII is absent. H is partially filled-in by emission in source 4-2, and completely filled-in in sources 5-4 and 6-2. Sources 4-5 and 5-4 are classified here for the first time, while they are listed as candidate Be-XRBs associated with objects [MA93]300 (Haberl & Pietsch 2004) and [MA93]798 (Antoniou et al. 2009), respectively. In addition, sources 6-2 and 4-2 have been previously classified as B1 III-Ve and B1-3 IV-Ve stars by McBride et al. (2008).
-
•
We classify sources 4-1 and 5-16 as B0.5e stars, based on the presence of the HeI and HeII lines and the absence of the HeII lines. The OII+CIII blend is weak, while in the case of source 5-16 H and H are partially filled-in by emission. Coe et al. (2002) have classified source 4-1 as a B0-0.5 Ve star, while source 5-16 has been classified as a O9.5-B1 IV-Ve star by McBride et al. (2008).
-
•
Our classification of source XMM-15 as a B0.5e star, based on very weak emission in HeII and HeI , absent HeII and SiIV , and strong HeI and OII+CIII absorption, is in agreement with previous studies (McBride et al. 2008). In Figure 5 we present the blue part (3800Å-5000Å) of its spectrum. This source shows H, H and H in absorption, partly filled-in by emission. H is completely filled-in by emission (absent from the spectrum), while the strong H emission line is the most prominent feature of the blue part of the spectrum.
-
•
Source 4-3 has not been previously classified. It is only listed as candidate Be-XRB associated with object [MA93]414 (Haberl & Pietsch 2004). In this work, we classify it as a B0.5e star, based on the absence of HeII lines, and on the presence of weak HeII .
-
•
Source XMM-17 is classified here as a B0e star, based on the presence of HeII lines, in agreement with McBride et al. (2008), who have classified it as a O9.5-B0 Ve star.
-
•
Source 6-1 is classified here as a B1-3e star. The HeII line is absent, while SiIV is present, indicating a spectral type of B1. However, MgII is stronger than SiIII , which is common in B3 type stars. Finally, the OII+CIII blend is present but weak, thus indicating a spectral type later than B1.5. Taking into account all the above, we can only assign a broad spectral type of B1-3e to source 6-1, which is identical to the classification of McBride et al. (2008). Furthermore, H is partially filled-in by emission.
-
•
We classify source 5-12 as O9e-B0e, which is the earliest spectral type found in this sample. We based this classification on the presence of HeI and HeII lines. HeI+II and HeI are also present. The Balmer series H, H, H are strongly in absorption. However, H is party filled-in by emission, while H shows weak emission. Moreover, this spectrum shows strong absorption of the OII+CIII blend, indicative of an early B-type star.
-
•
Source 6-4 has been broadly classified as a B-type star which shows Balmer emission (Garmany & Humphreys 1985). In the present work, we study this object more extensively. The composite nature of this spectrum is revealed based on the HeI and HeII lines, that indicate early-type (OB) components. H is almost completely filled-in by emission, while H, H, H, H and H are in absorption. The strong NIV emission is the most prominent feature in the blue portion of its optical spectrum (3800Å-5000Å; Figure 5). The NV lines are not present, while HeII line is not in broad, low-intensity emission, as it is typical for O3 If* stars (Walborn & Fitzpatrick 1990). We do not detect the weak NIII triplet emission, which in combination with strong HeII absorption, has been used as a signature of O((f)) stars (e.g. Maíz-Apellániz et al. 2004), but this could be due to the spectral resolution (most probably blended with NII ). In contrast to the above indicators which suggest an O spectral-type, HeII is absent, indicating a B-type star. Other helium lines clearly seen in this spectrum, include HeI+II and HeI . Taking into account the above spectral features, we conclude that this is a composite spectrum and we assign an O2((f))+OBe type to this system. Based on the current spectral resolution, a classification is not straightforward and only higher resolution spectroscopy can unambiguously identify the two components and their correct spectral types.
-
•
We classify source 5-2 as a B0.5e star based on the presence of weak HeII , and the absence of HeII lines. Strong HeI+II and HeI absorption lines are in agreement with the above classification. HeI appears weaker, while HeI shows strong, broad emission. This source has been classified as a later type star (B1-2 IV-Ve) by McBride et al. (2008).
-
•
In the same work, source 5-7 is classified as an O9 Ve star (McBride et al. 2008). We find that this is a later (B0e) spectral-type star based on the presence of HeI and HeII lines in the blue part of its spectrum (3800Å-5000Å; Figure 5). In particular, HeII lines are present, but they are much more weaker than HeI . HeII is also weak. HeI lines are clearly seen in this spectrum, while the OII+CIII, blend is also present. The above lines are tell-tale signatures of a B0 star.
-
•
Source 3-3, which has been classified as B0-B2 by McBride et al. (2008), shows several conflicting spectral-type indicators. In our spectrum, the MgII line, which appears in later than B2 spectral types, is present. It is also stronger than SiIII , indicating a B3 spectral type. For spectral types B5 or later SiIII is absent, hence the latest spectral type that can be assigned to source 3-3 is B4. In addition, HeII and the OII+CIII blend are very weak (almost absent), and on that account source 3-3 would be of B0.5-1.5 spectral type. On the other hand, SiIV is present, which is typical of B1 stars, but not SiIV . Furthermore, HeII and HeII are present, indicating B0 and B0.5 spectral types, respectively. Based on the above spectral features, we only assign to source 3-3 a wide B0-4 spectral type. We also note that Balmer lines H and H are both filled-in by emission. The spectrum of this source also shows emission in NII and MgI .
-
•
Source XMM-39 exhibits the strongest H emission of the sources from the current sample. Moreover, H and H are partly and completely filled-in by emission, respectively. The optical counterpart of this source has been observed with 2dF by Evans et al. (2004), and it has been classified as a non-emission line B0-5(II) star. We classify it as a B1.5e star because we find weak SiIII absorption and moderate OII+CIII blend. This spectrum also shows unidentified emission around 3951Å.
-
•
Source XMM-47 has been classified as B0.5(IV)e by Evans et al. (2004), however, following the above criteria, we classify it as B1.5e. In particular, absence of the SiIV line and OII+CIII blend suggests a B1.5 or later spectral type source. On the other hand, no presence of the MgII line is indicative of an earlier than B2 star, while a very weak HeII line indicates a B0.5 (or slightly earlier) spectral type (although the presence of this line is ambiguous. We thus classify source XMM-47 as a B1.5e star.
5 Discussion
In the previous sections we presented the spectral classification of optical counterparts of 20 SMC HMXBs observed with the 2dF spectrograph. We identify all of these sources as Be-XRBs. We also compared these results with previous studies and we found that our classification is in good agreement in all but four cases. Next we discuss the implications of these results in the context of the spectral-type distribution of Be-XRBs comparisons in the MCs and the Galaxy. In addition, we investigate the distribution of the H EW measurements for Be-XRBs and Be field stars in these 3 galaxies and their H -orbital period () relation. We also investigate the intrinsic reddening values of the systems presented in this work.
5.1 Distribution of spectral types
SMC and Galactic Be-XRBs are found to follow the same spectral-type distribution (McBride et al. 2008). The same holds for LMC and Galactic Be-XRBs (Negueruela & Coe 2002). Extending the above comparisons to Be stars, Coe et al. (2005) observed somewhat similar distributions for Be-XRBs and Be stars in the SMC, however using photometrically derived spectral types. In the present work we supplement the SMC Be-XRB sample used in McBride et al. (2008) with spectral-type classifications for 10 additional sources, and we investigate differences in the spectral-type distributions of both Be-XRBs and Be stars in the MCs and the Milky Way. For sources common in the two studies, we have used the classification derived from the present work.
In Figure 6 we present the B spectral subtype distributions of Be-XRBs (solid histograms) and of Be stars (dashed histograms) in the SMC (top panel), the LMC (middle panel), and the Milky Way (bottom panel). Negative spectral subtypes correspond to O-type stars. Whenever only a broad spectral class was available, we equally divided the contribution in the different subtypes.
For the SMC, the data for Be stars are taken from Evans et al. (2004; 168 in total), and for Be-XRBs from our sample supplemented by the recent study of McBride et al. (2008; 46 in total). The Galactic Be stars (148 in total) are taken from the study of Slettebak (1982). For the Galactic Be-XRBs we used 20 sources from the census of Reig (2007), 4 additional from the work of McBride et al. (2008), and 2 more from the catalog of Liu et al. (2006). For the 14 LMC Be-XRBs we used the spectral types from the census of Liu et al. (2005). The LMC Be stars (103 in total) are taken from Martayan et al. (2006b).
In order to check the null hypothesis that different samples of Be-XRBs and Be stars are drawn from the same populations, we perform the two-sample Kolmogorov-Smirnov (KS) test (e.g., Conover 1971). The results of the p-values are presented in Table 6, a two-way table with the compared distributions for Be-XRBs and Be stars listed in its rows and columns. Because of the small size of the LMC Be-XRBs sample we also check these results with the two-sided Mann-Whitney-Wilcoxon test (Bauer 1972). In addition, because it is very difficult to obtain accurate spectral types for stars later than mid B-type in the MCs, we repeat the above analysis by using the Peto & Prentice Generalized Wilcoxon Test (Lavalley, Isobe & Feigelson 1992) and assuming lower limits to the spectral subtypes later than B3 in all samples and later than B1 and B2 in the LMC and Galactic Be-XRB samples, respectively. The three tests agree only in the case of very small (0.1) or very large (0.9) p-values, while intermediate values are not informative. In particular, small p-values (0.1) are indicative of the different populations from where these distributions are drawn. Based on these results, we cannot definitely say if the SMC Be-XRBs follow a different spectral-type distribution from Galactic and LMC Be-XRBs. This is consistent with McBride et al. (2008), who note that there is indication for similar distributions in the SMC and the Milky Way. We find similar spectral-type distributions between LMC and Galactic Be-XRBs (p-value=1.0), in agreement with Negueruela & Coe (2002), although we note the small size of the samples. Regarding the distributions of Be-XRBs and Be stars, we find that in the SMC the two populations are consistent with each other, in contrast to the Milky Way populations (in agreement with Negueruela, 1998). Moreover, we find similar Be spectral type distributions between the MCs samples, while we do not find evidence for differences between the MCs and the Milky Way.
Previous studies find the highest fraction of Be stars at B2 spectral types (e.g. Martayan et al. 2007b). McBride et al. (2008) find a spectral distribution cutoff for the SMC Be-XRBs around B2 and they suggest this might be due to significant angular-momentum losses, even before the Be-XRB evolutionary phase (i.e. during the first stage of mass transfer). Ekström et al. (2008) believe that the Be-star phenomenon may be limited to a given spectral-type range because of the mass loss and the meridional currents. In particular, they argue that for spectral types earlier than the favored one, mass loss prevents the star from approaching the critical velocity limit (at which the Be-star phenomenon appears), while for the later spectral types, the meridional currents (which transfer angular momentum to the surface) are not efficient enough for accelerating the envelope. Regarding the effects of metallicity in the fraction of Be stars in a galaxy, it is now widely accepted that the lower the metallicity the higher this fraction, because of their higher rotational velocities (e.g. Maeder et al. 1999, Wisniewski & Bjorkman 2006, Martayan et al. 2006b, 2007a; after correcting for multi- and single-epoch observations for the Milky Way and the MCs, respectively). Moreover, the Be star phase can last longer in low metallicity environments such as the MCs when compared to the Galaxy (Martayan et al. 2007b).
As pointed out in Zorec & Briot (1997) the observed populations of Be stars suffer from many incompleteness effects, especially in faint magnitude limits. Since the quantification of these selection effects is still in its infancy and depends on the used samples, we opted to use the available uncorrected samples and simply treat the number of stars at late spectral types as lower limits. This approach has lower discriminating power but it does not rely on modeling assumption about the selection effects.
Furthermore, the above samples include both field and cluster Be star populations. In order to check if there are different spectral type distributions due to their different ages and rotational velocity characteristics, we examined 2 Magellanic Clouds samples which distinguish between them (Martayan et al. 2007b and 2006b for the SMC and the LMC, respectively). We do not find any difference in the spectral type distributions of Be field and cluster populations, which could be due to the small size of these samples (79 and 52 Be stars for the SMC, and 27 and 20 for the LMC, respectively). In any case, in the present work we do not distinguish between the different Be star populations, especially since all Be-XRBs used in our study are located in the field. Although there is a possibility that they were formed in clusters and then ejected due to supernova kicks, there is no way to test it.
From the above analysis it is obvious that in comparisons of the spectral-type distribution of different populations, one should keep in mind that the Be phenomenon is a transient phase in the life of some B-type stars, greatly depending on the rotational velocity and perhaps binarity (e.g. McSwain et al. 2008). Because of the transient nature of the Be-star disks, we may then get only a fraction of the real underlying Be-star population with single-epoch observations, as is the majority in the SMC.
5.2 Orbital Period
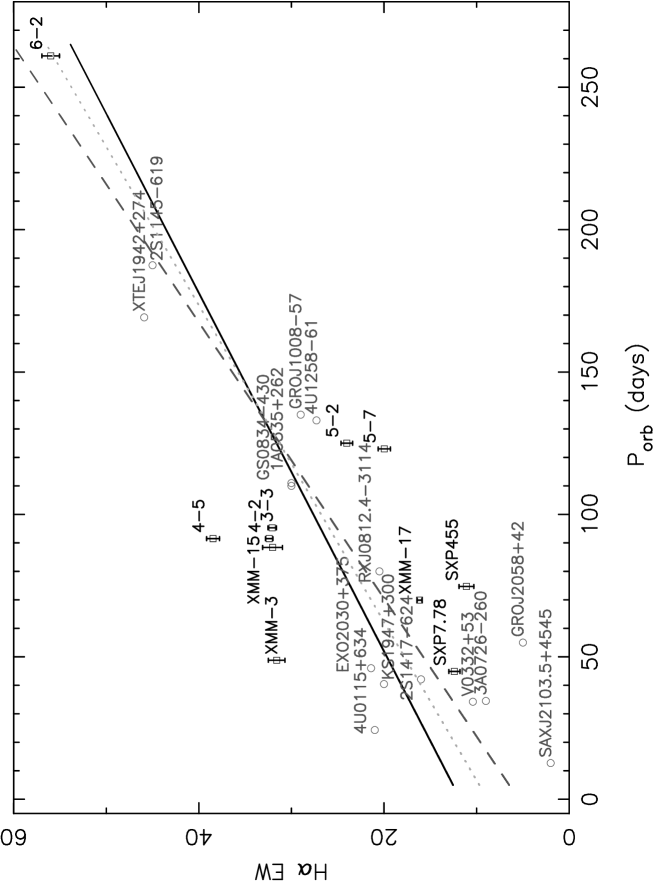
The orbital period of an XRB system is related to the size of its orbit, while the H EW is considered an indicator of the size of the decretion disk (e.g., Grundstrom & Gies 2006; as observed by long baseline interferometry of nearby Be stars). Reig et al. (1997) found a strong correlation between orbital period and H EW, and attributed it to the presence of the neutron star, which appears to act as a barrier which prevents the formation of a extended disk in systems with short orbital period. Figure 7 is an updated version of the -EW(H) diagram for Be-XRBs including in addition to the 15 Galactic Be-XRBs (open circles) used in the work of Reig (2007), 14 SMC sources (filled squares) derived from the present work (values are taken from Table Optical spectroscopy of 20 Be/X-ray Binaries in the Small Magellanic Cloud and references therein) and 2 recently detected X-ray pulsars (SXP7.78, SXP455555Based on the online census of Malcolm Coe as of 22 August 2008 (http://www.astro.soton.ac.uk/mjc/).). The orbital periods of these 2 sources are taken from Liu et al. (2005; and references therein), while for the H EW measurements we used the work of Coe et al. (2005). In Figure 7 we only included sources with well determined orbital periods, thus other SMC X-ray pulsars (such as SXP756, SXP8.80, SXP46.6 and SXP304) with published H EW and values are not present. Five X-ray sources (out of the 20 used in Section 5.1) do not have published orbital periods, thus they do not appear in this figure. Source 4-1 is not included in Figure 7 because of its complicated nature (Coe et al. 2002). We also note that the H EW measurements used here are the maximum found in the literature (thus these measurements can be considered upper limits of the disk size; e.g Dachs et al. 1992).
This plot strongly supports the correlation of these two quantities despite the large scatter observed for the shorter period systems and extends it to extragalactic systems. As Reig (2007) points out, the neutron star does not allow the companion star to develop a large decretion disk in cases of small orbital period systems, leading to the tidal truncation of the disk, and in turn smaller H EW values. The values of the linear regression correlation coefficient for the SMC, Milky Way and the combined sample are 0.71, 0.89, and 0.81, respectively. Thus, the SMC sample (solid line) is less correlated when compared to the Galactic sample (dashed line), while the combined data sample (dotted line) shows a stronger correlation than the SMC data alone because of the increased sample size.
From this plot, we also see that the SMC sources tend to have systematically larger H EW than Galactic sources with similar orbital periods. This could be due to their faster rotational velocities (a result of their lower metallicity, as observed for example by Martayan et al. 2007b) and hence larger decretion disks. However, given the truncation effect discussed earlier, growing a larger disk would require a wider orbit which for the same orbital period would indicate a lower ellipticity. Alternatively, a high mass-loss rate would allow a faster growth of the disk after the truncation.
5.3 Intrinsic reddening
In addition to the H EW, the color is also an indicator of the size of the circumstellar disk. By plotting these quantities, Coe et al. (2005) find a similar range in the values of Galactic Be stars and SMC Be-XRBs, but not significant evidence for a correlation between the H EW and the color for the Be-XRBs. Here we revisit this study using our extended census of Be-XRBs and comparing with SMC Be stars from the study of NGC330 by Martayan et al. (2007a). The H EWs for the Be-XRBs are taken from Table Optical spectroscopy of 20 Be/X-ray Binaries in the Small Magellanic Cloud and the J and K magnitudes from Table 2, corrected for reddening assuming E(J-K)=0.56E(B-V) (Bessell & Brett 1988), and E(B-V)=0.09 mag (following Antoniou et al. 2009). The H EW measurements for the NGC330 Be stars are taken from Martayan et al. (2007a), while the color values are the result of the cross-correlation of the above census with the 2MASS catalog666We searched for the nearest 2MASS counterpart of the NGC330 Be stars within 1.5″ from their position. For the 131 NGC330 stars, we found 88 matches but we kept only 48, because the remaining do not have constrained J and/or K magnitude errors listed in the 2MASS catalog..
A comparison of these two quantities does not show any evidence for correlation, which we attribute to the fact that the IR and H observations are not simultaneous, and thus the comparison between the two quantities is not direct. Therefore, we do not pursue this comparison further. Instead we focus on the individual distributions of the H EW and (J-K) color. As shown in Figures 2 and 4, respectively, the majority of the Be-XRBs presented in this work have H EWs extending up to the mid range of the corresponding values for Be stars, while both the Be stars and the Be-XRBs in the SMC have similar values of the color. When we compare the results for the Be-XRBs presented in this work with the study of Coe et al. (2005), we find compatible values for the H EWs, however most of the sources in the present work have larger values of the color ( mag; Figure 4) than those presented by Coe et al. (2005; mag). This can be the result of the different extinction correction in the two studies. We have used E(J-K)=0.05, while Coe et al. (2005) corrected for all reddening effects by using the same color shift used for determining the spectral class of their objects (shift by (B-V)=-0.13 from their study).
We then investigate the correlation of the H EW measurements to the intrinsic reddening caused by the circumstellar disks around Be stars. We define this “local” reddening as the difference in the B-V color of the observed (extinction corrected) and theoretical values. The observed B-V color is taken from the MCPS catalog of Zaritsky et al. 2002 (since all the Be-XRBs from the present study have an optical counterpart in this catalog) after correcting for the extinction to the SMC (E(B-V)=0.09; see §3.1). In order to derive the theoretical B-V color, we first assign an effective temperature to each B subtype using the temperature scale for main-sequence B-type stars at the SMC metallicity (Figure 33(d) of Hunter et al. 2007). We then derived the theoretical B-V color using the Geneva isochrones database (Lejeune & Schaerer 2001) assuming Z=0.004 (for the SMC metallicity) and the nearest corresponding available effective temperature to the one derived above. The H EW versus intrinsic reddening plot is presented in Figure 8, while the values of these quantities are given in Table 7. In Column 1 we give the source ID, in Column 2 the spectral classification from this study and in Columns 3 and 4 the extinction corrected color and the corresponding error (using data listed in Table 2), respectively. In Column 5 we give the nearest B subtype to the classified sources used in order to derive the effective temperature. In Column 6 we give the B-V color from the isochrones, and in Column 7 the intrinsic reddening (extinction corrected photometric minus theoretical B-V values). In Table 7 and Figure 8 we did not include source 6-4 because its composite spectrum indicates that there might be more than one stars contributing to its emission. From this figure, we do not find any correlation between these two quantities, though they are both related to the decretion disk of the Be star. The large scatter in the plot is mainly due to the fact that the theoretical values for the (B-V) color are in some degree uncertain. First, we had to assume a mean subtype for sources with uncertain spectral class (e.g. X-ray sources 3-3, 6-1, 5-12). Then, we had to extrapolate the temperature scale of Hunter et al. (2007) to later than B1 spectral subtypes. And finally, we had to choose the nearest effective temperature derived above to the one used in the Geneva database. All the above, in addition to disk inclination effects, can account, at least in part, for the large scatter of this plot, and may explain the fact that we do not find any correlation of the H EW and the intrinsic reddening, though they are both related to the size of the circumstellar disk around Be stars. We also note that even if we use the mean B-V color for each B subtype using data from Evans et al. (2004), we do not find any correlation either. The fact that the spectroscopic and photometric observations are not simultaneous may also result in increased scatter.
6 Summary
We have presented the results of a detailed optical spectroscopic analysis of 20 HMXBs in the SMC. These sources have been detected with Chandra (A. Zezas et al. 2009, in preparation) and XMM-Newton (Haberl & Pietsch 2004). In the present work, we confirm the Be nature of all these systems. In addition, we provide their full wavelength range () spectra.
The classification of these 20 systems is accurate to better than subclass and is proved to be in good agreement with previous studies. In a few cases, only wide range spectral-types could be assigned, and for these systems higher resolution spectroscopy is needed in order to derive more accurate classifications. We also find similar spectral-type distributions for Be-XRBs and Be field stars in the SMC. With the present available data we cannot conclude that the Be-XRBs in the SMC and the Milky Way or the LMC follow a different spectral-type distribution. In addition, we find similar Be spectral type distributions between the MCs samples, while we do not find evidence for differences between the MCs and the Milky Way.
Moreover, our results reinforce the relation between the orbital period and the equivalent width of the H line that holds for Be-XRBs. This relation is the result of truncated decretion disks in smaller period systems, due to the interaction of the compact object with the circumstellar disk of the Be star. For similar orbital periods, SMC sources tend to have systematically larger H EW than Galactic sources. This could be due to their faster rotational velocities (a result of their lower metallicity, as observed for example by Martayan et al. 2007b) and hence larger decretion disks.
We also investigate the near-infrared properties of the 20 Be-XRBs by cross-correlating their X-ray positions with sources in the 2MASS catalog. For sources with a 2MASS counterpart we do not find evidence for correlation of the H EW values and the J-K color, though they are both related to the size of the decretion disk. The same holds for the H EW values when compared to the intrinsic reddening of the sources (defined as the observed minus the theoretical B-V color).
References
- (1) Andrillat, Y., & Fehrenbach, C. 1982, A&AS, 48, 93
- (2) Antoniou, V., Zezas, A., Hatzidimitriou, D., & McDowell, J. C. 2009, ApJ, 697, 1695
- (3) Ashok, N. M., Bhatt, H. C., Kulkarni, P. V., & Joshi, S. C. 1984, MNRAS, 211, 471
- (4) Bauer, D. F. 1972, Journal of the American Statistical Association, 67, 687
- (5) Bessell, M. S., & Brett, J. M. 1988, PASP, 100, 1134
- (6) Brusa, M., et al. 2007, ApJS, 172, 353
- (7) Coe, M. J., Edge, W. R. T., Galache, J. L., & McBride, V. A. 2005, MNRAS, 356, 502
- (8) Coe, M. J., Haigh, N. J., Laycock, S. G. T., Negueruela, I., & Kaiser, C. R. 2002, MNRAS, 332, 473
- (9) Conover, W. J. 1971, in Practical nonparametric statistics, ed. W. J. Conover (New York: Wiley)
- (10) Corbet, R., Marshall, F. E., Lochner, J. C., Ozaki, M., & Ueda, Y. 1998, IAU Circ., 6803, 1
- (11) Dachs, J., Hanuschik, R., Kaiser, D., & Rohe, D. 1986, A&A, 159, 276
- (12) Dachs, J., Hummel, W., & Hanuschik, R. W. 1992, A&AS, 95, 437
- Dray (2006) Dray, L. M. 2006, MNRAS, 370, 2079
- (14) Ekström, S., Meynet, G., Maeder, A., & Barblan, F. 2008, A&A, 478, 467
- (15) Evans, C. J., Howarth, I. D., Irwin, M. J., Burnley, A. W., & Harries, T. J. 2004, MNRAS, 353, 601
- (16) Fabregat, J., & Reglero, V. 1990, MNRAS, 247, 407
- Filipović et al. (2000) Filipović, M. D., Pietsch, W., & Haberl, F. 2000, A&A, 361, 823
- (18) Garmany, C. D., & Humphreys, R. M. 1985, AJ, 90, 2009
- (19) Gehrz, R. D., Hackwell, J. A., & Jones, T. W. 1974, ApJ, 191, 675
- (20) Grundstrom, E. D., & Gies, D. R. 2006, ApJ, 651, L53
- (21) Haberl, F., Eger, P., Pietsch, W., Corbet, R. H. D., & Sasaki, M. 2008, A&A, 485, 177
- (22) Haberl, F., & Pietsch, W. 2004, A&A, 414, 667
- (23) Haberl, F., Pietsch, W., Schartel, N., Rodriguez, P., & Corbet, R. H. D. 2004, A&A, 420, L19
- (24) Haberl, F., & Sasaki, M. 2000, A&A, 359, 573
- (25) Hunter, I., et al. 2007, A&A, 466, 277
- (26) Lamers, H. J. G. L. M., Zickgraf, F.-J., de Winter, D., Houziaux, L., & Zorec, J. 1998, A&A, 340, 117
- (27) Lavalley, M., Isobe, T., & Feigelson, E. 1992, in ASP Conf. Ser. 25, Astronomical Data Analysis Software and Systems I, ed. D. M. Worrall, C. Biemesderfer, & J. Barnes (San Francisco, CA: ASP) 245
- (28) Lejeune, T., & Schaerer, D. 2001, A&A, 366, 538
- (29) Lennon, D. J. 1997, A&A, 317, 871
- (30) Lewis, I. J., et al. 2002, MNRAS, 333, 279
- (31) Liu, Q. Z., van Paradijs, J., & van den Heuvel, E. P. J. 2005, A&A, 442, 1135
- (32) Liu, Q. Z., van Paradijs, J., & van den Heuvel, E. P. J. 2006, A&A, 455, 1165
- (33) Luck, R. E., Moffett, T. J., Barnes, T. G., III, & Gieren, W. P. 1998, AJ, 115, 605
- (34) Macomb, D. J., Fox, D. W., Lamb, R. C., & Prince, T. A. 2003, ApJ, 584, L79
- (35) Maeder, A., Grebel, E. K., & Mermilliod, J.-C. 1999, A&A, 346, 459
- (36) Maíz-Apellániz, J., Walborn, N. R., Galué, H. Á., & Wei, L. H. 2004, ApJS, 151, 103
- Marshall et al. (1998) Marshall, F. E., et al. 1998, IAU Circ., 6818, 1
- (38) Martayan, C., Floquet, M., Hubert, A. M., Gutiérrez-Soto, J., Fabregat, J., Neiner, C., & Mekkas, M. 2007a, A&A, 472, 577
- (39) Martayan, C., Frémat, Y., Hubert, A.-M., Floquet, M., Zorec, J., & Neiner, C. 2006b, A&A, 452, 273
- (40) Martayan, C., Frémat, Y., Hubert, A.-M., Floquet, M., Zorec, J., & Neiner, C. 2007b, A&A, 462, 683
- (41) Martayan, C., Hubert, A. M., Floquet, M., Fabregat, J., Frémat, Y., Neiner, C., Stee, P., & Zorec, J. 2006a, A&A, 445, 931
- (42) McBride, V. A., Coe, M. J., Negueruela, I., Schurch, M. P. E., & McGowan, K. E. 2008, MNRAS, 388, 1198
- (43) McSwain, M. V., & Gies, D. R. 2005, ApJS, 161, 118
- (44) McSwain, M. V., Huang, W., Gies, D. R., Grundstrom, E. D., & Townsend, R. H. D. 2008, ApJ, 672, 590
- (45) Meyssonnier, N., & Azzopardi, M. 1993, A&AS, 102, 451
- Negueruela (1998) Negueruela, I. 1998, A&A, 338, 505
- (47) Negueruela, I., & Coe, M. J. 2002, A&A, 385, 517
- (48) Reig, P. 2007, MNRAS, 377, 867
- (49) Reig, P., Fabregat, J., & Coe, M. J. 1997, A&A, 322, 193
- (50) Russell, S. C., & Dopita, M. A. 1992, ApJ, 384, 508
- Santangelo et al. (1998) Santangelo, A., Cusumano, G., dal Fiume, D., Israel, G. L., Stella, L., Orlandini, M., & Parmar, A. N. 1998, A&A, 338, L59
- (52) Sasaki, M., Pietsch, W., & Haberl, F. 2003, A&A, 403, 901
- (53) Schmidtke, P. C., Cowley, A. P., Crane, J. D., Taylor, V. A., McGrath, T. K., Hutchings, J. B., & Crampton, D. 1999, AJ, 117, 927
- (54) Skiff, B. A. 2007, VizieR Online Data Catalog, 1, 2023
- (55) Skrutskie, M. F., et al. 2006, AJ, 131, 1163
- (56) Slettebak, A. 1982, ApJS, 50, 55
- (57) Stevens, J. B., Coe, M. J., & Buckley, D. A. H. 1999, MNRAS, 309, 421
- (58) Udalski, A., Szymanski, M., Kubiak, M., Pietrzynski, G., Wozniak, P., & Zebrun, K. 1998, Acta Astron., 48, 147
- van Paradijs & McClintock (1995) van Paradijs, J., & McClintock, J. E. 1995, in X-ray Binaries, eds. W.H.G. Lewin, J. van Paradijs, and E.P.J. van den Heuvel (Cambridge: Cambridge Univ. Press), 58
- Walborn & Fitzpatrick (1990) Walborn, N. R., & Fitzpatrick, E. L. 1990, PASP, 102, 379
- (61) Wisniewski, J. P., & Bjorkman, K. S. 2006, ApJ, 652, 458
- Yokogawa et al. (2003) Yokogawa, J., Imanishi, K., Tsujimoto, M., Koyama, K., & Nishiuchi, M. 2003, PASJ, 55, 161
- (63) Zamanov, R. K., Reig, P., Martí, J., Coe, M. J., Fabregat, J., Tomov, N. A., & Valchev, T. 2001, A&A, 367, 884
- (64) Zaritsky, D., Harris, J., Thompson, I. B., Grebel, E. K., & Massey, P. 2002, AJ, 123, 855
- (65) Zorec, J., & Briot, D. 1997, A&A, 318, 443
| X-ray Src ID††The X-ray source ID corresponds to Chandra sources as in Antoniou et al. (2009; (Field ID)-(Src ID within the field)). The XMM ID and their association with sources from other works are from Haberl & Pietsch (2004). | Other Source Names | Pulsar ID‡‡Source names related to their X-ray pulse periods (in seconds) and based on the online census of Malcolm Coe as of 22 August 2008 (http://www.astro.soton.ac.uk/mjc/). | [MA93]⋆⋆Emission-line object ID from the catalog of Meyssonnier & Azzopardi (1993). |
|---|---|---|---|
| [1] | [2] | [3] | [4] |
| XMM-3 | XMMU J004723.7-731226 (1) = (RX J0047.3-7312 AX J0047.3-7312) (2) | SXP264 | 172 |
| 4-8 | CXOU J004814.2-731004 (3) = XMMU J004814.1-731003 (4) | SXP25.5 | |
| XMM-5 | XMMU J004834.5-730230 (1) = (RX J0048.5-7302) (5) | 238 | |
| 4-2 (XMM-7) | CXOU J004913.6-731138 = XMMU J004913.8-731136 (1) = (RX J0049.2-7311) (6) | SXP9.13 | |
| 4-5 (XMM-9) | CXOU J004929.7-731059 (3) = XMMU J004929.9-731058 (1) | SXP893 | 300 |
| = (RX J0049.5-7310) (6) | |||
| 4-1 (XMM-12) | CXOU J005044.6-731605 (3) = XMMU J005045.2-731602 (1) | SXP323 | 387 |
| = (RX J0050.8-7316 = AX J0051-733) (2,7) | |||
| XMM-15 | AX J0051-722 (8) | SXP91.1 | 413:: |
| 4-3 (XMM-14) | CXOU J005057.2-731008 = XMMU J005057.6-731007 (1) | 414 | |
| = (RX J0050.9-7310, AX J0050.8-7310) (2) | |||
| XMM-17 | XMMU J005152.2-731033 (1) = (RX J0051.9-7311 = AX J0051.6-7311) (2,7) | SXP172 | 504 |
| 6-1 | CXOU J005209.0-723804 (3) | SXP82.4 | |
| 5-12 | CXOU J005245.0-722844 (3) | ||
| 6-4 | CXOU J005252.2-724830 (3) | 618 | |
| 5-2 | CXOU J005323.9-722716 (3) | SXP138 | 667 |
| 5-16 | CXOU J005355.3-722646 (3) = 1WGA 0053.8-7226,XTE J0053-724 | SXP46.6 | |
| 5-4 | CXOU J005446.2-722523 (3) | 798 | |
| 6-2 | CXOU J005455.8-724511 (3) | SXP504 | 809 |
| 5-7 (XMM-30) | CXOU J005456.3-722648 (3) = | SXP59.0 | 810 |
| (XTE J0055-724 = 1SAX J0054.9-7226 = 1WGA J0054.9-7226) (9,10,11) | |||
| 3-3 (XMM-33) | CXOU J005736.0-721934 (3) = CXOU J005736.2-721934 (11,12) | SXP565 | 1020 |
| XMM-39 | XMMU J010030.2-722035 (11) | 1208 | |
| XMM-47 | RX J0104.5-7221 (5) | 1470 | |
| ::::footnotetext: The H emission-line nature of the object is very doubtful, mainly due to its severe faintness or because it is a late-type star (Meyssonnier & Azzopardi 1993). |
References. — (1) Haberl & Pietsch (2004), (2) Yokogawa et al. (2003), (3) A. Zezas et al. (2009; in preparation), (4) Haberl et al. (2008), (5) Haberl & Sasaki (2000), (6) Filipovic et al. (2000), (7) Schmidtke et al. (1999), (8) Corbet et al. (1998), (9) Marshall et al. (1998), (10) Santangelo et al. (1998), (11) Sasaki, Pietsch & Haberl (2003), (12) Macomb et al. (2003)
| X-ray | Optical | Off.‡‡The offset (in arcseconds) between the counterpart and the X-ray source. | 2MASS ID⋆⋆Closest counterpart within 2″ from the X-ray source position. | ||||||
|---|---|---|---|---|---|---|---|---|---|
| Src ID††Same as in Table Optical spectroscopy of 20 Be/X-ray Binaries in the Small Magellanic Cloud. | R.A. | Decl. | Src ID | X-O | |||||
| (h m s) | (∘ ′ ″ ) | (″) | (mag) | (mag) | |||||
| [1] | [2] | [3] | [4] | [5] | [6] | [7] | [8] | [9] | [10] |
| XMM-3 | 00 47 23.7 | -73 12 27 | O-4-116979 | 1.52 | J00472330-7312275 | ||||
| Z-1713720 | 1.25 | ||||||||
| 4-8 | 00 48 14.15 | -73 10 4.1 | O-4-171264 | 0.63 | J00481410-7310045 | ||||
| Z-1816472 | 0.30 | ||||||||
| XMM-5 | 00 48 34.5 | -73 02 30 | O-4-178950 | 1.85 | |||||
| =O-5-43566 | 1.89 | ||||||||
| Z-1857369 | 1.64 | ||||||||
| 4-2 | 00 49 13.8 | -73 11 37 | O-5-111490 | 0.84 | J00491360-7311378 | ||||
| (XMM-7) | Z-1938257 | 0.75 | |||||||
| 4-5 | 00 49 29.74 | -73 10 58.5 | O-5-111500 | 0.61 | J00492984-7310583 | ||||
| (XMM-9) | Z-1971979 | 0.65 | |||||||
| 4-1 | 00 50 44.61 | -73 16 5.3 | O-5-180026 | 0.55 | J00504470-7316054 | ||||
| (XMM-12) | Z-2131651 | 0.60 | |||||||
| XMM-15 | 00 50 56.9 | -72 13 31 | Z-2158744 | 3.22 | |||||
| 4-3 | 00 50 57.6 | -73 10 08 | O-5-271074 | 2.10 | |||||
| (XMM-14) | Z-2159045 | 1.93 | |||||||
| XMM-17 | 00 51 52.3 | -73 10 33 | O-6-22749 | 1.36 | J00515203-7310340 | ||||
| Z-2280409 | 1.32 | ||||||||
| 6-1 | 00 52 8.95 | -72 38 3.5 | O-6-77228 | 0.58 | J00520896-7238032 | ||||
| Z-2319498 | 0.64 | ||||||||
| 5-12 | 00 52 45.04 | -72 28 43.6 | Z-2406014 | 0.35 | J00524508-7228437 | ||||
| 6-4 | 00 52 52.22 | -72 48 29.8 | O-6-147662 | 0.27 | J00525230-7248301 | ||||
| Z-2423181 | 0.56 | ||||||||
| 5-2 | 00 53 23.86 | -72 27 15.5 | Z-2498173 | 0.24 | J00532381-7227152 | ||||
| 5-16 | 00 53 55.25 | -72 26 45.8 | Z-2573354 | 0.83 | J00535518-7226448 | ||||
| 5-4 | 00 54 46.22 | -72 25 23.0 | O-7-70843 | 0.79 | J00544633-7225228 | ||||
| Z-2707354 | 0.83 | ||||||||
| 6-2 | 00 54 55.78 | -72 45 10.7 | O-7-47103 | 0.40 | J00545586-7245108 | ||||
| Z-2729974 | 0.61 | ||||||||
| 5-7 | 00 54 56.34 | -72 26 48.4 | O-7-70829 | 1.19 | J00545618-7226478 | ||||
| (XMM-30) | Z-2730786 | 1.21 | |||||||
| 3-3 | 00 57 36.00 | -72 19 33.9 | O-8-49531 | 0.14 | J00573602-7219341 | ||||
| (XMM-33) | Z-3103982 | 0.53 | |||||||
| XMM-39 | 01 00 30.2 | -72 20 35 | O-9-35989 | 2.04 | J01003000-7220335 | ||||
| Z-3499823 | 2.13 | ||||||||
| XMM-47 | 01 04 35.7 | -72 21 43 | O-10-61612 | 5.28 | |||||
| Z-4031467 | 4.91 | ||||||||
| X-ray Src ID††Same as in Table Optical spectroscopy of 20 Be/X-ray Binaries in the Small Magellanic Cloud. | Center | FWHM | EW | EW (Refer.) | ⋆⋆Orbital period in days from Liu et al. (2005) and references therein. | |||
|---|---|---|---|---|---|---|---|---|
| (Å) | (Å) | (Å) | (Å) | (Å) | (Å) | (Å) | (d) | |
| [1] | [2] | [3] | [4] | [5] | [6] | [7] | [8] | [9] |
| XMM-3 | 6564.57 | 0.06 | 11.32 | 0.14 | -24.40 | 0.48 | (1) | 48.8 |
| 4-8 | 6565.61 | 0.12 | 11.08 | 0.26 | -15.68 | 0.33 | ||
| XMM-5 | 6566.06 | 0.03 | 12.55 | 0.08 | -36.03 | 0.24 | ||
| 4-2 (XMM-7) | 6565.49 | 0.03 | 12.13 | 0.08 | -32.41 | 0.40 | (1) | 91.5 |
| 4-5 (XMM-9) | 6566.09 | 0.08 | 15.51 | 0.21 | -38.47 | 0.70 | 91.5 | |
| 4-1 (XMM-12) | 6566.27 | 0.08 | 14.11 | 0.21 | -28.30 | 0.82 | (1) | 0.708 |
| XMM-15 | 6566.12 | 0.04 | 14.83 | 0.10 | -32.04 | 1.07 | -22 (2) | 88.4 |
| 4-3 (XMM-14) | 6564.99 | 0.05 | 10.53 | 0.11 | -20.37 | 0.35 | ||
| XMM-17 | 6566.71 | 0.10 | 11.97 | 0.25 | -16.16 | 0.26 | (1) | 67.0 |
| 6-1 | 6566.94 | 0.04 | 10.56 | 0.09 | -23.87 | 0.38 | ||
| 5-12 | 6565.67 | 0.26 | 10.44 | 0.62 | -5.38 | 0.11 | ||
| 6-4 | 6565.83 | 0.16 | 13.05 | 0.38 | -6.59 | 0.18 | ||
| 5-2 | 6565.92 | 0.09 | 13.26 | 0.24 | -24.02 | 0.63 | 125.0 | |
| 5-16 | 6566.00 | 0.05 | 11.76 | 0.12 | -19.48 | 0.46 | (1) | |
| 5-4 | 6566.84 | 0.09 | 12.83 | 0.24 | -36.19 | 1.06 | ||
| 6-2 | 6566.14 | 0.03 | 12.40 | 0.08 | -56.00 | 0.95 | 261.0 | |
| 5-7 (XMM-30) | 6565.67 | 0.04 | 10.90 | 0.10 | -19.97 | 0.66 | (2) | 123.0 |
| 3-3 (XMM-33) | 6565.78 | 0.09 | 11.98 | 0.22 | -32.08 | 0.45 | (1) | 95.3 |
| XMM-39 | 6565.74 | 0.03 | 10.33 | 0.07 | -65.02 | 1.44 | ||
| XMM-47 | 6565.82 | 0.06 | 11.94 | 0.16 | -38.64 | 0.60 | ||
References. — (1) Coe et al. (2005), (2) Stevens, Coe & Buckley (1999)
| Line Identifications | Spectral Class |
|---|---|
| [1] | [2] |
| HeII , HeII , HeII present | Earlier than B0 |
| HeII , HeII present | B0 |
| HeII and HeII absent, HeII weak | B0.5 |
| HeII absent, SiIV present | B1 |
| SiIV absent, SiIII appear | B1.5 |
| OII+CIII blend decreases rapidly | Later than B1.5 |
| MgII SiIII | B2 |
| MgII SiIII | B2.5 |
| MgII SiIII | B3 |
| OII+CIII blend disappears | Later than B3 |
| SiIII absent | B5 |
| HeI SiII HeI | B8 |
| HeI MgII | B9 |
| X-ray | Classification | |
|---|---|---|
| Src ID††Same as in Table Optical spectroscopy of 20 Be/X-ray Binaries in the Small Magellanic Cloud. | This Study | Previous |
| [1] | [2] | [3] |
| XMM-3 | B0.5e | B1-1.5 Ve (1) |
| 4-8 | B1.5e | Later than B3e‡‡Photometric classification. (2), Be? (3) |
| XMM-5 | B1.5e | B0-5 (II) = [2dF]690**Sources from Evans et al. (2004) appear as [2dF]ID, where ID comes from the original catalog. (4), Be? (5) |
| 4-2 (XMM-7) | B1e | B1-3 IV-Ve (1) |
| 4-5 (XMM-9) | B1e | Be? (6) |
| 4-1 (XMM-12) | B0.5e | B0-0.5 Ve (7) |
| XMM-15 | B0.5e | B0.5 III-Ve (1) |
| 4-3 (XMM-14) | B0.5e | Be? (6) |
| XMM-17 | B0e | Be ((8), peculiar (9)) |
| O9.5-B0 Ve (1) | ||
| 6-1 | B1-3e | B1-5 (II)e = [2dF]5054**Sources from Evans et al. (2004) appear as [2dF]ID, where ID comes from the original catalog. (4), Be (8) |
| B1-3 III-Ve (1) | ||
| 5-12 | O9-B0e | Be? (3) |
| 6-4 | O2((f))+OBe | Be (5), B type with Balmer emission (10) |
| 5-2 | B0.5e | B1-2 IV-Ve (1) |
| 5-16 | B0.5e | O9.5-B1 IV-Ve (1) |
| 5-4 | B1e | Be? (3) |
| 6-2 | B1e | B1 III-Ve (1) |
| 5-7 (XMM-30) | B0e | O9 Ve (1) |
| 3-3 (XMM-33) | B0-4e | B0-2 IV-Ve (1) |
| XMM-39 | B1.5e | B0-5 (II) = [2dF]1475**Sources from Evans et al. (2004) appear as [2dF]ID, where ID comes from the original catalog. (4), Be? (6) |
| XMM-47 | B1.5e | B0.5 (IV)e = [2dF]1905**Sources from Evans et al. (2004) appear as [2dF]ID, where ID comes from the original catalog. (4), Be? (5) |
References. — (1) McBride et al. (2008), (2) Haberl et al. (2008), (3) Antoniou et al. (2009), (4) Evans et al. (2004), (5) Haberl & Sasaki (2000), (6) Haberl & Pietsch (2004), (7) Coe et al. (2002), (8) Coe et al. (2005), (9) Schmidtke et al. (1999), (10) Garmany & Humphreys (1985)
| Sample | SMC Be-XRBs | LMC Be-XRBs | MW Be-XRBs | SMC Be stars | LMC Be stars | MW Be stars |
|---|---|---|---|---|---|---|
| SMC Be-XRBs | 0.92 | 0.92 | 1.00 | 1.00 | 0.31 | |
| LMC Be-XRBs | 0.92 | 1.00 | 0.66 | 0.82 | 0.08 | |
| MW Be-XRBs | 0.92 | 1.00 | 0.66 | 0.82 | 0.08 | |
| SMC Be stars | 1.00 | 0.66 | 0.66 | 1.00 | 0.53 | |
| LMC Be stars | 1.00 | 0.82 | 0.82 | 1.00 | 0.66 | |
| MW Be stars | 0.31 | 0.08 | 0.08 | 0.53 | 0.66 |
| Source ID | Spectral Class | errBV | Nearest B-subtype | |||
|---|---|---|---|---|---|---|
| (mag) | (mag) | (mag) | (mag) | |||
| [1] | [2] | [3] | [4] | [5] | [6] | [7] |
| XMM-3 | B0.5e | -0.01 | 0.04 | B0.5 | -0.28 | 0.27 |
| 4-8 | B1.5e | 0.17 | 0.06 | B1.5 | -0.26 | 0.43 |
| XMM-5 | B1.5e | -0.09 | 0.04 | B1.5 | -0.26 | 0.17 |
| 4-2 (XMM-7) | B1 | 0.10 | 0.05 | B1 | -0.27 | 0.37 |
| 4-5 (XMM-9) | B1e | 0.11 | 0.05 | B1 | -0.27 | 0.38 |
| 4-1 (XMM-12) | B0.5e | -0.20 | 0.05 | B0.5 | -0.28 | 0.08 |
| XMM-15 | B0.5e | -0.17 | 0.06 | B0.5 | -0.28 | 0.11 |
| 4-3 (XMM-14) | B0.5e | -0.01 | 0.06 | B0.5 | -0.28 | 0.27 |
| XMM-17 | B0e | -0.16 | 0.06 | B0 | -0.28 | 0.12 |
| 6-1 | B1-3e | -0.17 | 0.03 | B2 | -0.25 | 0.08 |
| 5-12 | O9e-B0e | -0.09 | 0.09 | O9.5 | -0.28 | 0.19 |
| 5-2 | B0.5e | -0.18 | 0.12 | B0.5 | -0.28 | 0.10 |
| 5-16 | B0.5e | -0.16 | 0.03 | B0.5 | -0.28 | 0.12 |
| 5-4 | B1e | 0.05 | 0.06 | B1 | -0.27 | 0.32 |
| 6-2 | B1e | -0.12 | 0.04 | B1 | -0.27 | 0.15 |
| 5-7 (XMM-30) | B0e | -0.14 | 0.04 | B0 | -0.28 | 0.14 |
| 3-3 (XMM-33) | B0-4e | -0.08 | 0.17 | B2 | -0.25 | 0.17 |
| XMM-39 | B1.5e | -0.15 | 0.14 | B1.5 | -0.26 | 0.11 |
| XMM-47 | B1.5e | -0.04 | 0.03 | B1.5 | -0.26 | 0.22 |


![[Uncaptioned image]](/html/0912.1876/assets/x7.png)
![[Uncaptioned image]](/html/0912.1876/assets/x8.png)
![[Uncaptioned image]](/html/0912.1876/assets/x9.png)
![[Uncaptioned image]](/html/0912.1876/assets/x10.png)
![[Uncaptioned image]](/html/0912.1876/assets/x11.png)
![[Uncaptioned image]](/html/0912.1876/assets/x12.png)
![[Uncaptioned image]](/html/0912.1876/assets/x13.png)
![[Uncaptioned image]](/html/0912.1876/assets/x14.png)
![[Uncaptioned image]](/html/0912.1876/assets/x15.png)
![[Uncaptioned image]](/html/0912.1876/assets/x16.png)
![[Uncaptioned image]](/html/0912.1876/assets/x17.png)
![[Uncaptioned image]](/html/0912.1876/assets/x18.png)
![[Uncaptioned image]](/html/0912.1876/assets/x19.png)
![[Uncaptioned image]](/html/0912.1876/assets/x20.png)