Ages and Metallicities of Central and Satellite Galaxies: Implications for Galaxy Formation and Evolution
Abstract
Using the stellar ages and metallicities of galaxies in the Sloan Digital Sky Survey (SDSS) obtained by Gallazzi et al. (2005) and the SDSS galaxy group catalogue of Yang et al. (2007), we study how the stellar ages and metallicities of central and satellite galaxies depend on stellar mass, , and halo mass, . We find that satellites are older and metal-richer than centrals of the same stellar mass, and this difference increases with decreasing . In addition, the slopes of the age-stellar mass and metallicity-stellar mass relations are found to become shallower in denser environments (more massive halos). This is due to the fact that the average age and metallicity of low mass satellite galaxies () increase with the mass of the halo in which they reside. In order to gain understanding of the physical origin of these trends, we compare our results with the semi-analytical model of Wang et al. (2008). The model, which predicts stellar mass functions and two-point correlation functions in good overall agreement with observations, also reproduces the fact that satellites are older than centrals of the same stellar mass and that the age difference increases with the halo mass of the satellite. This is a consequence of the fact that satellites are stripped of their hot gas reservoir shortly after they are accreted by their host halos (strangulation). The ensuing quenching of star formation leaves the stellar populations of satellites to evolve passively, while the prolonged star formation activity of centrals keeps their average ages younger. The resulting age offset is larger in more massive environments because their satellites were accreted earlier. The model does not reproduce the halo mass dependence of the metallicities of low mass satellites, yields metallicity-stellar mass and age-stellar mass relations that are too shallow, and predicts that satellite galaxies have the same metallicities as centrals of the same stellar mass, in disagreement with the data. We argue that these discrepancies are likely to indicate the need to (i) modify the recipes of both supernova feedback and AGN feedback, (ii) use a more realistic description of strangulation, and (iii) include a proper treatment of the tidal stripping, heating and destruction of satellite galaxies.
keywords:
galaxies: clusters: general – galaxies: stellar content – galaxies: evolution – galaxies: general – galaxies: statistics – dark matter1 Introduction
Galaxies in the nearby Universe obey a number of scaling relations between stellar mass or luminosity and rotation velocity, velocity dispersion, size, metallicity, and black hole mass (e.g., Tully & Fisher 1977; Faber & Jackson 1976; Shen et al. 2003; Tremonti et al. 2004; Magorrian et al. 1998). At the same time, some of their properties appear to depend on the environment in which they reside. For instance, it is well-known that early-type galaxies are preferentially found in dense environments, while field galaxies are typically late-types (Oemler 1974; Dressler 1980, Postman & Geller 1984, Whitmore, Gilmore & Jones 1993; Goto et al. 2003; Weinmann et al. 2006a, 2009). In addition to this morphology-density relation, various other galaxy parameters have been shown to correlate with their environment as well. In particular, galaxies in denser environment (more massive host halos) have been shown to be redder (Hogg et al. 2004; Balogh et al. 2004b; Weinmann et al. 2006a), to have lower star formation rates (Balogh et al. 1997, 1999; Poggianti et al. 1999; Hashimoto et al. 1998; Dominguez et al. 2002; Lewis et al. 2002; Gomez et al. 2003; Balogh et al. 2004a; Tanaka et al. 2004; Kauffmann et al. 2004), less nuclear activity (Miller et al. 2003; Kauffmann et al. 2004; Pasquali et al. 2009), smaller radii (Blanton et al. 2005b; Weinmann et al. 2009), and smaller gas mass fractions (Giovanelli & Haynes 1985; Solanes et al. 2001; Levy et al. 2007) than those in less dense environments.
On the other hand, it has also become clear that these same galaxy properties correlate strongly with stellar mass and/or luminosity (e.g., McGaugh & de Blok 1997; Blanton et al. 2003; Baldry et al. 2004; Kauffmann et al. 2003a,b; Hogg et al. 2004; Kelm et al. 2005; Weinmann et al. 2006a; van den Bosch et al. 2008b; Pasquali et al. 2009). Based on all these findings, a picture emerges in which galaxy formation and evolution is governed by both the stellar mass (the “nature” parameter) and the density or mass of the host environment (the “nurture” ingredient). The challenge is to disentangle the nature effects from those induced by nurture, and to determine the independent strength of these two parameters. This is complicated by the fact that there exists a strong correlation between stellar mass (luminosity) and environment, in that more massive (brighter) galaxies preferentially reside in denser environments (Hogg et al. 2003; Mo et al. 2004; Blanton et al. 2005b; Croton et al. 2005; Hoyle et al. 2005) Hence, any causal connection between a galaxy property and its stellar mass will automatically induce a correlation between and environment, and vice versa.
One of the most common ways of defining environment is through the projected number density of galaxies (e.g. above a given magnitude limit). Typically this number density, indicated by , is measured using the projected distance to the th nearest neighbor, with typically in the range 5-10 (e.g., Dressler 1980, Lewis et al. 2002; Gómez et al. 2003; Goto et al. 2003; Tanaka et al. 2004; Balogh et al. 2004a,b; Kelm et al. 2005; Cooper et al. 2008, 2009). As discussed in length by Weinmann et al. (2006a), the problem with this environment indicator (or with one that uses a fixed metric aperture) is that its physical interpretation depends on the environment itself; in clusters, where the number of galaxies is larger than , it is representatitive only of the local environment, on a scale much smaller than the cluster. On the contrary, in low density environments measures the global density over a spatial scale that is much larger than the halo in which the galaxy resides. An alternative measure of environment is provided by the cross-correlation length of galaxies, that estimates their clustering amplitude on scales from a few kpc to a few Mpc (cf. Wake et al. 2004; Croom et al. 2005; Li et al. 2006; Skibba et al. 2008). Both and the cross-correlation method have the disadvantage of not being directly comparable with the environment in models of galaxy formation and evolution, where it is usually described in terms of the dark matter distribution, and where it is important to discriminate between central galaxies and satellites (which are subjected to different physical processes). In order to allow for a more physically intuitive description of environment, which is more directly comparable with galaxy formation models, Yang et al. (2005) developed a halo-based galaxy group finding algorithm which basically partitions galaxies over dark matter halos, assigns masses to the halos, and splits the galaxy population in centrals and satellites.
Being able to split the galaxy population in centrals and satellites has proven to be extremely useful for investigating the impact of satellite specific transformation processes (e.g., ram-pressure stripping, tidal stripping, strangulation, harassment). Using the SDSS DR4 galaxy group catalogues of Yang et al. (2007), van den Bosch et al. (2008a) showed that, on average, satellites are redder and more concentrated than centrals of the same stellar mass. Under the hypothesis that the latter are the progenitors of the former, this suggests that some satellite specific transformation processes are at work that make galaxies become redder and more concentrated. In fact, van den Bosch et al. (2008a) find that central-satellite pairs matched in both stellar mass and colour show no average concentration difference, indicating that the transformation mechanisms affect colour more than morphology. In addition, the colour and concentration differences of central-satellite pairs were shown to be independent of the mass of the halo in which the satellite resides, which implies that satellite-specific transformation mechanisms are equally efficient in halos of all masses. This suggests that strangulation is most likely the main mechanism for quenching star formation in satellites (see also van den Bosch et al. 2008b). Weinmann et al. (2009) took this approach a step further and analysed the radial colour gradients of late-type satellites and centrals at fixed stellar mass. Satellite galaxies turn out to be smaller, fainter and redder than centrals at nearly all galactocentric radii. This is consistent with a simple model, in which star formation is quenched over time-scales of about 2 - 3 Gyr, after which the satellite galaxy is left to evolve passively. Along these lines, Pasquali et al. (2009) used the Baldwin, Philips & Terlevich’s (1981) diagram to separate centrals and satellites of different activity (star formation and optical AGN emission). They found that both star formation and AGN activity are suppressed in satellite galaxies relative to central galaxies of the same stellar mass, and that the dependence of satellite ‘activity’ (star formation or AGN activity) on halo mass is more than four times weaker than the dependence on stellar mass.
An important shortcoming of the studies of van den Bosch et al. (200ba,b) and Weinmann et al. (2009) is that they mainly focussed on (broad-band) colours. It is well-known, though, that these depend on stellar age, metallicity and dust attenuation. Keeping dust extinction aside, red colours may be due to an older (luminosity-weighted) age and/or to a higher stellar metallicity. Hence, without further information an interpretation of the colour trends mentioned above in terms of stellar population ages and metallicities is highly degenerate. As shown by Gallazzi et al. (2005) for the general galaxy population in the nearby Universe, more massive galaxies are, on average, both older and more metal rich (see also Jimenez et al. 2007). Using a sample of early-type Bright Cluster Galaxies (BCGs, with brighter than -22 mag and 1011 M⊙) extracted from the Sloan Digital Sky Survey (SDSS) DR6, Bernardi (2009) showed that in any given environment satellite BCGs are younger than central BCGs by 0.5 - 1 Gyr, while at fixed stellar mass central and satellite BCGs are coeval. As for (stellar and/or gas-phase) metallicity, it has been observed that, at fixed stellar mass, galaxies in denser environment are metal-richer by only dex with respect to their counterparts in low density environments; such a small difference indicates that there is little correlation between metallicity and environment (Sheth et al. 2006; Mouhcine et al. 2007; Cooper et al. 2008, 2009; Ellison et al. 2009; Loubser et al. 2009).
In this paper we take an important next step in our study of galaxy evolution as a function of environment: we abandon integrated galaxy colours in favor of the actual stellar ages and metallicities derived by Gallazzi et al. (2005). Since the galaxy group catalogue of Yang et al. (2007) spans 2 orders of magnitude in galaxy stellar mass, and 4 orders of magnitude in halo mass, this allows us to extend the above-cited studies over a much wider range of environments. Another important improvement of this study is that we use semi-analytical models to interpret our findings. This paper is organized as follows: in §2 we describe the galaxy group catalogues and the method used to determine the ages and metallicities of the SDSS galaxies. In §3 we describe the general properties of our sample of central and satellite galaxies. §4 presents the average ages and metallicities of centrals and satellites as functions of both stellar mass and halo mass. These results are compared to semi-analytical models in §5 in order to gain insight into the physical interpretation in the context of a CDM model of galaxy formation. §6 presents a detailed discussion of our findings, which are summarized in §7. Throughout this paper we adopt a flat CDM cosmology with and (Spergel et al. 2007) and we express units that depend on the Hubble constant in terms of .
2 Data
2.1 Galaxy groups
The sample of galaxies analyzed in this paper is taken from the SDSS DR4 galaxy group catalogue of Yang et al. (2007; hereafter Y07). This group catalogue is constructed by applying the halo-based group finder of Yang et al. (2005) to the New York University Value-Added Galaxy Catalogue (NYU-VAGC; see Blanton et al. 2005a), which is based on SDSS DR4 (Adelman-McCarthy et al. 2006). From this catalogue Y07 selected all galaxies in the Main Galaxy Sample with an extinction corrected apparent magnitude brighter than , with redshifts in the range and with a redshift completeness . This sample of galaxies is used to construct three group samples: sample I, which only uses the 362,356 galaxies with measured redshifts from the SDSS, sample II which also includes 7,091 galaxies with SDSS photometry but with redshifts taken from alternative surveys, and sample III which includes an additional 38,672 galaxies that lack a redshift due to fibre-collisions, but which we assign the redshift of its nearest neighbor (cf. Zehavi et al. 2002). The analysis presented in this paper is based on sample II. Galaxies are split into “centrals”, which are defined as the most massive group members in terms of their stellar mass, and “satellites”, which are those group members that are not centrals.
Magnitudes and colours of all galaxies are based on the standard SDSS Petrosian technique (Petrosian 1976; Strauss et al. 2002). They have been corrected for galactic extinction (Schlegel, Finkbeiner & Davis 1998), and also -corrected and evolution corrected to , using the method described in Blanton et al. (2003). We use the notation to indicate the resulting absolute magnitude in the photometric -band. Stellar masses for all galaxies (indicated by ) have been computed using the relations between stellar mass-to-light ratio and colour of Bell et al. (2003; see Y07 for details). Galaxy structure is parameterized with the concentration parameter , where and are the radii that contain 90 and 50 of the Petrosian -band flux, respectively. As shown by Strateva et al. (2001), is a reasonable proxy for Hubble type, with 2.6 selecting mostly bulge-dominated galaxies.
For each group in the Y07 catalogue two estimates of its dark matter halo mass, , are available: one based on the ranking of its total characteristic luminosity, and the other based on the ranking of its total characteristic stellar mass. Both halo masses agree very well with each other, with an average scatter that decreases from dex at the low mass end to dex at the massive end. With the method of Y07, halo masses can only be assigned to groups more massive than which have at least one member with -19.5 mag. For smaller mass halos, Yang et al. (2008) have used the relations between the luminosity (stellar mass) of central galaxies and the halo mass of their groups to extrapolate the halo mass of single central galaxies down to . This extends the number of galaxies with an assigned halo mass from 295,861 in the original Y07 paper to all 369,447 galaxies in sample II. In what follows, we will make use of the halo masses obtained from the group’s characteristic stellar mass111We have verified, though, that none of our results change significantly if we adopt the luminosity-rank based masses instead..
This sample is not volume-limited, and thus suffers from Malmquist bias, causing an artificial increase of the average luminosity (and also stellar mass) of galaxies with increasing redshift. This effect is more severe for satellites which, within each halo, have a wide mass distribution. To correct for this bias, we weight each galaxy by , where is the comoving volume of the Universe out to a comoving distance at which the galaxy would still have made the selection criteria of our sample. In what follows all distributions are weighted by , unless specifically stated otherwise. Note, though, that since we will always present our results for narrow bins in stellar mass, none of our results are sensitive to this particular weighting scheme; in fact, none of our results change qualitatively if we use no weighting at all.
2.2 Galaxy stellar populations
We have matched sample II with the catalogue of stellar ages and metallicities of SDSS galaxies by Gallazzi et al. (2005). For each galaxy, Gallazzi et al. (2005) determined the full probability density function (PDF) of stellar -band flux-weighted age and metallicity: the median of the PDF represents the fiducial estimate of the parameter, while the associated uncertainty is given by half of the 16th-84th percentile range of the PDF. The PDF of each parameter has been derived by comparing the observed strength of spectral absorption features with the predictions of a Monte Carlo library of 150000 star formation histories (SFHs), based on the Bruzual &Charlot (2003) population synthesis code and the Chabrier (2003) Initial Mass Function (IMF). The SFHs in the library are modelled by an exponentially declining star formation rate (SFR), with varying time of onset and timescale, to which random bursts of varying intensity and duration are superposed with a probability that allows 10% of models to experience a burst in the last 2 Gyr. The set of absorption features used to constrain the PDF includes the 4000Å-break and the Balmer lines as age-sensitive indices, and and as metal-sensitive indices.
The derived stellar ages and metallicity refer to the redshift at which the galaxies were observed. Given the (small) redshift range of the sample and the magnitude selection of the survey, this could potentially bias the relations as a function of stellar mass. However, we do not attempt to correct for this effect because it would require an accurate knowledge of the star formation history from the redshift of the observations to the present. Under the simplest assumption of passive evolution (which does not apply to the entire sample), the stellar ages could be all scaled to 0 by adding the look-back time. Such a correction would steepen the age - stellar mass relation.
The uncertainty on the derived stellar metallicity depends strongly on the spectral signal-to-noise (S/N). Specifically, a median S/N per pixel of at least 20 is required to constrain stellar metallicity within dex. Furthermore, at fixed S/N, the broadness of the metallicity PDF varies as a function of galaxy type, being larger for low mass, star-forming galaxies: these galaxies generally have lower metallicities and hence more difficult to measure Fe and Mg absorption features. The quality of the spectrum is a less stringent requirement for light-weighted age estimates, which have a typical uncertainty of dex with little dependence on galaxy type.
Note that the SDSS spectra have been aquired with a 3 arcsec-diameter fibre and thus sample preferentially the inner of the galaxy light distribution. This can affect estimates of global stellar age and metallicity, depending on the strength of stellar population gradients in galaxies. Gallazzi et al. (2005) did not detect any significant bias in age as a function of normalized redshift at fixed stellar mass, except for the most massive late-type galaxies. Similarly, they estimated that the measured metallicity of intermediate-mass bulge dominated galaxies would vary by dex if such a galaxy would be moved from one edge of the survey to the other. While we caution that individual stellar age and metallicity estimates may be biased because of stellar populations gradients, we have checked that the mean age/metallicity - mass relations discussed in this work are not affected by variations in the fibre covering factor (see Sect. 4).
Another source of systematic uncertainty is the variation in element abundance ratios. Although the stellar parameter estimates are based on absorption indices which are to first order insensitive to variations in /Fe, the stellar metallicity could be overestimated by no more than dex. For massive early-type galaxies, which are known to be -enhanced, the light-weighted ages can be underestimated by a similar amount (Gallazzi et al. 2005). Finally, the prior according to which starbursts are generated in the Monte Carlo library can also have an effect on the derived parameters. For example, by increasing the probability of having undergone a burst in the last 2 Gyr to 50% would result in ages that are younger by dex and metallicities that are higher by dex. Note, however, that this would mainly affect early-type galaxies dominated by old stellar populations. For more details and a more elaborate discussion of systematic effects we refer the reader to Gallazzi et al. (2005) and Gallazzi et al. (2008).
In this work we complement the luminosity-weighted ages with estimates of the mass-weighted age. For each model in the SFH library the mass-weighted age is computed by weighting each generation of stars by their mass, taking into account the fraction of mass returned to the interstellar medium by long-lived stars. The mass-weighted ages of observed galaxies is then estimated in the same way as the other parameters as described above (for more details see Gallazzi et al. 2008 where this quantity has been derived and used). Uncertainties on the two age estimates are comparable. While the luminosity-weighted age is more sensitive to small fractions of recent generations of stars (which contribute significantly in luminosity but not in mass), the mass-weighted age is more representative of the average epoch when the bulk of the stars in a galaxy formed. The mass-weighted age is always older than the luminosity-weighted age and their difference can give (at least qualitative) insight into the recent star formation history.
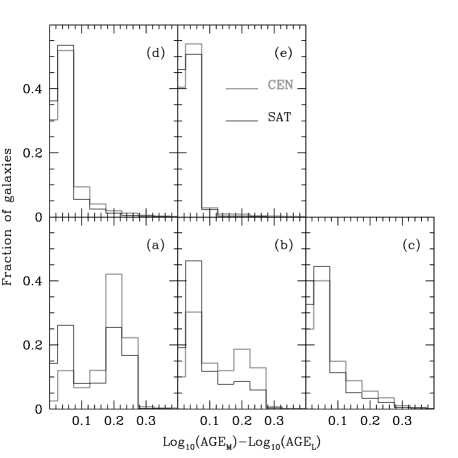
Fig. 1 shows the -weighted histograms of the difference between the mass-weighted and luminosity-weighted ages for centrals (grey) and satellites (black), in different bins of galaxy stellar mass. At high stellar masses (roughly above LogM10.5) the mass-weighted ages of both centrals and satellites are typically only dex older than their luminosity-weighted ages. At lower stellar masses, however, there is a more pronounced tail toward larger differences between mass-weighted and luminosity-weighted ages. A second peak at an age-difference of dex ( Gyr) is clearly visible in galaxies with M⊙. This peak is much more populated in the central galaxy population. This hints at a typically more prolongued SFH in low mass central galaxies with respect to satellite galaxies of the same stellar mass. We will return to this in §4.
3 Basic properties of the sample
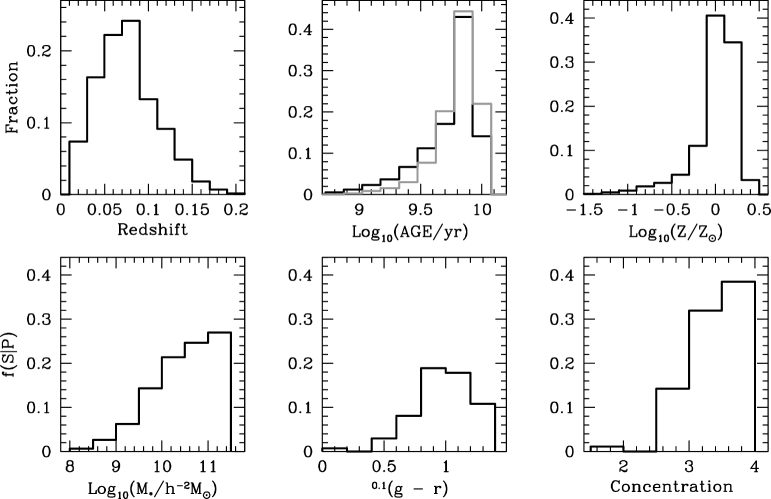
For our analysis we select galaxies in sample II with known age and metallicity and whose spectroscopic S/N per pixel is larger than 20. Such a cut in S/N effectively selects galaxies with a 1 error of dex on age and dex on stellar metallicity. These objects are hereafter referred to as the spectroscopic () sample, which contains a total of 70,067 galaxies, split between 56,441 centrals and 13,626 satellites. As shown in the upper panels of Fig. 2, the galaxies in sample span the redshift range 0.01 0.20 as set by the Y07 group catalogue. The distribution of their luminosity-weighted ages (in black) ranges from between 600 Myr to Gyr and peaks at 6 Gyr. The same is true for the mass-weighted ages (in grey), although they are shifted towards somewhat larger values. The distribution of stellar metallicities covers the interval -1.5 Log 0.5 and peaks at Solar metallicity.
In order to assess how representative the sample is of the full galaxy population in the Y07 groups, the bottom panels of Fig. 2 show , defined as the fraction of galaxies with properties (stellar mass, colour or concentration) that are present in sample :
| (1) |
Here is the weight of galaxy , is the number of galaxies in sample with properties and is the number of galaxies in sample II with properties . This shows that the requirement of a S/N per pixel of 20 or higher biases the sample towards massive, red, early-type galaxies. However, since the main goal of this paper is to compare the ages and metallicities of central galaxies to those of satellites, rather than study age and/or metallicity distributions, this bias will not have a signficant impact on our results.
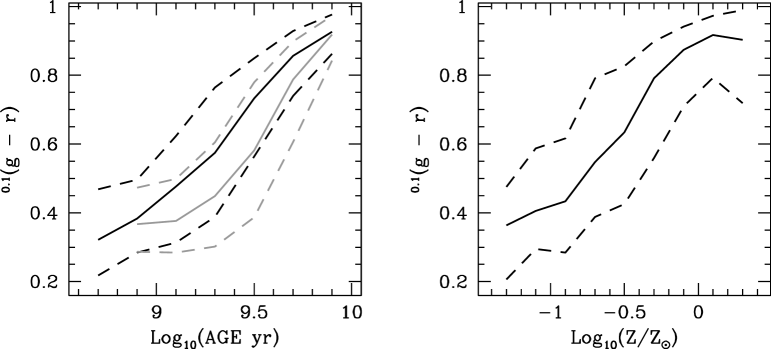
The solid lines in Fig. 3 show the average colour of galaxies in sample as function of both their age (left-hand panel; luminosity and mass-weighted ages in black and grey, respectively) and metallicity (right-hand panel). The dashed lines show the corresponding 16th and 84th percentiles of the colour distribution. This shows the well-know fact that redder galaxies are both older and more metal-rich, and emphasizes that studies of the colour dependence of galaxies as function of stellar mass and/or environment (as for example in Hogg et al. 2004; Blanton et al. 2004; Weinmann et al. 2006a; van den Bosch et al. 2008) cannot discriminate between age and metallicity effects. This highlights the main improvement of this paper with respect to aforementioned studies.
4 Ages and Metallicities of Centrals & Satellites
Since the main aim of this paper is to determine whether satellite and central galaxies differ in their stellar age and metallicity and how these differences depend on environment, we now split the galaxies in sample in centrals and satellites and analyse the distributions of their stellar ages (luminosity- and mass-weighted, and , respectively) and metallicities as a function of their stellar mass, , and halo mass, .
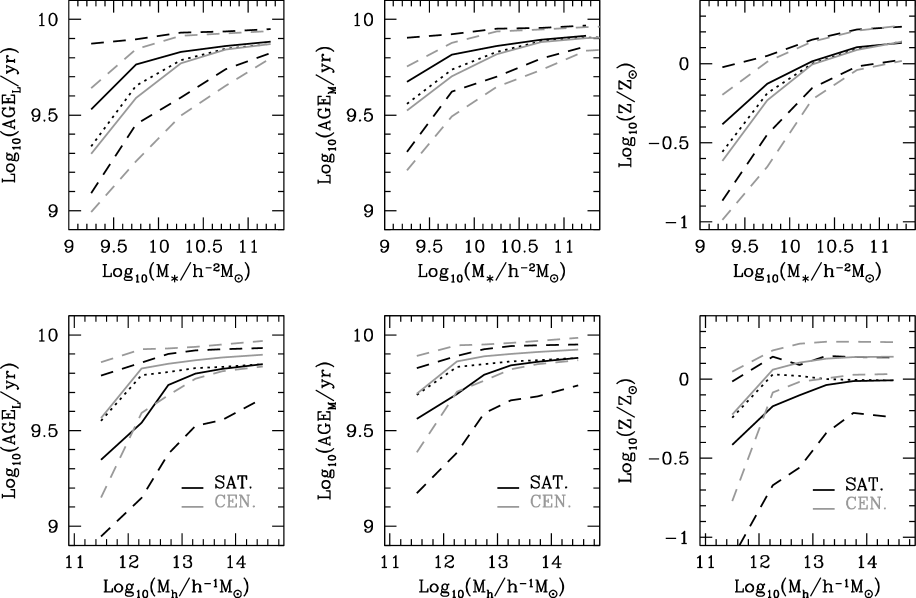
The top panels of Fig. 4 show the age- and metallicity-stellar mass relations for centrals and satellites, in grey and black respectively. As in Fig. 3, the solid and dashed lines indicate the median and the 16th and 84th percentiles of the age (metallicity) distributions, respectively. For comparison, the black, dotted line indicates the median age (metallicity) of all galaxies in sample (centrals and satellites combined). As already noted in Fig. 2, the mass-weighted age distributions are shifted to older ages by dex at LogM⊙) 10.5 but coincide with the luminosity-weighted age distributions at larger stellar masses.
To test the effects of aperture bias we have computed mean relations for centrals and satellites in narrow bins of the ratio between the fibre radius and the Petrosian half-light radius (). We find that for galaxies in which the age/metallicity–mass relations are somewhat steeper. These galaxies represent 31% and 28% of all centrals and satellites in the sample respectively, and do not dominate the global relations shown in Fig. 4. For those galaxies in which the fibre samples a higher fraction of the light (up to ) the relations at fixed agree well with the global relations shown in Fig. 4. We are thus confident that the shape of the relations is not significantly affected by aperture bias. This holds for both centrals and satellites separately.
From Fig.. 4 there is a clear indication that satellite galaxies have older stellar populations than centrals of the same stellar mass, and this age difference increases with decreasing stellar mass. At the massive end ( 10M⊙) satellites and centrals are equally old on average, while at the low mass end ( 3 10M⊙) the difference is Gyr (compared to a 1 scatter of Gyr). In absolute terms, the age differences are very similar when using luminosity-weighted or mass-weighted ages, suggesting that they are not merely due to differences in the recent (i.e. past 1-2 Gyrs) star formation history. In terms of metallicity, massive satellite galaxies have a similar metallicity as centrals of the same stellar mass. However, at the low mass end, the metallicity of satellites is higher than that of centrals (by dex at 10M⊙).
Comparing the 16th and 84th percentiles of the age distributions, one notices (i) that the age distribution of low mass satellites has an excess at old ages compared to the age distribution of low mass centrals, and (ii) a relative lack of young satellites compared to centrals at all stellar masses. Similar features are also present in the metallicity distributions, which show an excess of metal-rich satellites at 6 10M⊙ and a relative lack of metal-poor satellites at all stellar masses.
A comparison with the black dotted line shows that the median age (metallicity) of all galaxies in sample closely follows that of centrals. This simply reflects the fact that centrals are more numerous than satellites in any -bin.
The bottom panels of Fig. 4 show a similar comparison of the age- and metallicity-distributions of centrals vs. satellites, but now as function of halo mass rather than stellar mass. As is evident, in any given environment (i.e. halo mass), centrals are systematically older (by Gyr) and metal-richer (by dex) than satellites. The former is in excellent agreement with Bernardi (2009). These results, which hold for the median, the 16th and 84th percentiles of the age (metallicity) distributions, are most likely reflections of the age- and metallicity- relations, since, by definition, a central galaxy is more massive than its satellite galaxies.
A comparison of the lower and upper panels of Fig.4 shows that for central galaxies the dependence of stellar age and metallicity on halo mass is significantly weaker than that on stellar mass. In fact, the age and metallicity distributions of centrals are almost independent of halo mass for 10M⊙. In the case of satellite galaxies, the ages and metallicities of their stellar populations seem to depend on and with similar strength.
The black dotted curves in the lower panels of Fig.4 show that the median age and metallicity of all galaxies in sample (central and satellites combined) are almost independent of halo mass for 10M⊙. This is due to the fact that centrals outnumber satellites in halos less massive than LogM 13.5, while satellites constitute the numerical majority in more massive groups. These results are in good agreement with Sheth et al. (2006) and Ellison et al. (2009), who found that the gas-phase and stellar metallicities of galaxies are virtually independent of environment. Our results show that this lack of environment dependence is somewhat fortuitous, and that a more pronounced dependence of stellar age and metallicity on environment emerges when centrals and (especially) satellites are treated separately.
The results in Fig.4 show that the ages and metallicities of centrals and satellites scale with both halo mass and stellar mass. In order to make progress, and to determine which of these dependencies is causal, we need to investigate the halo mass dependence at fixed stellar mass and vice versa. Since there is relatively little scatter in the relation between and for centrals, there is not sufficient dynamic range to determine which of these two parameters causally controls the ages and/or metallicities of central galaxies (cf. Pasquali et al. 2009). However, in the case of satellite galaxies, the dynamic range of halo masses occupied by satellites of a given stellar mass can be large (especially for low mass systems), thus allowing for a detailed causality study (see e.g. van den Bosch et al. 2008b).
The solid, coloured lines in Fig.5 show the mean ages and metallicities of satellite galaxies as function of stellar mass for narrow bins in halo mass (left-hand panels), and as function of halo mass for narrow bins in stellar mass (right-hand panels). The errorbars indicate the errors on the mean, where each point contains at least 30 satellite galaxies. In each panel, the grey band depicts the range of ages/metallicities enclosed by the 16th and 84th percentiles of the corresponding distributions for centrals, with the black dotted line indicating the corresponding median.
A comparison of panels and shows that massive satellite galaxies () have luminosity weighted ages that are (i) comparable to those of central galaxies of the same mass, and (ii) virtually independent of the mass of the halo in which they reside. However, in the case of low mass satellites (), there is a clear dependence on halo mass, such that satellites in more massive halos have older stellar populations. This halo-mass dependence is most pronounced for the satellites in the lowest stellar mass bin probed here (), which have an average luminosity weighted age that increases from Gyr in halos with (very similar to that of central galaxies of the same stellar mass) to Gyr in massive clusters.
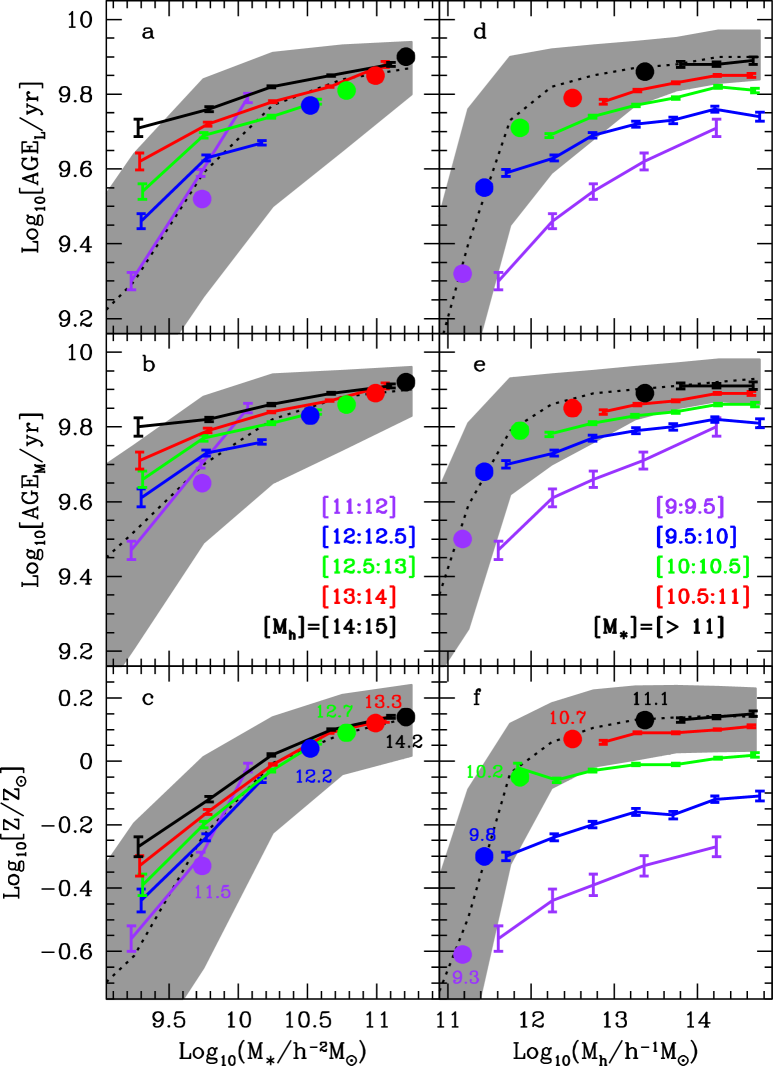
Panels and show similar results for the mass-weighted ages. Once again, massive satellites have stellar ages that are comparable to those of central galaxies of the same mass, and independent of halo mass (environment). In the case of low mass satellites, their stellar ages increase with the mass of the halo in which they reside; in the lowest stellar mass bin probed, we again find a difference of Gyr between the (mass-weighted) ages of satellites in halos with and those in massive clusters.
Analogous trends can be seen for the stellar metallicities, shown in panels and . Massive satellites with , which all reside in halos more massive than , have metallicities that are similar to centrals of the same stellar mass and independent of halo mass. The metallicities of satellites with , though, increase with the mass of the halo in which they reside. Similar as for the ages, this mass dependence becomes stronger for less massive satellites. In the case of satellites with , the mean stellar metallicity increases by almost 0.3 dex from in halos with (very similar to that of central galaxies of the same stellar mass) to in massive clusters.
We have tested the robustness of the results obtained so far by performing the same analysis on galaxy subsamples that are volume limited and complete in stellar mass (according to eq. [A8] in van den Bosch et al. 2008a). These tests confirm the trends seen in Fig.5. Also, the results of Figs. 4 and 5 do not change if (i) we use all galaxies for which ages and metallicities are available, irrespective of whether their spectra have a S/N per pixel larger than 20, or (ii) we use velocity dispersion (corrected for aperture) rather than stellar mass.
5 Comparison with semi-analytical model
The main results from the previous section are:
-
•
At fixed stellar mass, satellites are older and metal-richer than centrals, and the difference increases with decreasing .
-
•
The ages and metallicities of massive satellites are independent of their environment, while those of low mass satellites increase with increasing halo mass.
Clearly, these findings hold important clues to how galaxies form and evolve in different environments. In this section we compare the observational results with predictions of a semi-analytical model. This comparison serves two purposes. First of all, we want to investigate how well a state-of-the-art semi-analytical model, which fits many of the global properties of the galaxy population (stellar mass function, colour-magnitude relation, clustering properties), can reproduce the age- and metallicity-trends revealed here. Secondly, we want to use the model to gain insight into the physical processes that underlie these trends.
5.1 Model description
Semi-analytical models (hereafter SAMs) anchor galaxy formation to the large scale matter distribution as traced by dark matter halos and follows the evolution of their baryonic content using simplified, yet physically and/or observationally motivated prescriptions for the treatment of gas cooling, star formation, supernovae and AGN feedback, and galaxy mergers (see Baugh 2006 for a comprehensive review). In recent years, these models have become a widely used tool to predict statistical properties of galaxies to be compared with data from modern multi-wavelength surveys. Despite much encouraging success, a number of discrepancies still exist between SAM predictions and observational results. For example, it remains challenging to fit the faint-end slope of the galaxy luminosity function (e.g. Benson et al. 2003; Mo et al. 2005), and the models typically predict disk rotation velocities that are too high, unless adiabatic contraction and/or disk self-gravity are ignored (e.g. Cole et al. 2000; Dutton et al. 2007). In addition, SAMs have problems matching the evolution of the galaxy mass function with redshift (e.g.,De Lucia & Blaizot 2007; Somerville et al. 2008; Fontanot et al. 2009). Most relevant for this discussion, SAMs typically overpredict the red fraction of satellite galaxies (Baldry et al. 2006; Weinmann et al. 2006b; Kimm et al. 2009) as well as the stellar mass density in low-mass galaxies (Gallazzi et al. 2008). Comparing the observed distribution in stellar mass density as a function of age/metallicity with the one predicted by the Millenium Simulation, Gallazzi et al. (2008) found a clear deficit of young galaxies and a too narrow metallicity range in the simulation.
In this paper, we use results from the “Munich” semi-analytic model described in Wang et al. (2008, hereafter W08). This is essentially the same model as that discussed in De Lucia & Blaizot (2007), but adapted to a cosmology in better agreement with the third-year data release of the WMAP mission (Spergel et al. 2007). This model has been used extensively in a number of recent studies and has been shown to provide nice agreement with various observational measurements, both in the local Universe and at higher redshift. For more details on the physical modelling of the various processes considered, we refer to the original paper and references therein. Here, we briefly summarize those modelling details that are relevant for this study.
The model we use follows dark matter substructures, which allows us to follow the motion of the galaxies sitting at their centers until tidal truncation and stripping disrupt the subhalos at the resolution limit of the simulation. When this happens, a “residual merging time” is estimated from the current orbit and the classical dynamical friction formula (see De Lucia & Blaizot 2007 for details). The positions and velocities of “orphan” galaxies (those that are no longer associated with a distinct subhalo) are estimated following the most bound particle of the parent dark matter substructure at the last time it was identified. The galaxy associated with a main halo is defined as central, while all others are labelled satellites regardless of whether they are still associated with a subhalo (in the simulation) or they are orphans. When a central galaxy becomes a satellite, its reservoir of hot gas is assumed to be instantaneously stripped and added to the hot component associated with the central galaxy. It has already been noted that this produces a rapid decline of the star formation activity and reddening of the stellar population (Weinmann et al. 2006b; see also Fontanot et al. 2009). Like most of the semi-analytical models published to date, this model adopts the instantaneous recycling approximation for chemical evolution. Upon their synthesis, metals are instantaneously returned to the cold gas with a 100% mixing efficiency. Finally, the model also tracks the formation of supermassive black holes. It differentiates between a merger-induced “quasar-mode”, during which the black hole (the merged product of the black holes in the progenitor galaxies) accretes a certain fraction of the cold gas present in the progenitor galaxies, and the “radio-mode”, during which the black hole accretes hot gas. It is assumed that this “radio-mode” accretion results in energy feedback into the surrounding medium which reduces or stops the cooling flow (AGN feedback). Note, though, that the model does not incorporate any direct feedback (hydrodynamical or radiative) from the “quasar-mode” accretion (see Croton et al. 2006 for details).
The model uses the stellar population synthesis code of Bruzual & Charlot (2003) with the Chabrier IMF to predict observables such as luminosities and colours in several filters, and also accounts for dust extinction. However, the modelling of these additional ingredients (especially dust) introduces further degrees of freedom and uncertainties (see e.g. Fontanot et al. 2009b). For these reasons, we prefer to limit the comparison between models and data to metallicities and mass-weighted stellar ages. It should be noted, however, that while these are direct outputs of the semi-analytic model, these need to be estimated from observables in the case of the data.
5.2 Model predictions
The galaxy population simulated by W08 spans the same ranges in stellar mass and halo mass as the observational sample analyzed here, and consists of 62,075 centrals and 40,372 satellites. However, as discussed in §3, our observational sample suffers from a bias that originates from the fact that only galaxies whose spectrum has a sufficiently high signal-to-noise can be used to determine their age and/or metallicity. As shown in Fig. 2, this results in a bias towards massive, red, early-type galaxies. In order to impose a similar bias onto the W08 results, we proceed as follows. Using the complete sample II described in §3 we determine the fraction of galaxies in sample II that are in our sample, as function of both stellar mass and colour. Next we accept each W08 model galaxy with a probability equal to . Although this results in removing a very significant fraction of the model galaxies (our final sample consists of 11296 centrals and 7053 satellites), at least the final sample of model galaxies is biased in a similar way as the real data, thus allowing for a more meaningful comparison222We have verified, though, that not applying this bias correction yields results that are very similar, both qualitatively and quantitatively..
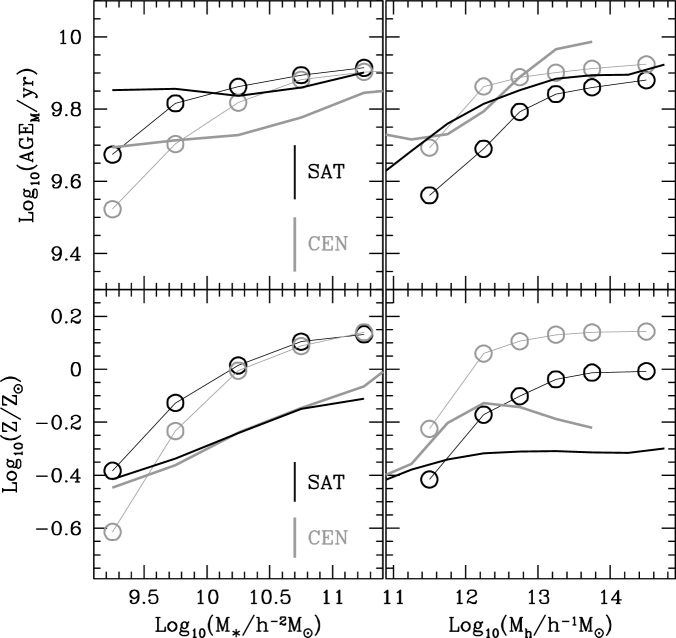
Fig. 6 shows the average metallicity and mass-weighted stellar ages of the W08 model galaxies as functions of stellar and halo mass, with central and satellite galaxies in grey and black, respectively. The vertical bars in the left-hand panels indicate the typical scatter in the model. For comparison, the grey and black open circles indicate the observed values for centrals and satellites in our sample , respectively (cf. Fig. 4). For both observations and model, the typical error on the mean is smaller than a circle. The upper left-hand panel shows that the model overpredicts the stellar ages at the low mass end, while underpredicting the ages of massive centrals. A particular problem for the model seems to be the fact that it fails to reproduce the steepening of the age-stellar mass relation at the low mass end. We note that the mass-weighted age derived from a galaxy spectrum is still somewhat weighted by light, hence biased by the younger stellar populations in the galaxy. This could partly alleviate the discrepancy with the model. Nevertheless, the model yields satellites with stellar populations that are older than those of centrals of the same stellar mass. The age difference increases from Gyr at the massive end to Gyr at , in good agreement with the data. However, at intermediate masses (), the model somewhat overpredicts the age difference.
The upper right-hand panel of Fig. 6 shows that in the W08 model central galaxies in massive halos () are Gyr older than their satellites. Although in qualitative agreement with the data, the central galaxies in massive halos are too old in the model compared to the data (by Gyr). In addition, the model predicts that centrals and satellites in low mass halos () are equally old, in disagreement with the data, which shows that centrals are older than their satellites at all probed333The lack of centrals in bins of is artificial, and due to the colour and stellar mass bias applied to the model in Sect. 5.2..
Concerning stellar metallicities, the W08 model predicts that satellite galaxies have, on average, the same metallicity as centrals of the same stellar mass against the observed trend that satellites become more metal-rich than centrals at the low mass end. The model does reproduce the fact that centrals are more metal rich than satellites for the same halo mass, and by roughly the correct amount ( dex), but the model clearly underpredicts the stellar metallicities at the massive end by about 0.2 dex, which is more than twice the scatter in the model.
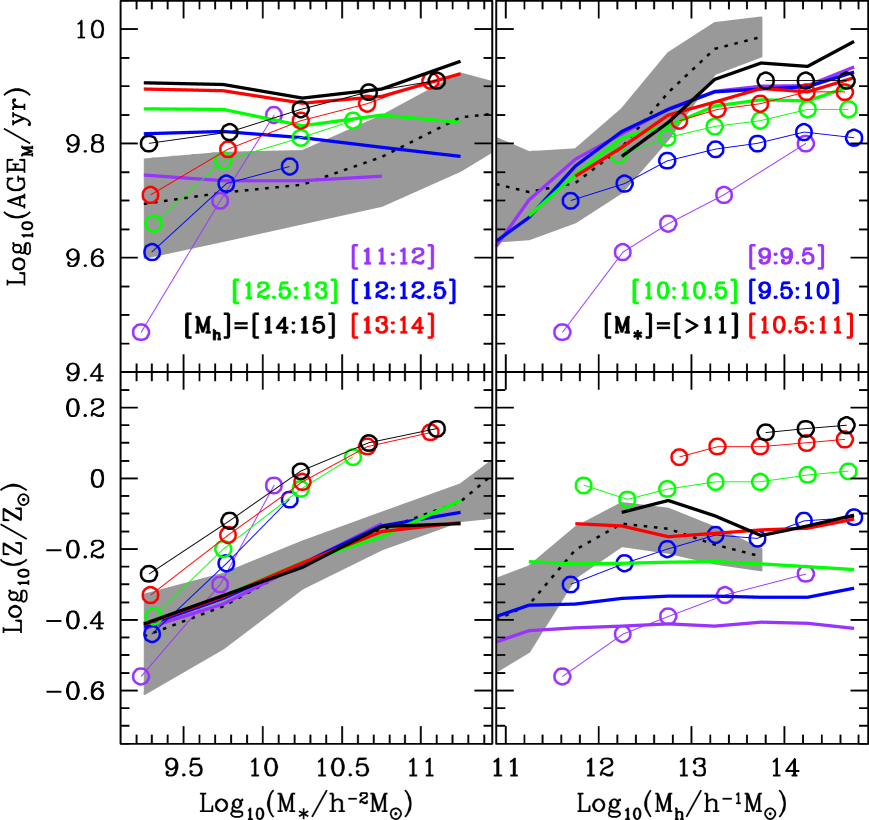
We now investigate what the W08 model predicts in terms of the stellar ages and metallicities as functions of stellar mass at fixed halo mass, and as functions of halo mass at fixed stellar mass. Fig. 7 is similar to Fig. 5, except that it now shows the W08 model predictions, and only for the mass-weighted ages and metallicities (as explained above, we do not consider the model predictions for the luminosity weighted ages). The dotted black line and the grey band correspond to the distributions of model centrals (basically the same as in Fig. 6). The coloured thick lines represent the average mass-weighted age (metallicity) of model satellites as a function of stellar mass per bin of halo mass (left-hand plots), and as a function of halo mass per bin of stellar mass (right-hand panels). For comparison, we have superimposed the data using open circles (cf. Fig. 5, panels b, c, e, and f).
The comparison of model and data in Fig. 7 reveals two additional aspects in which the model does not reproduce the data. First of all, the upper two panels show that the mass-weighted ages of model satellites are virtually independent of stellar mass, but strongly dependent on halo mass (with more massive halos hosting older satellites). For massive satellites this is clearly in disagreement with the data, which shows the opposite trend. For low mass satellites the model and data agree in that the ages increase with halo mass, although the model predicts a smaller age difference between the lowest and highest -bins. Furthermore, the model overpredicts the ages of low mass satellites in low mass halos by Gyr.
The second important shortcoming of the model is that it does not reproduce the halo-mass dependence of the metallicities of low mass satellites. The model predicts that satellite galaxies have metallicities that depend on stellar mass (albeit with a slope that is clearly too shallow), and are independent of the mass of the halo in which they reside. The data, however, clearly show that the metallicity of low mass satellites () increases with increasing halo mass.
To summarize, the semi-analytical model of W08 yields relative ages and metallicities of centrals and satellites that roughly capture the observed trends at the massive end. However, the model does not reproduce several other aspects of the data presented here. In particular, the model
-
(i)
predicts an age-stellar mass relation that is much too shallow at the low mass end,
-
(ii)
predicts that satellite galaxies in low mass halos have the same average, mass-weighted age as their centrals, in clear contradiction with the data,
-
(iii)
yields metallicities at the massive end that are dex too low, for both centrals and satellites,
-
(iv)
predicts that centrals have the same metallicities as satellites of the same stellar mass, in disagreement with the data at the low mass end,
-
(v)
predicts that satellites have mass-weighted ages that are independent of stellar mass, but strongly dependent on halo mass, in striking contrast to the data,
-
(vi)
fails to reproduce the halo mass dependence of the metallicity of low mass satellites.
5.3 The Evolutionary Paths of Centrals and Satellites
In order to gain insight as to what might solve the problems listed above, we first use the semi-analytical model of W08 to investigate the differences in the evolutionary paths of centrals and satellites.
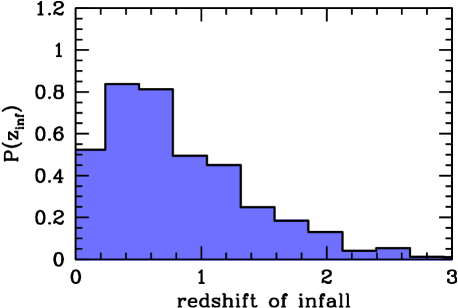
For this purpose we proceed as follows. For each model satellite galaxy at , we identify the redshift, , at which it first became a satellite. The distribution of these ‘redshifts of infall’ is shown in Fig. 8. Next we find a model galaxy that remains a central at , and that at has the same stellar mass, metallicity and mass-weighted age as the satellite at that redshift using the criteria: Log 0.1, Log 0.1 and Log 0.2. These limits reflect the typical uncertainty in estimating galaxy properties from SDSS data.
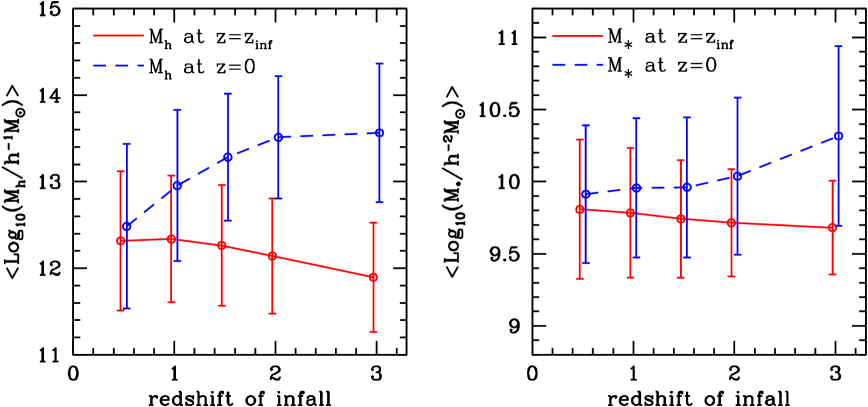
The solid line in the left-hand panel of Fig. 9 shows the average halo mass of a satellite galaxy in this sample at its time of infall as a function of . There is a weak trend that this halo mass increases with decreasing redshift, which mainly reflects the evolution of the halo mass function (the average halo mass increases with time). However, within the scatter, indicated by the errorbars, this trend is extremely weak. Thus, the typical mass of the halo in which a satellite is accreted is virtually independent of the time of accretion. However, the subsequent merger history of their host halos is such that satellites with a higher are presently located in more massive halos, on average. This is indicated by the dashed line, which shows the average satellite’s halo mass at the present (). Clearly, satellites that were accreted earlier (i.e. that became a satellite earlier) currently reside in more massive halos, on average. The right-hand panel of Fig. 9 is similar, except that it shows the average stellar masses of the satellites, rather than their halo masses. There is no significant dependence on , neither for the stellar mass of the satellite at infall, nor for its present-day stellar mass. Note, though, that the average stellar masses at the present are always somewhat higher than those at , indicating that satellite galaxies have continued to grow somewhat in stellar mass since infall (at least in the W08 model considered here).
Fig. 10 shows the difference in stellar mass (upper panel), mass-weighted age (middle panel) and metallicity (lower panel) between and the present day as a function of for satellites (solid red lines) and centrals (dashed blue lines). Errorbars reflect the scatter. As expected, the growth in stellar mass, the increase in metallicity, and the aging of stellar populations are all larger for higher . More importantly, this change is more pronounced for central galaxies than for their paired satellites. This is due to the way satellite galaxies are treated in the semi-analytical model: once a galaxy becomes a satellite, it is instantaneously stripped of its hot gas reservoir. Consequently, its star formation is rapidly quenched (how rapid depends on its star formation rate, its cold gas reservoir, and the strength of supernova feedback, which can expell the cold gas before it has a chance to form stars). Without further star formation, the stellar mass and metallicity can no longer increase, and the stellar population ages passively. Galaxies that continue to be centrals, continue to accrete new gas (unless some mechanism is invoked to prevent this, such as AGN feedback). Hence, they continue to grow in mass, continue to chemically enrich themselves (unless feedback preferentially expells metals, as suggested, for example, by the simulations of MacLow & Ferrara 1999), and maintain relatively young (luminosity-weighted) ages. The top panels of Fig. 10 nicely confirm this picture; present-day satellite galaxies have, to good approximation (and certainly within the scatter), the same stellar mass and metallicity as they had at their time of infall (at ). There is a trend that satellite galaxies with a higher have managed to grow more in stellar mass and metallicity than satellites with a lower redshift of infall. This mainly owes to the fact that satellite galaxies continue to form stars until their cold gas reservoir is exhausted, combined with the fact that galaxies at higher redshifts have larger cold gas mass fractions. However, since the W08 model does not include ram-pressure stripping, most likely real satellite galaxies experience even less growth and enrichment after infall. This, combined with the fact that only a very small fraction of all present-day satellites have (see Fig. 8), implies that it is reasonable to postulate that satellite galaxies have not grown significantly in stellar mass since their time of infall.
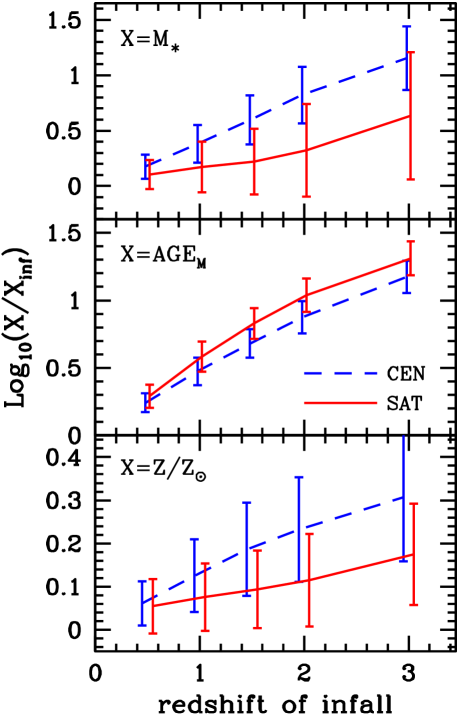
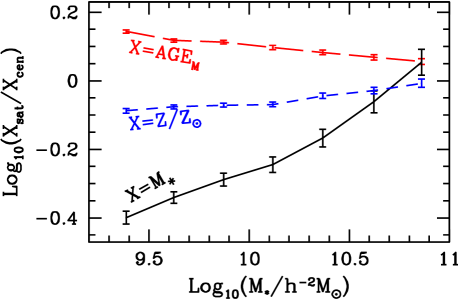
Fig. 11 plots the difference in present-day stellar mass, mass-weighted age and metallicity between satellite galaxies and their paired centrals as a function of the present day stellar mass of the satellites. Clearly, the differences between satellites and paired centrals become larger for smaller . In particular, present-day low mass satellites are less massive than their paired centrals by as much as 0.4 dex, metal-poorer by dex, and older by 0.15 dex. At the massive end, however, satellites have stellar masses, ages and metallicities that are very similar to those of their paired centrals444Actually, satellites with appear to be more massive than their paired centrals; this is due to the exponential tail of the stellar mass function which causes a random central galaxy to have a stellar mass that is almost always smaller than that of its paired satellite, but still within 0.1 dex by construction.. Since there is little to no correlation between and stellar mass (see Fig. 9), this is not due to satellite quenching. Rather, this trend is a consequence of AGN feedback; massive centrals are quenched due to the action of AGN feedback. The implementation of ‘radio-mode’ AGN feedback is such that it only becomes effective for central galaxies in sufficiently massive halos. Hence, more massive centrals, which reside in more massive halos, are quenched earlier. If a central galaxy that is paired to a satellite is already quenched at (or will be quenched soon thereafter), their stellar masses, metallicities and ages at the present day will be similar. Low mass centrals have not (yet) been quenched, so that they continue to form stars to the present day, causing them to be younger, more massive and more metal-rich than their paired satellites.
6 Discussion
The discussion in the previous section highlights that the relative evolution of centrals and satellites in the semi-analytical model of W08 is governed by two quenching mechanisms: AGN feedback, which only operates on massive centrals, and strangulation, which operates, with equal efficiency, on all satellites. Because of the way these processes are treated in the model, the differences between centrals and satellites depend on stellar mass, and on the redshift of accretion, . Since present-day satellites in more massive halos were, on average, accreted earlier, this also introduces a dependence on halo mass. Equipped with these insights, we now discuss which modifications to the semi-analytical model may be required in order to achieve better agreement with the data.
6.1 Stellar Ages of Central Galaxies
We start by focussing on the (mass-weighted) stellar ages of central galaxies. Here the W08 model reveals several problems: it predicts an age-stellar mass relation that is too shallow, causing the model centrals to have mass-weighted ages that are older at the low mass end, and younger at the massive end. In addition, the model predicts ages for centrals in massive halos that are older. At first sight, since massive halos host massive centrals, these two problems seem to be inconsistent with each other: how can massive centrals be younger, on average, but centrals in massive halos older? The answer to this paradox comes from the fact that the average relation between stellar mass and halo mass of central galaxies becomes very shallow at the high mass end (see e.g., Yang, Mo & van den Bosch 2009a). Consequently, there is a large amount of scatter in halo mass for a given stellar mass, but relatively little scatter in stellar mass at a given halo mass (see More et al. 2009). In massive halos () all centrals are massive. They are also old, because of the implementation of AGN feedback, which effectively shuts off any star formation in central galaxies in halos above a characteristic mass of . Because of the shallow slope of the relation, and because the halo mass function is exponentially suppressed at the massive end, most massive centrals with still reside in halos in which AGN feedback has not yet kicked in. Our results show that their ages are younger compared to the data. This suggests that the problem with the ages of massive centrals may be a reflection of the current implementation of AGN feedback not being adequate. The data seem to require a model in which the onset of AGN feedback has a more gentle dependence on halo mass and/or stellar mass (see also Tinker & Wetzel 2009). Furthermore, the fact that the stellar ages of centrals in massive halos are too old compared to the data, probably suggests that AGN feedback is not as efficient as implemented in the W08 model.
The fact that the W08 model overpredicts the stellar ages of low-mass centrals suggests that it yields star formation efficiencies in low mass halos that are too high at high redshift (see also Fontanot et al. 2009a). A similar conclusion is reached by Liu et al. (2009), based on a comparison of different SAMs with data from the same SDSS galaxy group catalogue as used here. The main mechanism in SAMs invoked to regulate the star formation efficiency in low mass halos is supernova (SN) feedback, suggesting that a modification of this feedback mechanism could be required. Alternatively, one can reduce the amount of star formation in low mass halos by postulating that the high-redshift intergalactic medium has somehow been preheated (e.g. Mo & Mao 2002).
6.2 Stellar Ages of Satellite Galaxies
As is evident from Figs. 6 and 7, the stellar ages of massive satellite galaxies in massive halos are in good agreement with the data. However, the model overpredicts the ages of low mass satellites and those of satellites in low mass halos. Most likely this is a reflection of a related problem with semi-analytical models, namely that they tend to overpredict the red fraction of satellite galaxies (e.g. Weinmann et al. 2006b; Baldry et al. 2006; Kimm et al. 2009). This has become known as the ‘over-quenching’ problem, and is believed to be due to an oversimplified treatment of strangulation: whenever a galaxy becomes a satellite galaxy, its reservoir of hot gas is assumed to be instantaneously stripped and added to the hot component associated with the central galaxy. Consequently, star formation in the satellite is quenched shortly thereafter, once it has consumed (or expelled) its remaining cold gas. However, detailed analytical and hydrodynamical simulations have shown that the typical timescale for this stripping process ranges from to 10 Gyr (e.g., Bekki, Couch & Shioya 2002; McCarthy et al. 2008), and it has been shown that by descreasing the efficiency with which hot gas is stripped from satellites, one can obtain red satellite fractions in much better agreement with the data (Kang & van den Bosch 2008; Font et al. 2008; Weinmann et al. 2009).
Most likely, this will also solve the problem that the stellar age-halo mass relation of the satellite galaxies in the W08 model is shallow than for the data (upper right-hand panel of Fig. 6). This is due to the relation between infall time and present day halo mass discussed in §5.3. On average, satellites in massive halos already became a satellite many Gyrs ago. As long as the quenching timescale is small compared to the time since infall, a modification thereof will have little impact on the stellar ages. Satellites in low mass halos were accreted more recently, on average, and their ages will therefore be more sensitive to a modification of the quenching timescale. Hence, increasing the quenching timescale will steepen the stellar age-halo mass relation of satellite galaxies, bringing it in better agreement with the data.
Note, though, that not all problems with the ages of satellite galaxies are a reflection of the over-quenching problem. In particular, the fact that the model does not reproduce a stellar mass dependence of the ages of satellite galaxies (upper left-hand panel of Fig. 6) is most likely a reflection of the fact that the model does not reproduce the stellar mass dependence of the ages of central galaxies. Since satellite galaxies were central galaxies before they were accreted, it is clear that a correct reproduction of the ages of satellite galaxies also requires the ages of central galaxies to be correct.
6.3 Metallicities of Central Galaxies
The W08 model predicts a metallicity-stellar mass relation for central galaxies that is clearly shallower than observed, resulting in the metallicities of massive centrals being underestimated by dex. As shown in Bertone et al. (2007), the SAM of De Lucia & Blaizot (2007) suffers from exactly the same problem.
One possibility is that this problem signals inadequate modelling of SN feedback. Indeed, numerous studies have shown that the mass-metallicity relation of (central) galaxies is highly dependent on the exact treatment of SN feedback (e.g, Dekel & Woo 2003; Oppenheimer & Davé 2006; Bertone, De Lucia & Thomas 2007; Brooks et al. 2007; Finlator & Davé 2008; Dutton & van den Bosch 2009). Possible modifications include, among others, a more dynamic treatment of SN feedback (i.e., Gerritsen 1997; Monaco 2004; Bertone, Stoehr & White 2005; Stinson et al. 2006), or considering momentum-driven winds rather than energy-driven winds (e.g., Murray, Quatert & Thompson 2005). For example, Bertone et al. (2007) have shown that incorporating the ‘dynamical’ SN feedback model of Bertone et al. (2005) in the SAM of De Lucia & Blaizot (2007) yields a stellar mass function and stellar metallicities in much better agreement with the data. Furthermore, as already mentioned above, a modification of the treatment of SN feedback may also be required in order to solve the problem that the ages of low mass galaxies are too old.
It may also be possible to change the (stellar) metallicities of the model galaxies by modifying the way metals returned to the ISM via stellar winds and supernova are distributed over the cold gas in the disk, the hot gas in the halo, and the galactic wind. In the W08 model all metals are simply deposited in the cold gas in the disk (see e.g., De Lucia et al. 2004; Croton et al. 2006). However, using hydrodynamical simulations, MacLow & Ferrara (1999) have shown that metals from the SN ejecta are far more easily ejected from a galaxy than the gas (i.e., galactic outflows are predicted to be strongly metal-enhanced with respect to the galaxy’s ISM). This is particularly true for low mass galaxies, i.e. 109 , where SN explosions can eject 70% of the SN metals, thus preventing the cold gas and the next generation of stars from increasing their metallicity by 0.2 dex. This “missed” metal enrichment is consistent with the difference in stellar metallicity between centrals and satellites at (see Figg. 4 and 5).
A somewhat more speculative alternative to modifying the prescription for feedback is to consider an IMF that varies with redshift (e.g. Larson 2005), with metallicity (e.g., Santoro & Shull 2006), or with the star formation rate (e.g., Köppen, Weidner & Kroupa 2007). Making the IMF more top-heavy results in a higher yield, and thus will effect the stellar metallicities.
Hence, there are a number of ways in which the SAM of W08 may be modified so as to yield a metallicity-stellar mass relation for central galaxies in better agreement with the data.
6.4 Metallicities of Satellite Galaxies
Of the six problems listed at the end of §5.2, three involve the metallicities of satellite galaxies: problems (iii), (iv), and (vi). Since satellite galaxies were central galaxies before they were accreted, they basically inherit the metallicity problems for centrals mentioned above. Hence, the fact that the W08 model severely underpredicts the stellar metallicities of massive satellites [problem (iii)], is simply a consequence of the fact that the model severely underpredicts the stellar metallicities of massive centrals. However, the other two problems are more satellite-specific: the failure of the model to reproduce the fact that low mass satellites have higher metallicities than central galaxies of the same stellar mass [problem (iv)], and the failure to reproduce the halo mass dependence of the metallicities of low mass satellites [problem (vi)].
The metallicity of a satellite galaxy is not expected to change significantly once its star formation is quenched. This is confirmed by the lower panel of Fig. 10, which shows that the present day metallicity of a satellite galaxy is still very similar to that at infall (at least for the vast majority of satellites with ). This suggests two possible scenarios for solving problems (iv) and (vi) which we now discuss in turn.
6.4.1 Redshift evolution
As we have seen in §5.3, satellites in more massive halos, on average were accreted earlier (i.e., became a satellite at a higher redshift). If indeed stellar metallicities evolve little after being accreted, the observed halo mass dependence of the metallicities of (low mass) satellite galaxies may simply be a reflection of evolution in the metallicity-stellar mass relation of (low mass) centrals. Qualitatively, what is needed is a metallicity-stellar mass relation whose zero-point decreases as function of time (i.e., high redshift galaxies need to have a higher metallicity than low redshift galaxies of the same stellar mass).
Observations of the gas-phase metallicity-stellar mass relation as function of redshift, however, all seem to indicate that the zero-point increases as function of time (e.g. Shapley et al. 2005; Savaglio et al. 2005; Erb et al. 2006; Maiolino et al. 2008). Furthermore, using the spectra of SDSS galaxies, Panter et al. (2008) find that also the stellar metallicities increase as function of time (by more than a decade since for galaxies with ). And finally, an increase in the zero-point of the metallicity-mass relation with time is also supported by hydrodynamical simulations of galaxy formation (e.g., Brooks et al. 2007). Hence, we conclude that the observed halo mass dependence of the metallicities of (low mass) satellite galaxies is not a consequence of redshift-evolution in the metallicity-stellar mass relation.
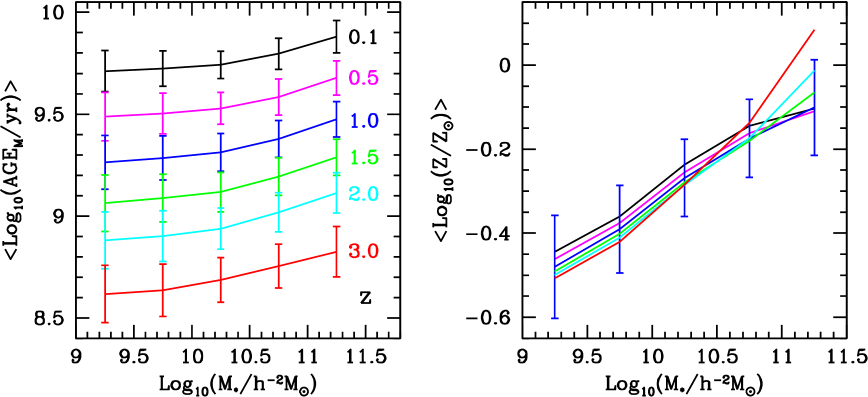
Fig. 12 shows how the age-stellar mass (left-hand panel) and metallicity-stellar mass (right-hand panel) relations of central galaxies evolve in the W08 model. The age-stellar mass relation shows a very pronounced evolution of its zero-point (but not of its slope), in that galaxies have younger stellar populations at higher redshift, as expected. The metallicity-stellar mass relation, however, shows only very little evolution, and this why the W08 model reveals no halo mass dependence in the metallicities of satellites.
6.4.2 Tidal stripping
A satellite galaxy and its dark matter subhalo are subjected to tidal forces that cause mass loss. Initially, tidal stripping will only remove the least-bound, outer regions of the dark matter subhalo. However, as the satellite continues to lose orbital momentum due to dynamical friction, and slowly sinks deeper and deeper into the host halo’s potential well, the tidal forces become stronger and may ultimately cause the stellar component to experience mass loss as well. Since more massive galaxies have higher metallicity, this may cause satellite galaxies to end up having a metallicity that is ‘too high’ for their present day (remaining) stellar mass. This would explain why satellite galaxies have a higher metallicity than central galaxies of the same stellar mass.
The data shows that the magnitude of this difference decreases as a function of stellar mass (upper right-hand panel of Fig. 4). One possible explanation could be that more massive satellite galaxies experience less mass loss. However, we consider this unlikely, given that more massive satellite galaxies experience stronger dynamical friction, which causes them to sink faster, and thus to be subjected to stronger tidal forces. A more natural explanation is that the stellar mass dependence of the metallicity difference is simply a consequence of the shape of the metallicity-stellar mass relation of central galaxies. Since
| (2) |
with the amount of stellar mass lost by the satellite, it is clear that the corresponding metallicity difference depends on the slope of the metallicity-stellar mass relation. Since the slope of the metallicity-stellar mass relation of central galaxies becomes extremely small at the massive end, even a large fractional mass loss results only in a tiny difference in metallicity between central and satellite. Furthermore, since satellite galaxies in more massive halos were accreted (i.e., became satellites) at an earlier time (see §5.3), they have been subjected to tidal stripping induced mass loss for a longer period. Consequently, satellite galaxies in more massive halos should have a higher metallicity than satellite galaxies of the same present-day mass in less massive halos, in qualitative agreement with the results shown in the lower right-hand panel of Fig. 5.
Hence, tidal stripping seems to give a fairly natural explanation for both the stellar mass and the halo mass dependence of the metallicity difference between centrals and satellites, at least qualitatively. Quantitatively, we can use Eq. (2) to estimate how much stellar mass the average satellite galaxy must have lost in order to explain the observed trend. The upper right-hand panel of Fig. 4 shows that satellite galaxies with a present-day stellar mass of have an average metallicity that is dex higher than that of a central of the same stellar mass. Using the slope of the metallicity-stellar mass relation for centrals, this implies an average fractional mass loss of 50 percent! Note, though, that this is only an underestimate. After all, by using the present-day metallicity-stellar mass relation to estimate the stellar mass of the satellite at infall (i.e., shortly before it started experiencing mass loss), we are ignoring possible redshift evolution. As discusssed above, observations suggest that high redshift galaxies have lower metallicities than low redshift galaxies of the same stellar mass. This implies that the metallicity of a present-day satellite galaxy indicates an even larger stellar mass at infall, and thus more stellar mass loss. It remains to be seen whether such large fractional mass losses are realistic; it is expected that once a (satellite) galaxy has lost a substantial fraction of its original stellar mass due to tidal heating and stripping, it becomes completely unbound (i.e., it is tidally disrupted). In fact, numerous studies in recent years have argued that reconciling halo occupation statistics with halo merger rates requires that a significant fraction of satellite galaxies is indeed tidally disrupted (e.g., Conroy, Ho & White 2007; Conroy, Wechsler & Kravtsov 2007; Kang & van den Bosch 2008; Yang, Mo & van den Bosch, 2009b).
As is the case for almost all semi-analytical models presented to date, the W08 model does not include a prescription for tidal stripping of satellite galaxies. Although it is tempting to identify this as the reason for the model’s failure to reproduce the observed halo mass dependence of the metallicities of (low mass) satellite galaxies, it remains to be seen whether a proper treatment of tidal stripping, heating, and disruption, such as for example in Benson et al. (2002), yields metallicities for satellite galaxies in better agreement with observations. In particular, it may be challenging to reconcile the relatively high disruption rates required to explain halo occupation statistics with the number of surviving, but heavily stripped, satellites required to fit the metallicity data presented here.
7 Conclusions
We have combined the SDSS DR4 group catalogue of Yang et al. (2007) with the catalogue of stellar ages and metallicities of SDSS galaxies of Gallazzi et al. (2005) in order to study how the stellar ages and metallicities of central and satellite galaxies depend on stellar mass (the ‘nature’ parameter) and halo mass (the ‘nurture’ or ‘environment’ parameter).
Our findings can be summarized as follows:
-
•
On average, satellite galaxies are older and metal-richer than central galaxies of the same stellar mass. This difference decreases with increasing stellar mass, becoming negligble for . At the average age and metallicity differences are Gyr and dex, respectively.
-
•
In absolute terms, the age differences between centrals and satellites are very similar when using luminosity-weighted or mass-weighted ages, indicating that they originate from differences in the integrated star formation histories.
-
•
On average, central galaxies are older (by Gyr) and metal-richer (by dex) than satellite galaxies residing in a halo of the same mass. Since central galaxies are more massive than satellite galaxies in the same halo, these differences simply reflect the relations between age/metallicity and stellar mass. Somewhat fortuitously, the average ages and metallicities of all galaxies (not distinguished between centrals and satellites) reveals no dependence on halo mass for , in agreement with the studies of Sheth et al. (2006), Bernardi (2009) and Ellison et al. (2009).
-
•
A study of the ages and metallicities of satellite galaxies as functions of stellar mass at fixed halo mass, and as functions of halo mass at fixed stellar mass, reveals that the age and metallicity differences between centrals and satellites are largest for low mass satellites in massive environments. In particular, the average age and metallicity of low mass satellite galaxies () increase with the mass of the halo in which they reside. For more massive satellites, both age and stellar metallicity are basically independent of environment (halo mass), but strongly dependent on stellar mass. Because of these effects, the slopes of the age-stellar mass and metallicity-stellar mass relations become shallower in denser environments (more massive halos).
In order to gain understanding of the physical origin of these trends, we have compared our results with predictions of the semi-analytical model (SAM) of Wang et al. (2008). This model predicts global galaxy properties in good overall agreement with observations, both in the local Universe and at higher redshift. In particular, it yields stellar mass functions, two-point galaxy-galaxy correlation functions, pairwise velocity dispersions, and a cosmic star formation history that are all in very satisfactory agreement with the data. However, a comparison with the ages and metallicities presented here reveals a number of important shortcomings.
Although the model predicts that satellite galaxies have older stellar populations than central galaxies of the same stellar mass, in qualitative agreement with the data, it yields metallicities that are dex lower at the high mass end, and an age-stellar mass relation that is too shallow. In addition, it fails to reproduce the halo mass dependence of the metallicities of low mass satellites, and predicts that centrals have the same metallicities as satellites of the same stellar mass. We have also compared the data presented here to the semi-analytical model MORGANA (Fontanot 2009a,b), and found similar discrepancies between model and data as for the W08 model. Given that the W08 model is very similar to those used in Kang et al. (2005), Kang, Jing & Silk (2006), Croton et al. (2006), De Lucia et al. (2006, 2007) and De Lucia & Blaizot (2007), we believe that the discrepancies found in this paper are relatively generic for the concurrent generation of semi-analytical models.
We have argued that the above mentioned discrepancies of the SAM indicate the need to modify the implementations of both supernova feedback (used to suppress and regulate star formation in low mass halos) and AGN feedback (used to quench star formation of central galaxies in massive halos). In addition, the models need to use more realistic descriptions of strangulation (believed to be responsible for quenching star formation in satellite galaxies), and a proper treatment of the tidal stripping, heating and destruction of satellite galaxies (which are completely ignored in almost all semi-analytical models). Most likely, the combination of these improved recipes will be able to bring model predictions closer to observations. The stellar ages and metallicities as function of stellar mass and halo mass presented here may serve as a useful benchmark to test and calibrate these ingredients.
Acknowledgments
We thank Simone Weimann and Andrea Macció for useful discussions. Some of the calculations were carried out on the PIA cluster of the Max-Planck-Institut für Astronomie at the Rechenzentrum Garching.
References
- [] Adelman-McCarthy J.K. et al., 2006, ApJS, 162, 38
- [] Baldry I.K., Glazebrook K., Brinkmann J., Ivezic Z., Lupton R.H., Nichol R.C., Szalay A.S., 2004, ApJ, 600, 681
- [] Baldry I.K., Balogh M.L., Bower R.G., Glazebrook K., Nichol R.C., Bamford S.P., Budavari T., 2006, MNRAS, 373, 469
- [] Baldwin J., Philips M., Terlevich R., 1981, PASP, 93, 5
- [] Balogh M.L., Morris S.L., Yee H.K.C., Carlberg R.G., Ellingson E., 1997, ApJ, 488, L75
- [] Balogh M.L., Morris S.L., Yee H.K.C., Carlberg R.G., Ellingson E., 1999, ApJ, 527, 54
- [] Balogh M.L., et al., 2004a, MNRAS, 348, 1355
- [] Balogh M.L., Baldry I.K., Nichol R., Miller C., Bower R., Glazebrook K., 2004b, ApJ, 615, 101
- [] Baugh C.M., 2006, Reports on Progress in Physics, 69, 3101
- [] Bekki K., Couch W.J., Shioya Y., 2002, ApJ, 577, 651
- [] Benson A.J., Lacey C.G., Baugh C.M., Cole S., Frenk C.S., 2002, MNRAS, 333, 156
- [] Benson A.J., Bower R.G., Frenk C.S., Lacey C.G., Baugh C.M., Cole S., 2003, ApJ, 599, 38
- [] Bernardi M., 2009, MNRAS, 395, 1491
- [] Bertone S., Stoehr, F., White S.D.M., 2005, MNRAS, 359, 1201
- [] Bertone S., De Lucia G., Thomas P.A., 2007, MNRAS, 379, 1143
- [] Blanton M.R., et al., 2003, ApJ, 594, 186
- [] Blanton M.R. et al., 2005a, AJ, 129, 2562
- [] Blanton M.R., Eisenstein D., Hogg D.W., Schlegel D.J., Brinkman J., 2005b, ApJ, 629, 143
- [] Brooks A.M., Governato F., Booth C.M., Willman B., Gardner J.P., Wadsley J., Stinson G., Quinn T., 2007, ApJL, 655, L17
- [] Bruzual G., Charlot S., 2003, MNRAS, 344, 1000
- [] Chabrier G., 2003, PASP, 115, 763
- [] Cole S., Lacey C.G., Baugh C.M., Frenk C.S., 2000, MNRAS, 319, 168
- [] Conroy C., Ho S., White M., 2007, MNRAS, 379, 1491
- [] Conroy C., Wechsler R.H., Kravtsov A.V., 2007, ApJ, 668, 826
- [] Cooper M.C., Tremonti C.A., Newman J.A., Zabludoff A.I., 2008, MNRAS, 390, 245
- [] Cooper M.C., Gallazzi A., Newman J.A., Yan R., 2009, preprint (arXiv:0910.0245)
- [] Croom S.M. et al., 2005, MNRAS, 356, 415
- [] Croton D.J., et al., 2005, MNRAS, 356, 1155
- [] Croton D.J. et al., 2006, MNRAS, 365, 11
- [] Dekel A., Woo J., 2003, MNRAS, 344, 1131
- [] De Lucia G., Blaizot J., 2007, MNRAS, 375, 2
- [] De Lucia G., et al., 2007, MNRAS, 374, 809
- [] De Lucia G., Springel V., White S.D.M., Croton D., Kauffmann G., 2006, MNRAS, 366, 499
- [] Domínguez M.J., Muriel H., Lambas D.G., 2001, AJ, 121, 1266
- [] Dressler A., 1980, ApJ, 236, 351
- [] Dutton A.A., van den Bosch F.C., Dekel A., Courteau S., 2007, ApJ, 654, 27
- [] Dutton A.A., van den Bosch F.C., 2009, MNRAS, 396, 141
- [] Ellison S.L., Simard L., Cowan N.B., Baldry I.K., Patton D.R., McConnachie A.W., 2009, MNRAS, 396, 1257
- [] Erb D.K., Shapley A.E., Pettini M., Steidel C.C., Reddy N.A., Adelberger K.L., 2006, ApJ, 644, 813
- [] Faber S.M., Jackson R.E., 1976, ApJ, 204, 668
- [] Finlator K., Davé R., 2008, MNRAS, 385, 2181
- [] Font A.S. et al., 2008, MNRAS, 389, 1619
- [] Fontanot F., De Lucia G., Monaco P., Somerville R.S., Santini P., 2009a, MNRAS, 987
- [] Fontanot F., Somerville, R.S., Silva, L., Monaco, P., Skibba, R., 2009b, MNRAS, 392, 553
- [] Gallazzi A., Brinchmann J., Charlot S., White S.D.M., 2008, MNRAS, 383, 1439
- [] Gallazzi A., Charlot S., Brinchmann J., White S.D.M., Tremonti C.A., 2005, MNRAS, 362, 41
- [] Giovanelli R., Haynes M.P., 1985, ApJ, 292, 404
- [] Gómez P.L., et al., 2003, ApJ, 584, 210
- [] Goto T., Yamauchi C., Fujita Y., Okamura S., Sekiguchi M., Smail I., Bernardi M., Gomez P.L., 2003, MNRAS, 346, 601
- [] Hashimoto Y., Oemler A. Jr., Lin H., Tucker D.L., 1998, ApJ, 499, 589
- [] Hogg D.W., et al., 2003, ApJ, 585, L5
- [] Hogg D.W. et al., 2004, ApJ, 601, 29
- [] Hoyle F., Rojas R.R., Vogeley M.S., Brinkmann J., 2005, ApJ, 620, 618
- [] Jimenez R., Bernardi M., Haiman Z., Panter B., Heavens A.F., 2007, ApJ, 669, 947
- [] Kang X., Jing Y.P., Mo H.J., Börner G., 2005, ApJ, 631, 21
- [] Kang X., Jing Y.P., Silk J., 2006, ApJ, 648, 820
- [] Kang X., van den Bosch F.C., 2008, ApJ, 676, L101
- [] Kauffmann G. et al., 2003a, MNRAS 346, 1055
- [] Kauffmann G. et al., 2003b, MNRAS 341, 54
- [] Kauffmann G., White S.D.M., Heckman T.M., Ménard B.,Brinchmann J., Charlot S., Tremonti C., Brinkmann J., 2004, MNRAS, 353, 713
- [] Kelm B., Focardi P., Sorrentino G., 2005, A&A, 442, 117
- [] Köppen J., Weidner C., Kroupa P., 2007, MNRAS, 375, 673
- [] Kimm T. et al., 2009, MNRAS, 394, 1131
- [] Kormendy J., 1977, ApJ, 218, 333
- [] Larson R.B., 2005, MNRAS, 359, 211
- [] Levy L., Rose J.A., van Gorkom J.H., Chaboyer B., 2007, MNRAS, 133, 1104
- [] Lewis I. et al., 2002, MNRAS, 334, 673
- [] Li C., Kauffmann G., Wang L., White S.D.M., Heckman T.M., Jing Y.P., 2006, MNRAS, 373, 457
- [] Liu L., Yang X., Mo H.J., van den Bosch F.C., Springel V., 2009, MNRAS, submitted (arXiv:0912.1257)
- [] Loubser S.I., Sanchez-Blazquez P., Sansom A.E., Soechting I.K., 2009, MNRAS, 398, 133
- [] MacLow M.-M., Ferrara A., 1999, ApJ, 513, 142
- [] Maiolino R. et al., 2008, A&A, 488, 463
- [] Magorrian J. et al., 1998, AJ, 115, 2285
- [] McCarthy I.G., Frenk C.S., Font A.S., Lacey C., Bower R.G., Mitchell N.L., Balogh M.L., Theuns T., 2008, MNRAS, 383, 593
- [] McGaugh S.S., de Blok W.J.G., 1997, ApJ, 481, 689
- [] Miller C.J., Nichol R.C., Gómez P.L., Hopkins A.M., Bernardi M., 2003, ApJ, 597, 142
- [] Mo H.J., Mao S., 2002, MNRAS, 333, 768
- [] Mo H.J., Yang X., van den Bosch, F.C., Jing Y.P., 2004, MNRAS, 349, 205
- [] Mo H.J., Yang X., van den Bosch, F.C., Katz N., 2005, MNRAS, 363, 1155
- [] Monaco P., 2004, MNRAS, 352, 181
- [] More S., van den Bosch F.C., Cacciato M., Mo H.J., Yang X., Li R., 2009, MNRAS, 392, 801
- [] Mouhcine M., Baldry I.K., Bamford S.P., 2007, MNRAS, 382, 801
- [] Murray N., Quatert E., Thompson T.A., 2005, ApJ, 618, 569
- [] Oemler A., 1974, ApJ, 194, 1
- [] Oppenheimer B.D., Davé R., 2006, MNRAS, 373, 1265
- [] Panter B., Jimenez R., Heavens A.F., Charlot S., 2008, MNRAS, 391, 1117
- [] Pasquali A., van den Bosch F.C., Mo H.J., Yang X., Somerville R., 2009, MNRAS, 394, 38
- [] Petrosian V., 1976, ApJ, 209, L1
- [] Poggianti B.M., Smail I., Dressler A., Couch W.J., Barger A.J., Butcher H., Ellis R.S., Oemler A.J., 1999, ApJ, 518, 576
- [] Postman M., Geller M.J., 1984, ApJ, 281, 95
- [] Santoro F., Shull J.M., 2006, ApJ, 643, 26
- [] Savaglio S. et al., 2005, ApJ, 635, 260
- [] Schlegel D.J., Finkbeiner D.P., Davis M., 1998, ApJ, 500, 525
- [] Shapley A.E., Coil A.L., Ma C.-P., Bundy K., 2005, ApJ, 635, 1006
- [] Shen S., Mo H.J., White S.D.M., Blanton M.R., Kauffmann G., Voges W., Brinkmann J., Csabai I., 2003, MNRAS, 343, 978
- [] Sheth R.K., Jimenez R., Panter B., Heavens A.F., 2006, ApJ, 650, L25
- [] Skibba R.A. et al., 2008, MNRAS, in press (arXiv:0811.3970)
- [] Solanes J.M., Manrique A., Garcia-Gomez C., Gonzales-Casado G., Giovanelli R., Haynes M.P., 2001, ApJ, 548, 97
- [] Somerville R.S., Hopkins P.F., Cox T.J., Robertson B.E., Hernquist L., 2008, MNRAS, 391, 481
- [] Spergel D.N. et al. 2007, ApJS, 170, 377
- [] Strateva I. et al., 2001, AJ, 122, 1861
- [] Strauss M.A., et al., 2002, AJ, 124, 1810
- [] Tanaka M., Goto T., Okamura S., Shimasaku K., Brinkman J., 2004, AJ, 128, 2677
- [] Tinker J.L., Wetzel A.R., 2009, preprint (arXiv0909.1325)
- [] Tremonti C. et al., 2004, ApJ, 613, 898
- [] Tully R.B., Fisher J.R., 1977, A&A, 54, 661
- [] van den Bosch F.C., Aquino D., Yang X., Mo H.J., Pasquali A., McIntosh D.H., Weinmann S.M., Kang X., 2008a, MNRAS, 387, 79
- [] van den Bosch F.C., Pasquali A., Yang X., Mo H.J., Weinmann S.M., McIntosh D.H., Aquino D., 2008b, preprint (arXiv:0805.0002)
- [] Zehavi I., et al., 2002, ApJ, 571, 172
- [] Wake D.A. et al., 2004, ApJ, 610, L85
- [] Wang J., De Lucia G., Kitzbichler M.G., White S.D.M., 2008, MNRAS, 384, 1301
- [] Weinmann S.M., Kauffmann G., van den Bosch F.C., Pasquali A., McIntosh D.H., Mo H.J., Yang X., Guo Y., 2009, MNRAS, 394, 1213
- [] Weinmann S.M., van den Bosch F.C., Xiaohu Y., Mo H.J., 2006a, MNRAS, 366, 2
- [] Weinmann S.M., van den Bosch F.C., Yang X., Mo H.J., Croton D.J., Moore B., 2006b, MNRAS, 372, 1161
- [] Whitmore B.C., Gilmore D.M., Jones C., 1993, ApJ, 407, 489
- [] Yang X., Mo H.J., van den Bosch F.C., Jing Y.P., 2005, MNRAS, 356, 1293
- [] Yang X., Mo H.J., van den Bosch F.C., Pasquali A., Li C., Barden M., 2007, ApJ, 671, 153
- [] Yang X., Mo H.J., van den Bosch F.C., 2008, ApJ, 676, 248
- [] Yang X., Mo H.J., van den Bosch F.C., 2009a, ApJ, 695, 900
- [] Yang X., Mo H.J., van den Bosch F.C., 2009b, ApJ, 693, 830