The environmental dependence of the red galaxy sequence
Abstract
The dependence of the sequence of red galaxies (RS) with the environment is investigated using volume limited samples of field, group, and cluster galaxies drawn from the Sloan Digital Sky Survey (SDSS). Our work focuses in studying the mean colour () and the scatter () of the RS as a function of band absolute magnitude in different environments characterised either by the mass of the system in which the galaxies are located or by the distance to the system’s centre. These results are compared with the RS of field galaxies. The same analysis is carried out using subsamples of red galaxies classified as early types according to their concentration parameter. For a given luminosity, of field galaxies is bluer and is larger than their group and cluster counterparts irrespective of mass and position within the systems. Among systems of galaxies, high mass groups and clusters have the reddest and the smallest . These differences almost disappear when red early type galaxies alone are considered. Galaxies in the core and in the outskirts of groups have similar , whereas galaxies in clusters show a strong dependence on cluster centric distance, being the inner galaxies the reddest objects. Red early type galaxies in the outskirts of clusters have values as large as field galaxies’, while galaxies in the inner regions of clusters have lower values, comparable to those of group galaxies. We find that bright red early type galaxies have reached nearly the same evolutionary stage in all environments. Our results suggest that, although effective in drifting galaxies of intermediate luminosities towards redder colours, the cluster environment is not necessary to populate the RS. We propose a scenario in which the RS in massive systems is populated by two different star formation history galaxies: red early type galaxies that formed the bulk of their stars during the early stages of massive halo assembly, and red galaxies that passed most of their lives inhabiting poor groups or the field and fell into massive systems at lower redshifts.
keywords:
galaxies: fundamental parameters – galaxies: clusters: general – galaxies: evolution1 Introduction
Several years of research have demonstrated that galaxy properties strongly depend on mass, time and environment. Galaxy properties are related in different ways with these three fundamental parameters. Colour and luminosity have been proposed as two of the properties that predict best the environment (Blanton et al., 2005; Martínez & Muriel, 2006; Martínez et al., 2008). Nevertheless, for bulge-dominated galaxies, these two properties show a very robust correlation: the RS, also known as colour magnitude relation (CMR, Visvanathan & Sandage 1977). Faber (1973) and Bower et al. (1992) found a high degree of universality for this relation comparing early type galaxies in clusters, groups and the field. The colour of a galaxy correlates with the ratio of the present star formation rate (SFR) to the overall mass of stars in the galaxy. Since the present day’s SFR is several orders of magnitude smaller than in the past, nearly half of the stellar mass of the universe is in galaxies that populate the RS (Bell et al., 2004). The RS is primarily the result of a relation between mass and metallicity (Faber, 1973). Bright galaxies are redder because they are more metal enriched, producing the well known slope of the RS. Age variations may also play a role (Faber, 1973) being the reddest galaxies the older population.
There is a lot of discussion going on about how the RS is populated. It has been suggested that galaxies move from the blue population (blue cloud) to the RS due to the truncation of the star formation in galaxies (Bell et al., 2007). One of the proposed mechanisms to produce this effect is the merging of galaxies in the framework of the hierarchical galaxy formation. For the most massive galaxies, the proposed model involves mergers of galaxies that already are in the RS (dry mergers, van Dokkum 2005). Several physical mechanisms associated with the environment can also play an important role in quenching the star formation, like for instance the hostile cluster environment that can suppress the star formation. Tanaka et al. (2005) suggest that the bright end of the cluster RS is already in place at while this relation for field galaxies has been built all the way down to the present day. Using a semi-analytic model, De Lucia et al. (2007) also suggest that the RS seems to be in place at intermediate redshifts, nevertheless, they found a significant deficit of faint red galaxies in clusters at . suggesting that the RS population of high redshift clusters does not contain all the progenitors of nearby RS cluster galaxies. These authors found differences in the formation times of the bulk of stars between cluster and field galaxies. Similar results were found by Kaviraj et al. (2009). Nevertheless, Menci et al. (2008), also using a semi-analytic model, found similar mass growth history of field and cluster galaxies at , although, a larger dispersion of ages for RS field galaxies was reported. Based on observational data, Stott et al. (2007) and Stott et al. (2009) investigated the evolution of the RS in clusters from to the present and found that the rest-frame slope of the RS relation evolves with redshift, this is attributed to the build up of the RS over time. Analysing a sample of 127 rich galaxy clusters Lu et al. (2009) found no strong evolution of the red-sequence’s dwarf-to-giant ratio in the range but they found a significant increase of the red-sequence dwarf galaxies from to . Krick et al. (2008) also found a deficit of faint galaxies on the red sequence in clusters at , suggesting that, in clusters, the most massive galaxies have evolved faster than lesser massive galaxies. On the contrary, Andreon et al. (2005) suggested that the abundance of red galaxies, relative to bright ones, is constant over the redshift range .
Although the most massive galaxies that populate the bright region of the RS reside in high mass clusters, galaxies in different environments seem to show similar RSs. Hogg et al. (2004) analysed a sample of 55158 galaxies taken from the SDSS and found that the colour-magnitude relation is independent of the of environmental overdensity. Analysing galaxies at , Cassata et al. (2007) found that the slope of the RS is independent of the local density, Similarly, Stott et al. (2009) observed no strong correlation between this slope and the cluster environment at a given redshift. McIntosh et al. (2005) analysed the RS of three Abell clusters of different masses and found that these clusters have similar RSs and narrow limits of intrinsic colour scatter and slope. López-Cruz et al. (2004) analysed a sample of 57 X-ray-detected Abell clusters of different richness and cluster types and found that they present similar RSs. On the other hand, Haines et al. (2006) and Mei et al. (2009) found evidences of a relation between the RS and the environment in clusters of galaxies. Analysing the core of the Shapley supercluster, Haines et al. (2006) found that the RS is 0.015mag redder in highest-density regions. They interpret this result in terms of ages, suggesting a population being 500-Myr older in the cluster cores. Pimbblet et al. (2002) and Pimbblet et al. (2006) analysed a sample of 11 low redshift X-ray luminous clusters and found dependencies of the RS properties as a function of the projected cluster-centric distance. For 12 intermediate-redshift X-ray clusters, Wake et al. (2005) found similar results, also interpreted in terms of age gradients. Mei et al. (2009) also found evidences of age differences between galaxies in the core and outskirts of clusters at high redshift. Gilbank & Balogh (2008) used composite samples of published cluster and field galaxies photometry and found that the dwarf-to-giant ratio in clusters is higher than that of the field at all redshifts, suggesting that the faint end of the RS was established in clusters. Koyama et al. (2007) analysed the deficit of faint red galaxies in clusters and found that this effect depends on cluster richness or mass, in the sense that poorer systems show stronger deficits.
The scatter around the RS can be used to constrain the way that galaxies reach the RS. In the merger scenario, where the most massive galaxies in the RS are the result of the merger of galaxies already in the RS (van Dokkum, 2005), a significant scatter is expected (Bower et al., 1992). Nevertheless, Bernardi et al. (2007) and Skelton et al. (2009) argued that a small scatter is not against the dry merger scenario. The intrinsic scatter could also be the result of a spread in the age of the stellar population, as a result of differences in the time of the formation of the bulk of the stars at high redshift or the quenching of the star formation in the blue cloud at different epochs. Mei et al. (2009) systematically studied the RS scatter in high-redshift clusters as a function of different parameters. They found that the RS scatter for bright elliptical galaxies ( increases with distance from the cluster centre, on the other hand, all the elliptical galaxies of fainter magnitudes show similarly larger scatter. These results are interpreted in terms of differences of ages.

In this paper, we probe the environmental dependence of the RS by analysing the mean colour and scatter of the RS as a function of galaxy absolute magnitude in samples of galaxies in the field, in groups and in X-ray clusters. The aim of this work is to determine a precise RS for galaxies in different environments using a uniform sample of galaxies, and to shed light on the understanding of its origin. In groups and clusters we analyse how the RS depends on system mass and the projected distance to the centres of the systems. This paper is organised as follows: section 2 describes the samples of galaxies used; the dependence of the RS on mass and system-centric distance is analysed in section 3; in section 4 we summarise and discuss our results.
2 The samples of galaxies
To probe the environmental dependence of the RS, we use samples of field, group and cluster galaxies drawn from the Main Galaxy Sample (MGS; Strauss et al. 2002) of the last public release of the SDSS (DR7; Abazajian et al. 2009). In some of the analyses below, we classify galaxies into early and late types according to their concentration parameter (Strateva et al., 2001), thus we have restricted our galaxy samples to be as a compromise between the number of objects and avoiding non-negligible seeing effects in the values of the radii enclosing 50 and 90 per cent of Petrosian flux.
Groups of galaxies in the DR7 MGS used in this work were identified by Dr. Ariel Zandivarez (private communication) using a standard friend-of-friend (fof) technique as in Merchán & Zandivarez (2005). Given the known sampling problems for bright galaxies, galaxies with apparent magnitude were excluded before running the finder algorithm, i.e., the group identification was carried out over all MGS galaxies with . We refer the reader interested in the details to the Merchán & Zandivarez (2005) paper. The following values were used in the group identification: a transverse linking length corresponding to an overdensity , a line-of-sight linking length (both of them scale with a factor that compensates for the decline of the selection function with distance that assumes the galaxy luminosity function found by Blanton et al. (2003b)), the same cosmology used in this paper, and a fiducial distance of . The identification resulted in 11028 groups with at least 4 galaxy members, adding up to a total of 78056 galaxies in the redshift range of our interest . This sample has median virial mass ⊙, median virial radius and median redshift . According to the analyses of group identification accuracy performed over mock catalogues by Merchán & Zandivarez (2002), less than of groups identified with the parameters above should be spurious. It is worth mentioning that we have not excluded groups from the sample on the basis of matching them with known clusters of any kind.
Galaxies in X-ray selected clusters used in this paper are a subsample of the C-P04-I sample of Coenda & Muriel (2009) who selected clusters from the ROSAT-SDSS Galaxy Cluster Survey of Popesso et al. (2007). The C-P04-I sample comprises 42 regular galaxy clusters in the redshift range . Galaxies in these clusters were identified using the MGS of the Fifth Data Release (DR5) of SDSS (Adelman-McCarthy et al., 2007). In order to compute cluster properties, Coenda & Muriel (2009) identified cluster members in two steps. First, they used the fof algorithm with the linking parameters and modifications introduced by Díaz et al. (2005). Then they performed an eyeball examination of the structures detected by fof. From the redshift distribution of galaxies, they determined the line-of-sight extension of each cluster and therefore, the clusters members. Through visual inspection, Coenda & Muriel (2009) exclude systems that have two or more close substructures of similar size in the plane of the sky and/or in the redshift distribution. Finally, the authors computed cluster physical properties such as the line-of-sight velocity dispersion , virial radius and mass. They found a median virial mass of ⊙ and a median virial radius of .
We consider as ’field galaxies’ to all DR7 MGS galaxies that were not identified as belonging to fof groups nor to Coenda & Muriel (2009) clusters. Thus, our field galaxy sample should be contaminated by galaxies in systems not identified by the group finder algorithm. While interpreting the outcomes of our analyses this fact should be kept in mind.
Galaxy magnitudes used throughout this paper have been corrected for Galactic extinction using the maps by Schlegel et al. (1998) and for the effects of seeing and sky level as in Coenda & Muriel (2009). Absolute magnitudes have been computed assuming a flat cosmological model with parameters , and , corrected and band-shifted to a redshift using the method of Blanton et al. (2003) (KCORRECT version 4.1). All magnitudes are in the AB system.
3 The RS and the environment
At fixed luminosity, the colour distribution of galaxies is well described by the sum of two Gaussian functions (e.g. Baldry et al. 2004; Balogh et al. 2004; Martínez et al. 2006), representing the blue and red galaxy populations. Thus, by fitting this model to the colour distribution of galaxies at different absolute magnitude bins, one can have a suitable quantification of the colour-magnitude distribution of galaxies as demonstrated by Baldry et al. (2004). In this section, we study the environmental dependence of the RS by fitting the two-Gaussian model to the colour distribution of field, group, and cluster galaxies as a function of absolute magnitude, using a standard Levenberg-Marquardt method.
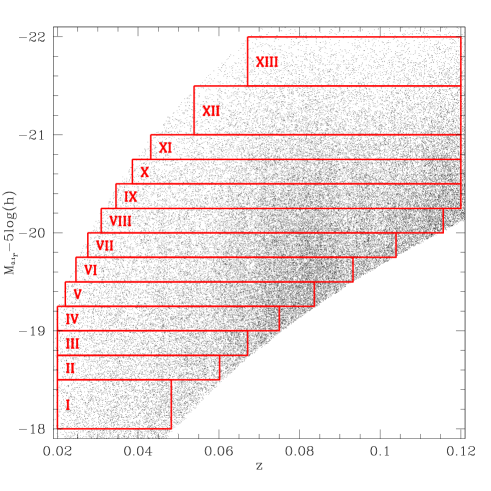
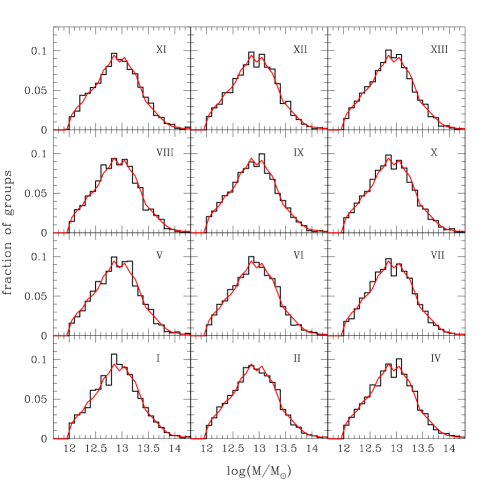
When analysing the RS of galaxies in our group sample special care must be taken. Since the MGS is essentially a flux limited sample of galaxies in the range , to maximise the number of galaxies in our analyses, we could be tempted to weight each galaxy in order to compensate for the Malmquist bias, for instance using the usual method (Schmidt, 1968). This approach, however, has an important bias: fainter galaxies are effectively observed in lower redshift groups, i.e., within smaller volumes, and thus, located preferentially in lower mass systems for all plausible group mass functions. To avoid this bias, one has to deal with volume limited samples of galaxies. This is what we do in this work, but not in a straightforward way as would be using galaxies in groups within a single volume. That approach has the inconvenience of, the fainter the faintest galaxies included in the sample are, the smaller the volume is, and thus, the smaller the number of bright galaxies included. Our approach consists in defining, for each luminosity bin analysed, a volume limited sample of galaxies belonging to a subset of groups selected in order to have a particular mass distribution. The apparent magnitude cut-offs define, for each luminosity bin, a minimum and a maximum redshift within which the galaxy sample is volume limited. We show this in Figure 1. It is clear that, different luminosity bins sample different volumes. Therefore the mass distributions of groups will differ from one another. The larger volumes will include, on average, groups more massive than the smaller volumes. To have roughly the same group mass distribution from bin to bin, we proceed as follows. First, we choose a reference bin and compute the mass distribution of groups in it. Then, for each other bin, we apply a Monte-Carlo algorithm to select the largest subset of groups that closely follows the mass distribution on the reference bin. We use as a reference the luminosity bin that spans the redshift range (bin III in Figure 1). In Figure 2 we show in continuous red line the mass distribution of groups in the redshift range of the reference bin and the resulting group mass distributions for the remaining 12 bins of Figure 1.
Since our sample of X-ray clusters has only 42 systems after applying the cut-off, the procedure above can not be applied. In this case, we use only 4 luminosity bins, the mass distributions of the parent clusters are shown in Figure 3. A Kolmogorov-Smirnov test among the mass distributions in Figure 3 taken by pairs gives significance levels for the null hypothesis that they are drawn from the same distribution above 98% in all cases.
3.1 The mass dependence of the RS
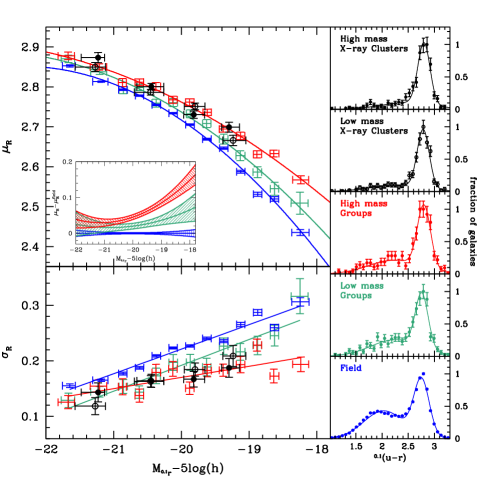
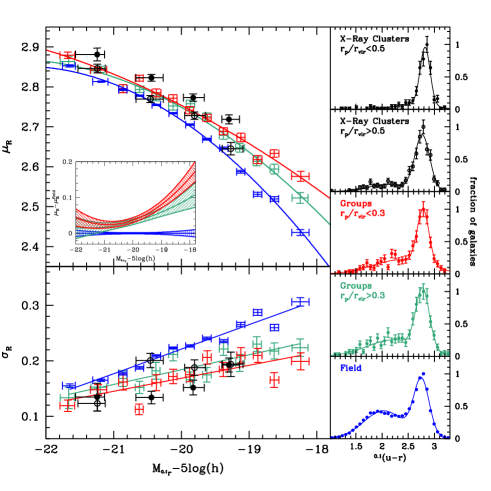
In Figure 4 we show the mean colour (), and the width () of the Gaussian function that fits the RS a a function of absolute magnitude for field galaxies, and galaxies in groups and clusters of different masses. Error-bars are 1 estimates as given by the fitting procedure. We split groups and clusters into low and high mass according to the median of their mass distribution, that is for groups, and , for the sample of X-ray clusters. Field galaxies in each luminosity bin were selected to be volume limited. In all cases, the abscissas are the medians of the corresponding distribution of absolute magnitudes in the bin, and the horizontal error-bars are the 25% and 75% quartiles. In the right panels we show examples of the ability of the method to obtain good fits to the colour distributions.
Although the RS has been historically fitted as a linear relation, in more recent years (e.g. Baldry et al. 2004; Janz & Lisker 2009; Skelton et al. 2009) it has been found that the relation is best described by an shape. Modelling the galaxy colour-magnitude diagram, Baldry et al. (2004) found that both and follow tanh-laws as a function of absolute magnitude. As can be seen in Figure 4, of field and group galaxies follow smooth curves as a function of absolute magnitude. We checked that tanh-laws can provide visually suitable fits to the data points but, since we do not probe fainter magnitudes where the inflection point of the tanh-law is expected, the estimated errors in the resulting parameters were too large and gave rise to broad confidence bands around the fit. We found that quadratic polynomials provide good fits to our data points. In Figure 4 we show with continuous line the best quadratic fit to the for field, and group galaxies. In an inset panel we show the confidence level of the quadratic fits. We did not fit of X-ray clusters since we have a much smaller number of galaxies and a cut-off at , and to obtain reliable fits to the colour distributions we had to split cluster galaxies into 4 luminosity bins only.
It is clear, from Figure 4, that of field galaxies is clearly bluer than its group and cluster counterparts. Among groups, is systematically redder for the high mass subsample for galaxies fainter than . Regarding the scatter of the RS, , it shows a tendency of becoming broader with decreasing luminosity in all environments probed (lower left panel of Figure 4). We also show linear fits to as a function of for field and group galaxies. Field galaxies show the highest values of for the whole range of absolute magnitudes. Among galaxies in groups, is smaller for the high group mass subsample, with the exception of one single bin. The points corresponding to galaxies in clusters are consistent with the values from high mass groups.
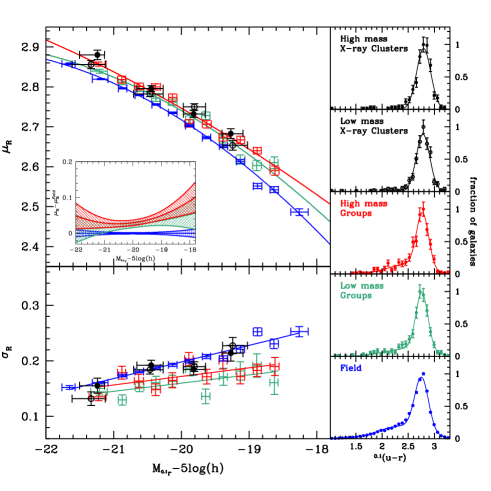
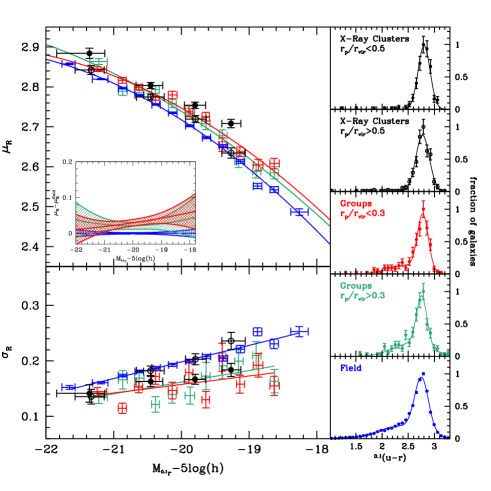
Figure 5 is similar to Figure 4 but considers red early type galaxies alone. To do this we repeated the fitting procedure only to galaxies that have concentration parameters (Strateva et al., 2001) in the band. The exclusion of these galaxies did not completely remove the blue population as can be seen in the right panels of Figure 5. For groups, the differences observed between low and high mass subsamples is not clear anymore. We were not able to keep the same number of bins as in Figure 4 since the exclusion of an important number of galaxies limited the ability of the method for obtaining reliable Gaussian fits. For X-ray clusters, the results were not affected by the cut-off, since only a few galaxies in the sample have . What is still clear from Figure 5 is that field galaxies have values that are systematically bluer that their counterparts in systems of galaxies. Regarding , field values are consistent with cluster’s and there is no clear distinction between groups of different masses.
3.2 The system-centric dependence of the RS
We also explore the dependence of the RS with the distance to the centres of the systems in which the galaxies are located. We use the same samples of galaxies constructed for the analyses of the previous subsection. We split galaxies in systems according to whether their projected distance to the system’s centre in units of the virial radius, , is larger or smaller than the sample’s median. The median values are 0.3 for groups, and 0.5 for X-ray clusters.
In Figure 6 we show and as a function of absolute magnitude for galaxies in the inner and outer regions of systems, classified by their ratios. We also show as a comparison, the field values from Figure 4. For group galaxies, in the inner regions is systematically redder than its outer regions counterpart for . Even with larger error-bars, in the inner regions of clusters is significantly redder than in the outer regions for all luminosities probed. It is also clear that in the field is distinctively bluer than in groups and in the inner regions of clusters for . It is interesting to notice that the in the outer regions of clusters is consistent with that of field galaxies. The scatter of the RS is systematically larger for field galaxies over the whole range of magnitudes. Despite noisier trends, is marginally larger in the outer parts of groups than in the inner regions. For galaxies in clusters larger values are found in the outer regions.
Figure 7 shows the resulting sequences for red early type galaxies only. The differences in the RS between the inner and the outer parts of groups disappear. As in the previous subsection, since a vast majority of our cluster galaxies are early type, there are no significant changes between the cluster sequences shown in Figures 6 and 7. Lower left panel of Figure 7 shows that the scatter of the RS is larger in the field and in the outskirts of clusters and no clear distinction can be made between inner and outer parts of groups.
4 Discussion and conclusions
Using volume limited samples of bright field, group and X-ray cluster galaxies we study the environmental dependence of the red galaxy sequence. Field and system galaxies were drawn from the DR7 of the SDSS. Properties of the colour-magnitude relation of red galaxies are studied by fitting a two-Gaussian model to the colour distribution as a function of the absolute magnitude. Based on the concentration parameter, we have also selected red early type galaxies. The resulting RSs have curved shapes that are well described by quadratic polynomials over the luminosity range probed.
We found that for each luminosity, mean colours of field red-galaxies are bluer than their group and cluster counterparts. Among systems of galaxies, high mass groups and clusters show the reddest RS. Red galaxies in low mass groups have intermediate colours between field and cluster galaxies. The differences in the mean colours are larger for the faintest luminosity bins. If red early-type galaxies are considered, galaxies in groups and clusters populate the same RS. Nevertheless, for the whole range of magnitudes, field galaxies are bluer than galaxies in systems. It is important to note that the RS defined by early type galaxies has properties different than those obtained for red galaxies without morphological selection, suggesting different evolutionary paths for non star forming galaxies of different morphological types. We have also analysed the scatter around the mean RS. presents, for all environments analysed in this work, a systematic increase towards fainter magnitudes. Galaxies in groups and clusters show a similar behaviour, while field galaxies present for the whole range of magnitudes the highest values of the intrinsic scatter. This property of field galaxies is consistent with a more complex history of the star formation and quenching processes.
If the system-centric distance is used to characterise the environment, our results are slightly different. With the exception of a few luminosity bins, galaxies in the core and the outskirts of groups show similar RSs whereas galaxies in X-ray clusters show a strong dependence on for the whole range of magnitude, being inner galaxies the reddest objects. Similar results are found for red early-type galaxies. It should be noted that galaxies in the outskirts of clusters have colours similar to those of field galaxies. This is in agreement with the scenario of field galaxies falling into clusters. If the scatter is analysed, the differences between system mass and system-centric distance are more significant. Field galaxies are still the objects that show the highest values of scatter, nevertheless, red early type galaxies in the outskirts of X-ray clusters show a scatter as large as field galaxies’, while galaxies in the core of clusters have lower values that are comparable to those of group galaxies.
Our results indicate that the RS depends on the present time environment. Nevertheless, most of the stars that place a galaxy in the RS were formed when the universe was very young, moreover, most of the physical processes acting at were not necessarily present at times when the bulk of the stellar populations were forming. Therefore, the origin of the dependence of the RS on the present time environment should be looked for at high redshift. Steidel et al. (2005) found that galaxies in protoclusters have mean ages times larger than identical galaxies outside the protocluster structures. This observational evidence is in agreement with the CDM model where denser dark matter concentrations collapse earlier and form an important fraction of their stellar mass in early short events (Springel et al., 2005). These differences in age will imply subtle differences in the present day colours. In order to test this hypothesis, we have used the code GALAXEV by Bruzual & Charlot (2003) to construct the SED of a solar metallicity Salpeter IMF stellar population with a star formation rate of the form , and assumed Gyr. This model SED allows us to relate colour differences in the RS of different environments with age differences, assuming that all galaxies in the RS are represented by such a simple model. Within this scenario, the colour differences between field and high mass group galaxies in Figure 1 imply age differences ranging from to Myr in the magnitude range . These differences are comparable to those found by De Lucia et al. (2006) when analysing the formation history of elliptical galaxies in halos of different masses.
We conclude that, the RS shows dependencies with environment that could be mostly interpreted in terms of the typical age of the bulk of their stellar population. Beyond the fact that each environment shows a different RS, within a given environment, the RS scatter also shows variations. If these results are also analysed in terms of ages, assuming that higher scatter corresponds to younger ages (Kodama and Arimoto 1997), our results indicate that the oldest stellar population are to be found in the brightest galaxies. Field galaxies and cluster members in the outskirts have values of scatter equal or larger than the corresponding values for groups and galaxies in the core of clusters, also consistent with the scenario of field galaxies falling into clusters. The same effect seems to be present in the outskirts of groups of galaxies. However this can only be as a hint, given the significant dispersion observed, particularly in the mean values of . If red early type galaxies are considered, the differences in the RSs are smaller, moreover, we found that bright galaxies () have the same colour (ages) irrespective of the environment. In other words, bright red early type galaxies are the only objects that reached nearly the same evolutionary stage in groups, clusters and in the field. The clear difference between RS galaxies in the core and the outskirts of clusters, suggests that the cluster environment could be playing a roll in the drift of galaxies of intermediate magnitudes towards redder colours, producing an increase of the fraction of red galaxies. Nevertheless, the fact that galaxies in groups and in the core of X-ray clusters populate nearly the same RS (the cluster RS is slightly redder), suggests that the cluster environment is not necessary to populate the RS. Our findings give support to a scenario in which the RS of galaxies in clusters is made of two population of galaxies: on one hand, very old objects that are those observed galaxies populating the RS in clusters at and that were formed in proto-clusters, and, on the other hand, galaxies that evolved in groups or in the field with a more complex history of mergers and star formation that ended up in clusters at lower redshift. These two populations that can not be distinguished by their colour alone, would show differences in their morphology.
Acknowledgements
We thank the anonymous referee for comments and suggestions that improved this paper. We are indebted to Ariel Zandivarez for the group identification in the DR7 MGS. HJM acknowledges the support of a Young Researcher’s grant from Agencia Nacional de Promoción Científica y Tecnológica Argentina, PICT 2005/38087. This work has been partially supported with grants from Consejo Nacional de Investigaciones Científicas y Técnicas de la República Argentina (CONICET) and Secretaría de Ciencia y Tecnología de la Universidad de Córdoba.
Funding for the Sloan Digital Sky Survey (SDSS) has been provided by the Alfred P. Sloan Foundation, the Participating Institutions, the National Aeronautics and Space Administration, the National Science Foundation, the U.S. Department of Energy, the Japanese Monbukagakusho, and the Max Planck Society. The SDSS Web site is http://www.sdss.org/. The SDSS is managed by the Astrophysical Research Consortium (ARC) for the Participating Institutions. The Participating Institutions are The University of Chicago, Fermilab, the Institute for Advanced Study, the Japan Participation Group, The Johns Hopkins University, the Korean Scientist Group, Los Alamos National Laboratory, the Max Planck Institut für Astronomie (MPIA), the Max Planck Institut für Astrophysik (MPA), New Mexico State University, University of Pittsburgh, University of Portsmouth, Princeton University, the United States Naval Observatory, and the University of Washington.
References
- Abazajian et al. (2009) Abazajian, K. N., et al. 2009, ApJS, 182, 543
- Adelman-McCarthy et al. (2007) Adelman-McCarthy, J. K., et al. 2007, ApJS, 172, 634
- Andreon et al. (2005) Andreon, S., Valtchanov, I., Jones, L. R., Altieri, B., Bremer, M., Willis, J., Pierre, M., & Quintana, H. 2005, MNRAS, 359, 1250
- Baldry et al. (2004) Baldry, I. K., Glazebrook, K., Brinkmann, J., Ivezić, Ž., Lupton, R. H., Nichol, R. C., & Szalay, A. S. 2004, ApJ, 600, 681
- Balogh et al. (2004) Balogh, M. L., Baldry, I. K., Nichol, R., Miller, C., Bower, R., & Glazebrook, K. 2004, ApJL, 615, L101
- Bell et al. (2004) Bell, E. F., et al. 2004, ApJ, 608, 752
- Bell et al. (2007) Bell, E. F., Zheng, X. Z., Papovich, C., Borch, A., Wolf, C., & Meisenheimer, K. 2007, ApJ, 663, 834
- Bernardi et al. (2007) Bernardi, M., Hyde, J. B., Sheth, R. K., Miller, C. J., & Nichol, R. C. 2007, AJ, 133, 1741
- Blanton et al. (2003) Blanton, M. R., et al. 2003, AJ, 125, 2348
- Blanton et al. (2003b) Blanton, M. R., et al. 2003, ApJ, 592, 819
- Blanton et al. (2005) Blanton, M. R., Eisenstein, D., Hogg, D. W., Schlegel, D. J., & Brinkmann, J. 2005, ApJ, 629, 143
- Bower et al. (1992) Bower, R. G., Lucey, J. R., & Ellis, R. S. 1992, MNRAS, 254, 601
- Bruzual & Charlot (2003) Bruzual, G., & Charlot, S. 2003, MNRAS, 344, 1000
- Cassata et al. (2007) Cassata, P., et al. 2007, ApJS, 172, 270
- Coenda & Muriel (2009) Coenda, V., & Muriel, H. 2009, A&A, 504, 347
- De Lucia et al. (2006) De Lucia, G., Springel, V., White, S. D. M., Croton, D., & Kauffmann, G. 2006, MNRAS, 366, 499
- De Lucia et al. (2007) De Lucia, G., et al. 2007, MNRAS, 374, 809
- Díaz et al. (2005) Díaz E., Zandivarez A., Merchán M. E., Muriel H., 2005, ApJ, 629, 158
- Faber (1973) Faber, S. M. 1973, ApJ, 179, 731
- Gilbank & Balogh (2008) Gilbank, D. G., & Balogh, M. L. 2008, MNRAS, 385, L116
- Haines et al. (2006) Haines, C. P., Merluzzi, P., Mercurio, A., Gargiulo, A., Krusanova, N., Busarello, G., La Barbera, F., & Capaccioli, M. 2006, MNRAS, 371, 55
- Hogg et al. (2004) Hogg, D. W., et al. 2004, ApJL, 601, L29
- Janz & Lisker (2009) Janz, J., & Lisker, T. 2009, ApJL, 696, L102
- Kaviraj et al. (2009) Kaviraj, S., Devriendt, J. E. G., Ferreras, I., Yi, S. K., & Silk, J. 2009, A&A, 503, 445
- Koyama et al. (2007) Koyama, Y., Kodama, T., Tanaka, M., Shimasaku, K., & Okamura, S. 2007, MNRAS, 382, 1719
- Krick et al. (2008) Krick, J. E., Surace, J. A., Thompson, D., Ashby, M. L. N., Hora, J. L., Gorjian, V., & Yan, L. 2008, ApJ, 686, 918
- López-Cruz et al. (2004) López-Cruz, O., Barkhouse, W. A., & Yee, H. K. C. 2004, ApJ, 614, 679
- Lu et al. (2009) Lu, T., Gilbank, D. G., Balogh, M. L., & Bognat, A. 2009, MNRAS, 1293
- Martínez et al. (2002) Martínez, H. J., Zandivarez, A., Domínguez, M., Merchán, M. E., & Lambas, D. G. 2002, MNRAS, 333, L31
- Martínez & Muriel (2006) Martínez, H. J., & Muriel, H. 2006, MNRAS, 370, 1003
- Martínez et al. (2006) Martínez, H. J., O’Mill, A. L., & Lambas, D. G. 2006, MNRAS, 372, 253
- Martínez et al. (2008) Martínez, H. J., Coenda, V., & Muriel, H. 2008, MNRAS, 391, 585
- McIntosh et al. (2005) McIntosh, D. H., Zabludoff, A. I., Rix, H.-W., & Caldwell, N. 2005, ApJ, 619, 193
- Mei et al. (2009) Mei, S., et al. 2009, ApJ, 690, 42
- Menci et al. (2008) Menci, N., Rosati, P., Gobat, R., Strazzullo, V., Rettura, A., Mei, S., & Demarco, R. 2008, ApJ, 685, 863
- Merchán & Zandivarez (2002) Merchán, M., & Zandivarez, A. 2002, MNRAS, 335, 216
- Merchán & Zandivarez (2005) Merchán, M. E., & Zandivarez, A. 2005, ApJ, 630, 759
- Petrosian (1976) Petrosian, V. 1976, ApJL, 209, L1
- Pimbblet et al. (2002) Pimbblet, K. A., Smail, I., Kodama, T., Couch, W. J., Edge, A. C., Zabludoff, A. I., & O’Hely, E. 2002, MNRAS, 331, 333
- Pimbblet et al. (2006) Pimbblet, K. A., Smail, I., Edge, A. C., O’Hely, E., Couch, W. J., & Zabludoff, A. I. 2006, MNRAS, 366, 645
- Popesso et al. (2007) Popesso, P., Biviano, A., Romaniello, M., Böhringer, H. 2007, A&A, 461, 411
- Schlegel et al. (1998) Schlegel, D. J., Finkbeiner, D. P., & Davis, M. 1998, ApJ, 500, 525
- Schmidt (1968) Schmidt, M. 1968, ApJ, 151, 393
- Skelton et al. (2009) Skelton, R. E., Bell, E. F., & Somerville, R. S. 2009, ApJL, 699, L9
- Springel et al. (2005) Springel, V., et al. 2005, Nature, 435, 629
- Steidel et al. (2005) Steidel, C. C., Adelberger, K. L., Shapley, A. E., Erb, D. K., Reddy, N. A., & Pettini, M. 2005, ApJ, 626, 44
- Stott et al. (2007) Stott, J. P., Smail, I., Edge, A. C., Ebeling, H., Smith, G. P., Kneib, J.-P., & Pimbblet, K. A. 2007, ApJ, 661, 95
- Stott et al. (2009) Stott, J. P., Pimbblet, K. A., Edge, A. C., Smith, G. P., & Wardlow, J. L. 2009, MNRAS, 394, 2098
- Strateva et al. (2001) Strateva, I., et al. 2001, AJ, 122, 1861
- Strauss et al. (2002) Strauss, M. A., et al. 2002, AJ, 124, 1810
- Tanaka et al. (2005) Tanaka, M., Kodama, T., Arimoto, N., Okamura, S., Umetsu, K., Shimasaku, K., Tanaka, I., & Yamada, T. 2005, MNRAS, 362, 268
- van Dokkum (2005) van Dokkum, P. G. 2005, AJ, 130, 2647
- Visvanathan & Sandage (1977) Visvanathan, N., & Sandage, A. 1977, ApJ, 216, 214
- Wake et al. (2005) Wake, D. A., Collins, C. A., Nichol, R. C., Jones, L. R., & Burke, D. J. 2005, ApJ, 627, 186
- York et al. (2000) York, D. G., et al. 2000, AJ, 120, 1579
- Zandivarez et al. (2006) Zandivarez, A., Martínez, H. J., & Merchán, M. E. 2006, ApJ, 650, 137