The Globular Cluster System of the Virgo Giant Elliptical Galaxy NGC 4636: II. Kinematics of the Globular Cluster System**affiliation: Based on data collected at Subaru Telescope, which is operated by the National Astronomical Observatory of Japan.
Abstract
We present a kinematic analysis of the globular cluster (GC) system in the giant elliptical galaxy (gE) NGC 4636 in the Virgo cluster. Using the photometric and spectroscopic database of 238 GCs (108 blue GCs and 130 red GCs) at the galactocentric radius , we have investigated the kinematics of the GC system. The NGC 4636 GC system shows weak overall rotation, which is dominated by the red GCs. However, both the blue GCs and red GCs show some rotation in the inner region at ( kpc). The velocity dispersion for all the GCs is derived to be km s-1. The velocity dispersion for the blue GCs ( km s-1) is slightly larger than that for the red GCs ( km s-1). The velocity dispersions for the blue GCs about the mean velocity and about the best fit rotation curve have a significant variation depending on the galactocentric radius. Comparison of observed stellar and GC velocity dispersion profiles with the velocity dispersion profiles calculated from the stellar mass profile shows that the mass-to-light ratio should increase as the galactocentric distance increases, indicating the existence of an extended dark matter halo. From the comparison of the observed GC velocity dispersion profiles and the velocity dispersion profiles calculated for the X-ray mass profiles in the literature, we find that the orbit of the GC system is tangential, and that the orbit of the red GCs is slightly more tangential than that of the blue GCs. We compare the GC kinematics of NGC 4636 with those of other six gEs, finding that the kinematic properties of the GCs are diverse among gEs. We find several correlations between the kinematics of the GCs and the global parameters of their host galaxies. We discuss the implication of the results for the formation models of the GC system in gEs, and suggest a mixture scenario for the origin of the GCs in gEs.
1 Introduction
Globular clusters (GCs) are an excellent tracer to probe the gravitational potential of their host galaxies. Kinematics of the GC system in a galaxy is determined by the gravitational potential of their host galaxies and the GCs contain a fossil record of the dynamical evolution since the formation of their host galaxy. From the kinematic study of the GC system we can estimate the global mass distribution of their host galaxy including the dark matter, or can derive information on the orbital properties of the GCs if a mass distribution of their host galaxy is known in prior (e.g., X-ray observation of the hot gas). GCs are useful especially for the study of the outer region of a galaxy where the gravitational potential is mainly dominated by the dark matter. They are particularly efficient for the study of nearby giant elliptical galaxies (gEs) where thousands of GCs are often found.
Recently Hwang et al. (2008) presented a good summary of the results on the kinematics of the GC systems in six nearby gEs, derived using the consistent analysis with the data in the literature: M49 (Zepf et al., 2000; Côté et al., 2003), M60 (Pierce et al., 2006; Bridges et al., 2006; Lee et al., 2008a), M87 (Cohen & Ryzhov, 1997; Kissler-Patig & Gebhardt, 1998; Côté et al., 2001), NGC 4636 (Schuberth et al., 2006; Chakrabarty & Raychaudury, 2008), NGC 1399 (Kissler-Patig et al., 1998; Minniti et al., 1998; Kissler-Patig et al., 1999; Richtler et al., 2004, 2008), and NGC 5128 (Peng et al., 2004a, b; Woodley et al., 2007). Later Romanowsky et al. (2009) presented the results of a study of the kinematics of the GC system in another gE, NGC 1407, in a nearby galaxy group and provided updated kinematic analysis of the GC systems in gEs using their consistent method. One surprising finding from these studies is that the kinematics of the GC systems in these gEs is diverse, showing a large difference in velocity dispersion, rotation, and their radial variation among the gEs. This is in stark contrast to the photometric property of the GCs that is more or less similar among the gEs (Lee, 2003; Brodie & Strader, 2006).
We have been carrying a project to investigate the spectroscopic properties of the GCs in nearby galaxies. Our study on the kinematics of the GC system of M60, a gE in Virgo, was presented in Lee et al. (2008a) and Hwang et al. (2008), and another on the M31 GC system was given in Lee et al. (2008c). Recently we presented the measurement of radial velocities for the GCs in NGC 4636 in the companion paper (Park et al., 2009a, hereafter Paper I), and we present a detailed kinematic analysis of these data in this paper.
NGC 4636 is an E/S0 galaxy in Virgo. It is located (2.8 Mpc at the distance of NGC 4636) south east from the Virgo center, and is considered to be a major member of a small group falling into the Virgo center (Nolthenius, 1993; Trinchieri et al., 1994). NGC 4636 is relatively less luminous ( mag) among the gEs in Virgo. It shows several interesting structures in the central region: jets in the radio images, arm-like structures, bubbles, and a cavity in the X-ray images (O’Sullivan et al., 2005; Baldi et al., 2009), and dust emission in the far-infrared (100) image (Temi et al., 2003). It is notable that the faint isophotes in the outer region of NGC 4636 are much flatter (E4) than those in the inner region (E0), indicating that this galaxy may be in the transition to S0 (Sandage, 1961). This fact may imply the presence of large-scale angular momentum associated with recent mergers. We adopted a distance to NGC 4636, 14.7 Mpc [], as given by Tonry et al. (2001) based on the surface brightness fluctuation method. One arcmin in the sky at this distance corresponds to kpc. Effective radius, ellipticity, and position angle of NGC 4636 are kpc, , and PA deg, respectively (Kim et al., 2006; Park et al., 2009b).
This paper is composed as follows. Section 2 gives a brief description of the data used in this analysis, and the kinematic properties of the GC system in NGC 4636 are derived in §3. In §4, we compare kinematic properties of the NGC 4636 GC system to those of other gEs, and discuss the implication of the results regarding the GC formation models. Primary results are summarized in the final section.
2 Data
We used the spectroscopic data of the GCs given in Paper I, which describes the details of the spectroscopic observation, data reduction, and the data set. Here we only give a brief summary of the data set of NGC 4636 GCs. We selected GC candidates in deep, wide-field Washington C and images () obtained at KPNO 4m telescope (Park et al., 2009b). Spectroscopic observations of these targets were made using the Multi-Object Spectroscopy (MOS) mode of Faint Object Camera and Spectrograph (FOCAS) on the SUBARU 8.2m Telescope.
We determined the radial velocities for 122 objects including 105 GCs, 11 foreground stars, 2 background galaxies, 3 probable intracluster GCs in Virgo, and the nucleus of NGC 4636, by cross-correlating the target spectra with five Galactic GCs as templates. Paper I presented a master catalog of the radial velocities for the GCs in NGC 4636 combining their data with the data for 174 GCs given by Schuberth et al. (2006). The radial velocities of GCs in Schuberth et al. (2006) were transformed into our velocity system using equation (1) in Paper I, and the transformed velocities were used for further analysis.
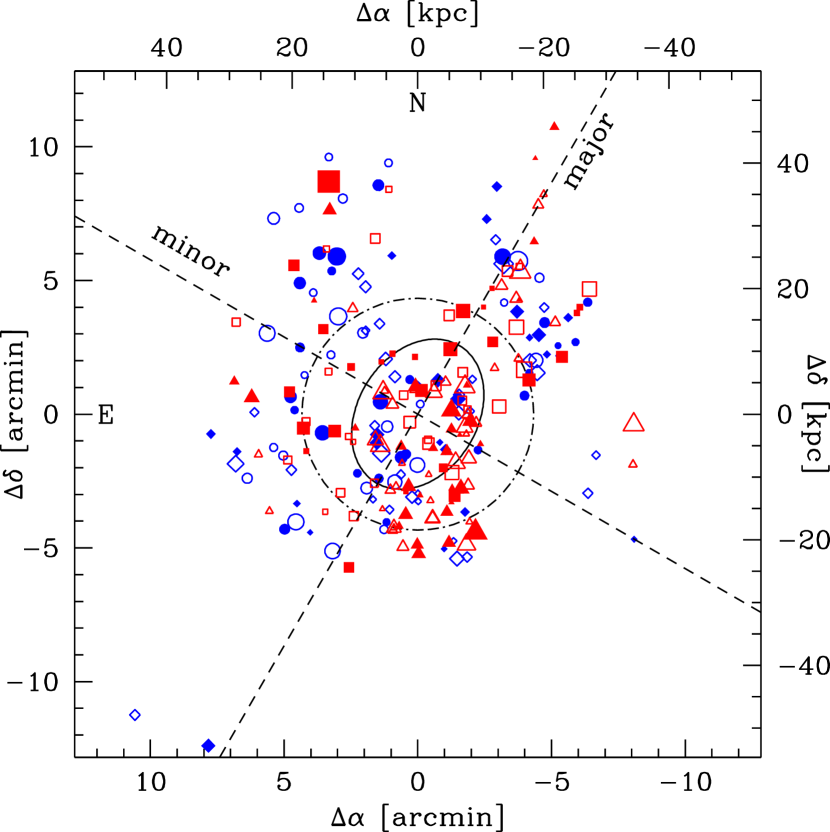
Of the entire spectroscopic sample of GC candidates we selected 238 member GCs of NGC 4636 in Paper I using radial velocities () and () colors (). There are 108 blue GCs () and 130 red GCs () in the total sample. In Figure 1, we show the spatial distribution of the objects in NGC 4636 with measured velocities. It shows that the spatial segregation of high-velocity GCs (open symbols) and low-velocity GCs (filled symbols) is not clearly seen, which indicates that the rotation of the GC system is, if any, weak (to be discussed in §3.1).
3 Results
We have investigated the kinematic properties of the GC system using the master catalog of 238 GCs in NGC 4636 (Paper I): the rotation amplitude, the position angle of the rotation axis, the mean line-of-sight velocity, the projected velocity dispersion, and the velocity ellipsoid. Côté et al. (2001) and Côté et al. (2003) presented detailed analysis of the kinematics of the GC systems in M87 and M49, respectively. We adopted the analysis method used by these studies for the following analysis, as done for the M60 GC system (Hwang et al., 2008).
3.1 Rotation of the GC System
First we derive the rotational property of the GC system in NGC 4636. We made assumptions to derive the intrinsic rotational velocity field from the radial velocity data: (a) the GC system is spherically symmetric with an intrinsic angular velocity field stratified on spheres, and (b) that the GC rotation axis lies in the plane of the sky. With these assumptions, it is expected that radial velocities of GCs depend, if they follow any overall rotation, sinusoidally on the azimuthal angles. For the NGC 4636 GC system, the assumption of spherical symmetry of the GC system is reasonable due to the modest projected ellipticity (effective ellipticity, ).
Thus we can determine the amplitude and axis of the rotation, fitting the observed line-of-sight velocities () of the GCs with the function,
| (1) |
where is the projected position angle of a GC relative to the galaxy center measured from north to east, is the projected position angle of the rotation axis of the GC system, is the projected galactocentric distance, () is the rotation amplitude, and is the systemic velocity of the GC system.
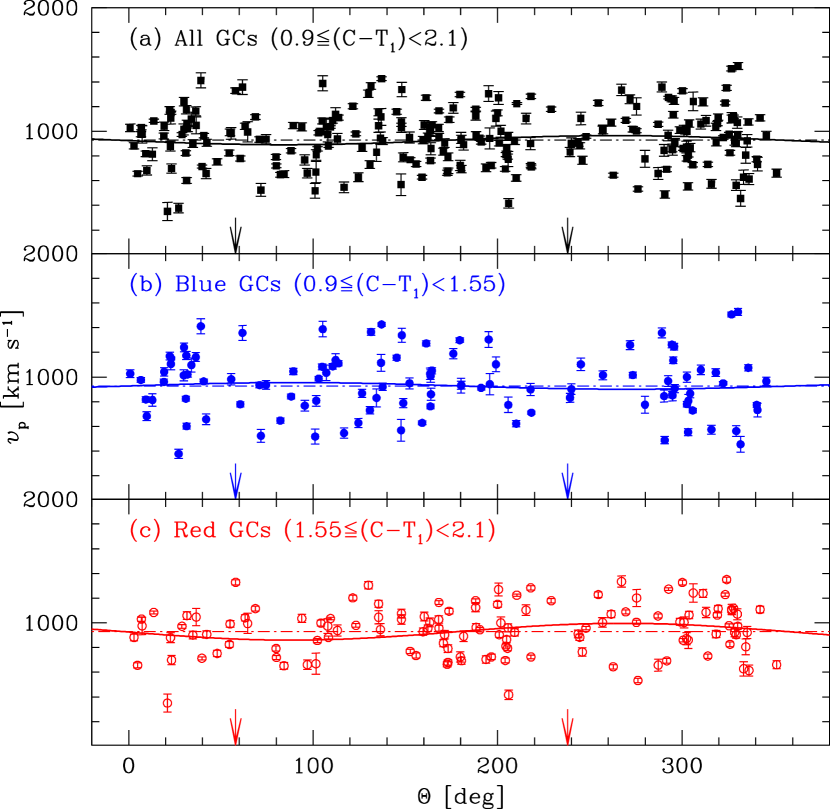
Figure 2 displays the radial velocities of GCs with measured uncertainties as a function of position angle for all 238 GCs (top), 108 blue GCs (middle), and 130 red GCs (bottom). We overlaid the best fit rotation curve of equation (1) for each sample. For fitting the data we used an error-weighted, nonlinear fit of equation (1) with as a fixed value of the velocity of the NGC 4636 nucleus ( km s-1) rather than as a free parameter for a better fitting. We estimated, using the biweight location of Beers et al. (1990), the systemic velocity of the GC system to be km s-1 (see §3.2), which agrees with the velocity of the NGC 4636 nucleus.
The values of the rotation amplitudes () we derived are km s-1 for all the GCs, km s-1 for the blue GCs, and km s-1 for the red GCs. Thus, all the GCs and the blue GCs show little rotation, while the red GCs show a marginal hint of rotation. Our results are consistent with those based on a smaller sample of 174 GCs in Schuberth et al. (2006) who derived km s-1 for all the GCs, km s-1 for the blue GCs, and km s-1 for the red GCs.
The orientation of the rotation axis () is estimated to be for all the GCs, for the blue GCs, and for the red GCs. The orientations of rotation axes for all subsamples appear to be similar, and they are closer to the photometric major axis, showing that the GCs rotate around the major axis (). This result is in contrast with the result given by Schuberth et al. (2006) who derived for all the GCs, and for the red GCs, showing that the GCs rotate around the minor axis. If we use only the data given by Schuberth et al. (2006), we get similar values to those given by Schuberth et al. (2006). Therefore, the difference in the orientation between the two studies is due to the difference in the sample.
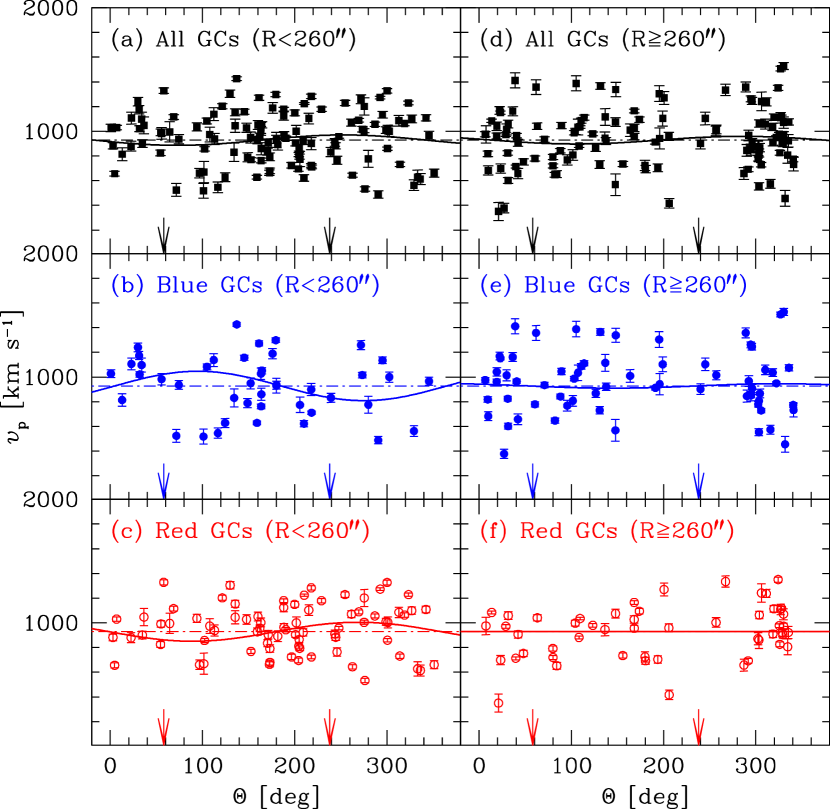
In Figure 3, we present the rotation of the GC system for the samples of different radial bins in order to investigate any radial variation of rotational properties. We divided the GCs into two groups: the GCs in the inner region at and those in the outer region at . Each of the sub regions includes a similar number of GCs (120 and 118, respectively). We applied the same fitting procedure as used for the results in Figure 2 for all the GCs, the blue GCs, and the red GCs in each radial bin.
Interestingly both the blue GCs and red GCs show some rotation around the major axis in the inner region ( km s-1, and km s-1, respectively), while both subsamples show little rotation in the outer region. The rotation of the red GCs seen for the entire radial range is found to be mainly due to the red GCs in the inner region. Little rotation is seen for all the GCs even in the inner region, although both the blue GCs and red GCs show measurable rotation in the inner region. This is because the blue GCs and red GCs rotate in the opposite direction to each other, canceling the rotational effect for all the GCs.
3.2 Velocity Dispersion of the GC System
We summarize the kinematics of the NGC 4636 GC system derived in this study in Table 1. Several kinematic parameters for all the GCs, the blue GCs, and the red GCs are presented for the entire region, the inner region, and the outer region. The column (1) defines the range of the projected radial distance from the center of NGC 4636 for each region in arcsec, and the column (2) gives the mean value of the radial distance in arcsec. The number of GCs in each region is shown in the column (3). The columns (4) and (5) represent the mean line-of-sight velocity (the biweight location of Beers et al. 1990) and the velocity dispersion about this mean velocity (the biweight scale of Beers et al. 1990), respectively. The position angle of the rotation axis and the rotation amplitude estimated using equation (1) in each region are given in the columns (6) and (7), respectively. The column (8) gives the velocity dispersion about the best fit rotation curve (). The column (9) gives the absolute value of the ratio of the rotation amplitude to the velocity dispersion about the best fit rotation curve. The uncertainties of these values represent confidence intervals that are determined from the numerical bootstrap procedure following the method of Côté et al. (2001).
The velocity dispersion for all 238 GCs is estimated to be km s-1. This result is consistent, within the uncertainty, with the value given by Schuberth et al. (2006) who used 174 GCs, km s-1. In addition, it is found that the velocity dispersion about the mean velocity of the GC system for the blue GCs ( km s-1) is 46 km s-1 larger than that for the red GCs ( km s-1). We found a similar result for the velocity dispersion about the best fit rotation curve: km s-1 for the blue GCs, and km s-1 for the red GCs. Our result for the red GCs is similar to the value given by Schuberth et al. (2006), km s-1, within the uncertainty. However, our value for the blue GC is approximately 50 km s-1 larger than that given by Schuberth et al. (2006), km s-1.
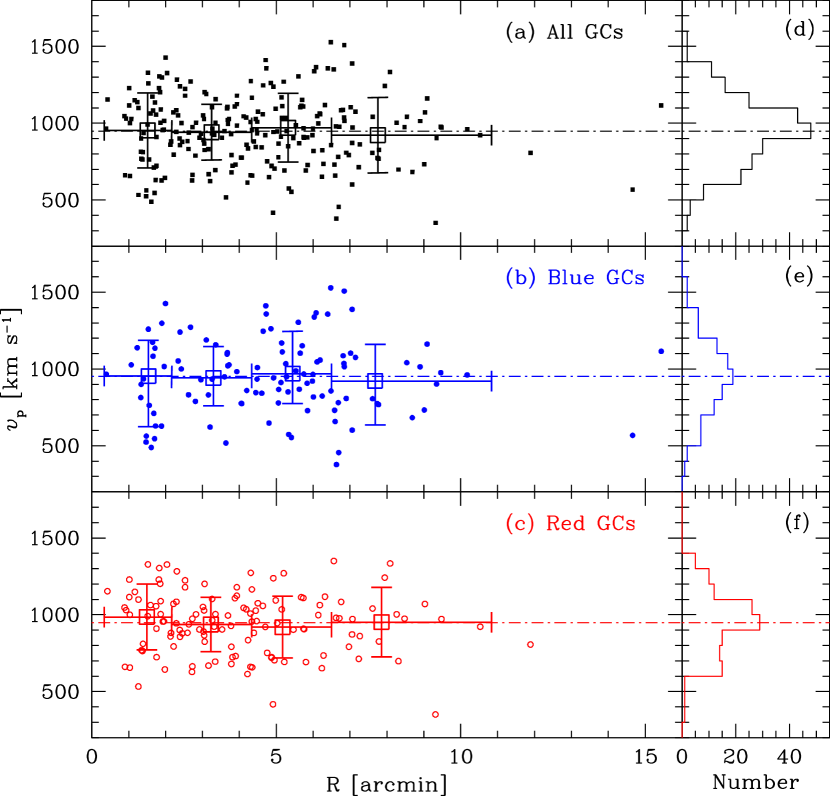
Figure 4 displays the radial velocities of GCs with measured uncertainties against projected galactocentric distances. The mean radial velocities in four radial bins are overlaid by squares with long horizontal error bar. The velocity dispersion about the mean velocity in each bin is also represented by a vertical error bar. The mean velocities of all samples agree well with the systemic velocity of NGC 4636.
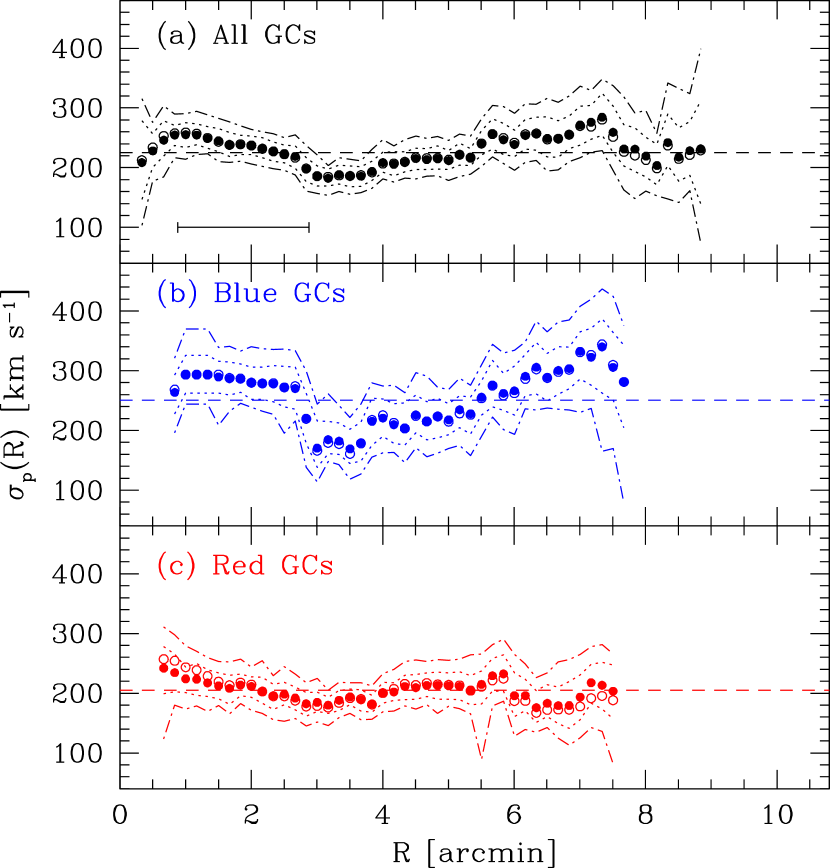
To investigate the radial variation of velocity dispersion in detail, we present a smoothed radial profile of velocity dispersion about the mean radial velocity (filled symbols) and about the best fit rotation curve (open symbols) in Figure 5. We calculate the velocity dispersion of the GCs lying within a radial bin with fixed width, kpc as increasing the bin center by a fixed step width, kpc. We set the radial width and the step width so that the number of GCs per bin exceeds 10, and the calculation stops when the number of GCs in a bin is smaller than 10.
The velocity dispersion for all the GCs varies more or less (about 50 km s-1) around the mean value for the range of radius. However, the velocity dispersion for the blue GCs shows an abrupt decrease from km s-1 to km s-1 at , and then keeps increasing with increasing radius to km s-1 at . On the other hand, the velocity dispersion for the red GCs stays almost constant at km s-1 from the center out to , shows a slight decrease of km s-1 for , and increases slightly at . The velocity dispersions about the best fit rotation curves of all three samples are not much different from those about the mean radial velocities (also see Table 1).
3.3 Velocity Anisotropy of the Globular Cluster System
Assuming that the NGC 4636 GC system is spherically symmetric, we can apply the Jeans equation in the absence of rotation to the dynamical analysis of the GC system. The spherical Jeans equation is represented by
| (2) |
where is a three dimensional radial distance from the galactic center, is a three dimensional density profile of the GC system, is a radial component of velocity dispersion, is a velocity anisotropy, is the gravitational constant, and is a total gravitating mass contained within a sphere of radius (e.g., Binney & Tremaine 1987). is a tangential component of velocity dispersion that is equal to an azimuthal component of the velocity dispersion, , in the absence of rotation of the GC system.
There are two approaches to the dynamical analysis of the GC system: a) to derive the mass profiles of the host galaxy for given orbits of the GCs, or b) to determine the orbital properties of the GCs for a given mass profile of the host galaxy. Several studies on the dynamics of the GC system have focused on determining the gravitational mass, , using the Jeans equation by assuming a simple isotropic orbit with (e.g., Cohen & Ryzhov 1997; Minniti et al. 1998; Zepf et al. 2000; Schuberth et al. 2006).
However, with an aid of an independent determination of the mass profile of an elliptical galaxy using X-ray data (e.g., Brighenti & Mathews 1997; Matsushita et al. 1998; Loewenstein & Mushotzky 2003 for NGC 4636), the velocity anisotropy itself can be investigated (e.g., Romanowsky & Kochanek 2001; Côté et al. 2001, 2003; Hwang et al. 2008). Following the analysis of the M87 GC system by Côté et al. (2001), the M49 GC system by Côté et al. (2003), and the M60 GC system by Hwang et al. (2008), we first derive the three dimensional density profile of the GC system, and the total mass profile, . Comparing the velocity dispersion profile (VDP) calculated from the Jeans equation with the observed VDP, , we determine the velocity anisotropy of the NGC 4636 GC system.
3.3.1 Density Profiles for the GC system
Here we derive the three dimensional density profiles from the surface number density of NGC 4636 GCs for two models: the NFW profile (Navarro et al., 1997) and the Dehnen profile (Dehnen, 1993). We used the surface number density profiles of NGC 4636 GCs given in Park et al. (2009b). They derived the surface density profile of NGC 4636 GCs by combining the HST/WFPC2 archive data for the inner region at , and the KPNO data for the outer region at . They adopted the background levels of the mean surface number density from Dirsch et al. (2005) at : per square arcmin for all the GCs, per square arcmin for the blue GCs, and per square arcmin for the red GCs. Then they subtracted these background values from the original number counts to produce the radial profiles of the net surface number density of GCs. Since they selected GCs that are brighter than mag, it is needed to correct the surface number density profile in order to account for the uncounted GCs due to the limiting magnitude. To calculate the correction factor, the equation (11) in McLaughlin (1999) with was used on the assumption that the GC luminosity function of NGC 4636 has a Gaussian shape with a peak at mag and a dispersion mag (Dirsch et al., 2005). It is found that the surface number density of the bright NGC 4636 GCs in Park et al. (2009b) should be multiplied by 2.62 to derive the total surface number density.
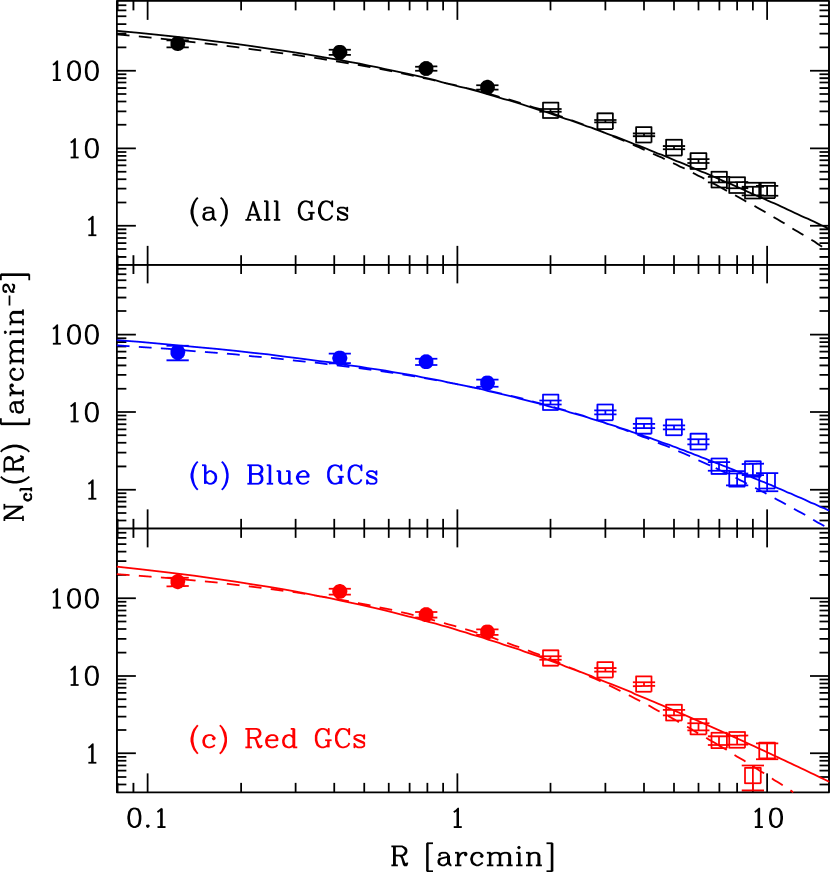
We display the total surface number density profiles, , for the combined, blue and red GCs in Figure 6. We fit the surface number density profile with the projection of the NFW profile, and with the projection of the Dehnen profile, . The surface number density profile, , is derived from the integration of the three dimensional density profile as follows:
| (3) |
The solid and long dashed lines represent the projected best fit curves of the NFW profile and of the Dehnen profile, respectively. The fitting results for the combined (C) GCs, blue (B) GCs, and red (R) GCs are summarized as follows:
| (4) |
for the NFW profile, and
| (5) |
for the Dehnen profile.
It is found that the scale length of the red GCs in the NFW profile is more than twice smaller than that of the blue GCs. This shows that the red GCs are more concentrated toward the galaxy center than the blue GCs.
3.3.2 An Extended Dark Matter Halo in NGC 4636
We investigate the existence of an extended dark matter halo comparing the velocity dispersion profile expected from the stellar mass profile with the measured profiles of stellar and GC velocity dispersions for NGC 4636. We first derive the stellar mass profile from the surface brightness profile. Then we obtain the velocity dispersion profile expected from the stellar mass profile, which will be compared with the measured dispersion profiles for the GCs.
In the left panel of Figure 7, we plot the surface brightness profile of NGC 4636 derived from our KPNO -band images (Park et al., 2009b) compared to those in Peletier et al. (1990); Dirsch et al. (2005) for the -band photometry. We converted photometry of Park et al. (2009b) to Cousins -band photometry using the relation given by Geisler (1996). It is seen that the profiles from this study, Peletier et al. (1990), and Dirsch et al. (2005) agree well over the radius.
We fit the surface brightness profile derived from the KPNO images (Park et al., 2009b) with the projection of three dimensional luminosity density profile used in Côté et al. (2003), which is represented by,
| (6) |
We obtain, from the fit, the values for the parameters, , , and kpc, and overlay the projected best fit curve in Figure 7. We also derive a value for the effective radius of kpc, which is larger than that from a fit ( kpc at -band) using a de Vaucouleurs law in Park et al. (2009b).
In the right panel of Figure 7, we show a three dimensional stellar mass density profile, , with -band mass-to-light ratio (to be discussed later in this section). From the three dimensional stellar mass density profile we derive a stellar mass profile of NGC 4636 that is represented by
| (7) | |||||
We used this stellar mass profile to determine the velocity anisotropy for the NGC 4636 stellar system and to test the existence of an extended dark matter halo. If we take and substitute by , then we can compute the radial component of velocity dispersion profiles (VDPs) of the stars through the Jeans equation by assuming the values for -band mass-to-light ratios () and velocity anisotropies of the stellar system []. We therefore obtain the projected VDPs for the stellar system from the radial component of VDPs through the equation (11) in Section 3.3.4.
In Figure 8, we plot the stellar VDP for the inner region () of NGC 4636 given in Bender et al. (1994) and the GC VDP derived in this study. The stellar VDP is almost constant around 200 km s-1 in the inner region, and is smoothly connected to the GC VDP at kpc that is increasing as the radius increases. Note that the GC VDP varies much more than the stellar VDP. In Figure 8, we also show the projected VDPs calculated with , (isotropic), and , (tangentially biased), which are the best fit curves for the stellar kinematic data of Bender et al. (1994) at kpc. These values for the mass-to-light ratio and velocity anisotropy for the stellar system are similarly found in the “best-fitting” halo model using -band photometry of NGC 4636 by Kronawitter et al. (2000).
For the comparison, we also present the projected VDPs calculated using the same stellar mass profile as above, but for the GC number density profile and for 0.99 (radially biased; upper long dashed line), –99 (tangentially biased; lower long dashed line), 0.0 (isotropic; short dashed line). Interestingly, none of these models can account for the observed VDPs for the GCs at kpc, indicating that mass-to-light ratio is not constant over the galactocentric distance, but should increase as the distance increases. This demonstrates that there exists an extended dark mater halo in the outer region of NGC 4636.
3.3.3 X-ray Mass Profiles
There are several studies that presented the X-ray mass profiles of NGC 4636 (e.g., Mushotzky et al. 1994; Brighenti & Mathews 1997; Matsushita et al. 1998; Loewenstein & Mushotzky 2003; Johnson et al. 2009), as displayed in Figure 9. Brighenti & Mathews (1997) derived a mass profile of NGC 4636 using Einstein HRI observational data of Trinchieri et al. (1986) and ROSAT PSPC observational data of Trinchieri et al. (1994). They presented a functional form of the mass profile, which is used for the analysis of velocity anisotropy in this study. Their mass profile agrees well with that given by Mushotzky et al. (1994) who used ASCA SIS data.
Loewenstein & Mushotzky (2002, 2003) determined a mass profile of NGC 4636 using Chandra and XMM-Newton X-ray data. They showed that the total mass of NGC 4636 increases as to a good approximation from 0.7 to 35 kpc with at the outermost point. Recently Johnson et al. (2009) derived a mass profile for the inner region of NGC 4636 using the Chandra data. It agrees well with other profiles (Mushotzky et al., 1994; Brighenti & Mathews, 1997; Loewenstein & Mushotzky, 2003) for kpc, while it is much steeper than the others for kpc.
Matsushita et al. (1998) also derived a total mass profile of NGC 4636 using ASCA GIS observations, but they did not present the information on the parameters of the mass profile. So we read the mass profile in their Figure 3 and re-derive the mass profile in the functional form following the approach of Côté et al. (2003) for M49. Côté et al. (2003) considered that the total mass interior to any radius is the sum of dark matter mass (eq. 8) and stellar mass (eq. 7). If the dark matter density profile is the NFW halo model, , the mass profile for dark matter halo is represented by
| (8) | |||||
where is the dark matter density normalization and is a scale length.
Fixing with mass-to-light ratio , we fit the mass profile given by Matsushita et al. (1998) with the total mass profile that is the sum of dark matter mass (eq. 8) and stellar mass (eq. 7). Thus we determine kpc-3 and kpc.
Then the final mass models of NGC 4636 are
| (9) | |||||
In Figure 9, we plot the stellar mass profile (dotted line), the dark matter halo (long-dashed line), and the total mass profile (dot-dashed line) derived from this method.
While four mass profiles given by Mushotzky et al. (1994); Brighenti & Mathews (1997); Loewenstein & Mushotzky (2003); Johnson et al. (2009) show monotonic increase with increasing radius, only the mass profile given by Matsushita et al. (1998) shows a flattening at kpc, and then keeps increasing thereafter out to kpc. From this comparison we conclude that the mass profile for kpc given by Matsushita et al. (1998) may be in error. Since X-ray mass profiles that account for the dark matter halo are similar to or larger than the stellar mass profile at kpc, we consider that the X-ray mass profiles are good enough to determine the velocity anisotropy of the GC system for the following analysis.
3.3.4 Determination of the Velocity Anisotropy
The velocity anisotropy of GCs is determined as follows. First, assuming the velocity anisotropy [] in prior, we derive the theoretical projected VDP [] and theoretical projected aperture VDP [] using the Jeans equation. The projected aperture VDP is the velocity dispersion of all objects interior to a given projected radial distance . To obtain those theoretical VDPs, we use the GC number density profile [] of the combined, blue, and red GCs and the mass profile [] derived in the previous section. Second, from the comparison of these calculated VDPs with measured VDPs, we determine the velocity anisotropy of GCs.
We begin by deriving the theoretical projected VDPs. The spherical Jeans equation (eq. 2) can be solved for the radial component of velocity dispersion, :
| (10) | |||||
Then the projected VDP, can be derived by
| (11) |
.
The projected aperture VDP, , can be computed by
| (12) | |||||
where is the projected galactocentric distance of the innermost data point in the GC sample ( kpc in this study).
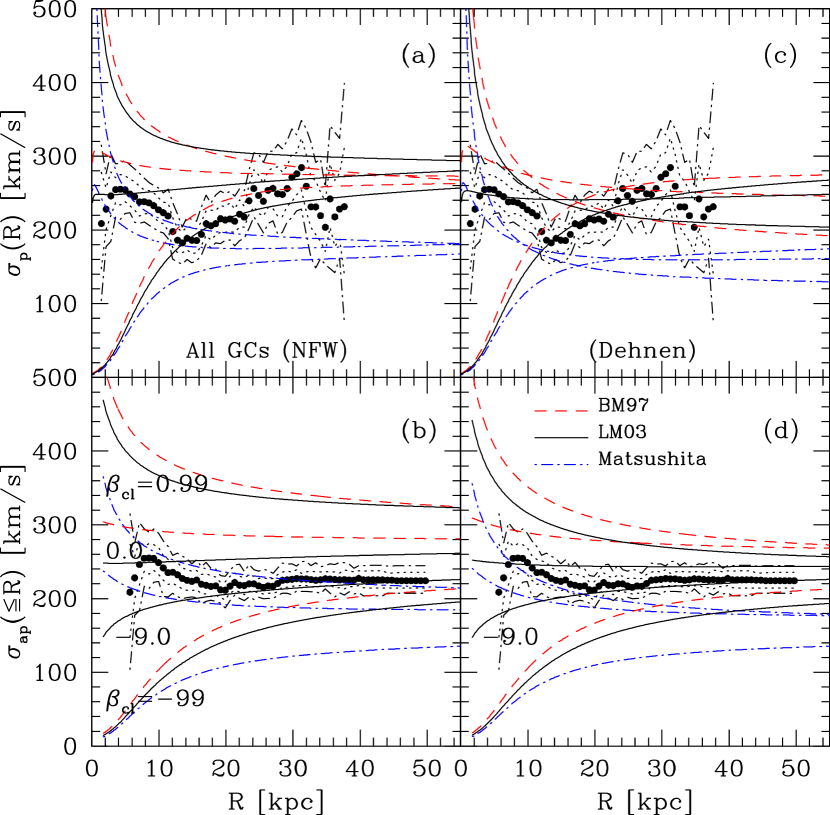
We present the measured VDP in comparison with the VDPs calculated by assuming several velocity anisotropies in Figures 10 and 11. The left and right panels in Figure 10 show the VDPs calculated using the NFW profile and the Dehnen for the GC number density, respectively. The upper panels show the projected VDPs, and the lower panels show the projected aperture VDPs. The measured dispersion data taken from Figure 5 are shown by filled circles along with their confidence intervals. The projected aperture VDPs in the lower panels are plotted in the similar fashion to the case of the upper panels.
The mean velocity dispersion for the outer part shows a difference by a factor of between the VDP profiles based on Matsushita et al. (1998) and those on Brighenti & Mathews (1997) and Loewenstein & Mushotzky (2003). This is because the mass in the outer part derived from Brighenti & Mathews (1997) and Loewenstein & Mushotzky (2003) is about twice larger than that from Matsushita et al. (1998). As a result, the system of all the GCs has a tangentially biased velocity ellipsoid () for the mass profiles by Brighenti & Mathews (1997) and Loewenstein & Mushotzky (2003), but has a radially biased velocity ellipsoid () for the Matsushita et al. (1998) mass profile, in Figure 10 (a,b) based on the NFW profile for the GC number density. A similar result can be found in Figure 10 (c,d) based on the Dehnen profile for the GC number density. We tried an eye-ball fit to the data for the outer region of NGC 4636, finding that the VDP profile with (derived for the Loewenstein & Mushotzky (2003) mass profile) fits approximately the data for kpc (shown by the solid lines labeled with in (b) and (d)).
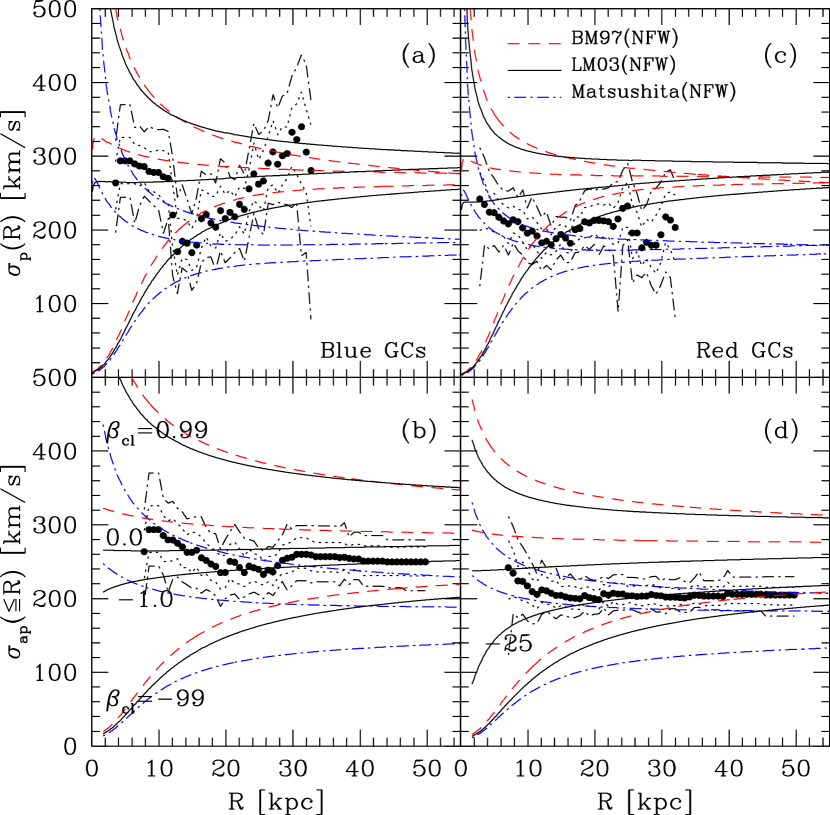
In Figure 11, we show a similar analysis for the blue (left panels) and red GCs (right panels) based on the NFW profile for the GC number density. These figures show similar trends to those for all the GCs. They have a tangentially biased velocity ellipsoid () for the Brighenti & Mathews (1997) and Loewenstein & Mushotzky (2003) mass profiles, while they have a radially biased velocity ellipsoid () for the Matsushita et al. (1998) mass profile. When we compare the velocity anisotropies between the blue and red GCs by fixing the mass profile, we find the velocity anisotropies of the red GCs by the Brighenti & Mathews (1997) and Loewenstein & Mushotzky (2003) mass profiles are slightly more tangential than those of the blue GCs in Figure 11. These trends are similar to the velocity anisotropies based on the Dehnen profile for the GC number density, too, although they were not plotted in Figure 11. We tried an eye-ball fit to the data for kpc, finding that the VDP profiles with and –25 (derived for the Loewenstein & Mushotzky (2003) mass profile), fit approximately the data for the blue GCs and red GCs, respectively (shown by the solid lines labeled with and –25, respectively, in (b) and (d)). It is noted that the velocity dispersion for the blue GCs increases as decreases so that the orbit of the blue GCs becomes radial in the inner region at kpc.
Since we concluded that the mass profile given by Matsushita et al. (1998) may be in error before, we adopt finally the results based on the mass profile given by Loewenstein & Mushotzky (2003) (that is also similar to that given by Brighenti & Mathews (1997)). In summary, it is found that the orbit of the GC system in NGC 4636 is tangential. The orbits of both the red GCs and blue GCs are tangential, and the orbits of the red GCs is slightly more tangential than that of the blue GCs.
4 Discussion
4.1 GC Kinematics and the Global Properties of gEs
In this section, we combine the kinematic properties of the GC systems in gEs by including the results for the NGC 4636 GC system in this study, those for the NGC 1407 GC system (172 GCs) given in Romanowsky et al. (2009), and those for the GC systems in other gEs in Hwang et al. (2008). Hwang et al. (2008) analyzed the velocity data of 276 GCs in M87 (Côté et al., 2001), 263 GCs in M49 (Côté et al., 2003), 435 GCs in NGC 1399 (Richtler et al., 2004), 341 GCs in NGC 5128 (Woodley et al., 2007), 121 GCs in M60 (Lee et al., 2008a), and 172 GCs in NGC 4636 (Schuberth et al., 2006), using the similar method adopted in this study (see also Romanowsky et al. 2009). We derived the kinematic parameters of the NGC 1407 GCs from the data in the catalog given by Romanowsky et al. (2009) using the same analysis as used for other gEs in this study, and listed the results in Table 2. The information on the host galaxies is listed in Table 3, and the global kinematics of GCs in gEs are summarized in Table 4.
The velocity dispersion of the GCs in NGC 4636 is similar to that of the M60 GCs ( km s-1), although NGC 4636 is about one magnitude fainter than M60. This indicates that the mass to luminosity ratio is larger in NGC 4636 than in M60. The velocity dispersion of the GCs in NGC 4636 is much smaller than those for the three brightest gEs (M87, M49 and NGC 1399). However, the velocity dispersion of the GCs in NGC 4636 is about twice larger than than that of NGC 5128 GCs ( km s-1), although NGC 4636 is slightly fainter than NGC 5128.
The rotation-corrected velocity dispersion, of the blue GCs in NGC 4636 is larger than that of the red GCs. This trend is similarly seen in the three X-ray brightest gEs. However it is opposite in the case of M60, and the rotation-corrected velocity dispersions of both blue and red GCs are similar in NGC 5128 and NGC 1407. The rotation-corrected velocity dispersion ranges from 129 km s-1 (NGC 5128) to 399 km s-1 (M87) for all the GCs, and similarly for the blue GCs and red GCs. The rotation amplitude ranges from 30 km s-1 (NGC 5128) to 172 km s-1 (M87) for all the GCs, and similarly for the blue GCs and red GCs. The ratio of the rotation amplitude to the rotation-corrected velocity dispersion ranges from 0.10 (NGC 1399) to 0.65 (M60). M87 and M60 show much stronger rotation with than the others.
We investigate any dependence of the kinematic properties of the GC systems in gEs on the global properties of their host galaxies. We calculated the Spearman’s correlation coefficient () and its significance () to check any correlation between parameters, and used the bisector method (Isobe et al., 1990) to do linear fits for correlated pairs of parameters.
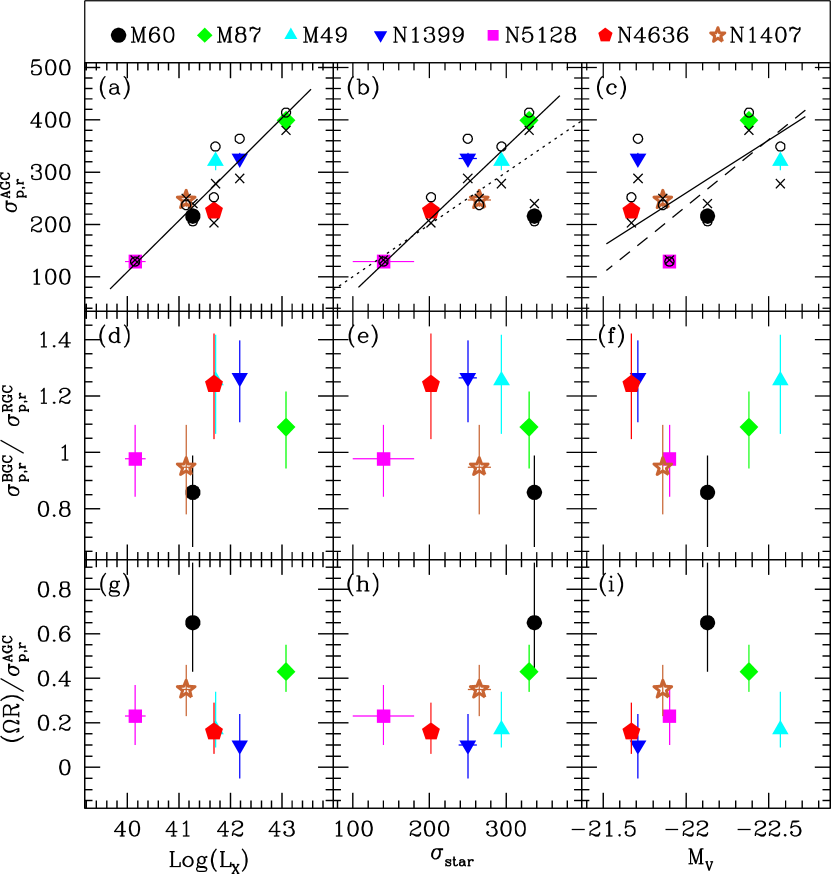
Figure 12 displays three kinematic parameters (the rotation-corrected velocity dispersion for all the GCs, (as well as the blue and red GCs), the ratio of the rotation-corrected velocity dispersion between the blue GCs and red GCs, , and the ratio of the rotational velocity to the rotation-corrected velocity dispersion for all the GCs, ) versus three global parameters (X-ray luminosity, log , stellar velocity dispersion, , and total -band magnitude, ) for the gEs, where the rotation-corrected velocity dispersion means the velocity dispersion about the best fit rotation curve. Here the stellar velocity dispersion represents the mean value of the velocity stellar dispersion at for given galaxy: NGC 1399 (Saglia et al., 2000), NGC 5128 (Wilkinson et al., 1986), NGC 1407 (Spolaor et al., 2008) and other galaxies (Bender et al., 1994) .
The rotation-corrected velocity dispersion for all the GCs shows a strong correlation with the X-ray luminosity and stellar velocity dispersion, and a weaker correlation with the total -band magnitude, as seen in Figure 12(a), (b) and (c). This shows that the rotation-corrected velocity dispersion for the GCs is an excellent indicator for the mass or luminosity of their host galaxies. It is noted that the stellar velocity dispersion of M60 is as large as that of M87 (see Fig. 12(b)), being much larger than that expected from its luminosity. This may be related with the presence of companion SBc galaxy NGC 4647 located at from M60, but the cause of this large stellar velocity dispersion of M60 is not known. M60 seems to be different from the other gEs in stellar velocity dispersion. Therefore we excluded any parameters for M60 related with the stellar velocity dispersion for the following correlation analysis.
Linear fits to the data yield: with rms = 28 km s-1, with rms = 31 km s-1, and with rms = 76 km s-1. In the case of and , the blue GCs show a stronger correlation than the red GCs: with rms = 32 km s-1 and the Spearman’s rank correlation coefficient for the blue GCs, and with rms = 27 km s-1 and for the red GCs. It is noted that the slope for the blue GCs (110.28) is steeper than that for the red GCs (84.04). On the other hand, it is opposite in the case of and . The red GCs show a stronger correlation than the blue GCs: with rms = 24 km s-1 and for the red GCs, and with rms = 46 km s-1 and for the blue GCs. It is noted that the slope for the blue GCs (1.538) is steeper than that for the red GCs (1.237).
The slope for the relation between and (solid line) is larger than one (dotted line). This indicates that the more massive gEs are, the more massive dark matter halo they have. The relation between and shows a larger scatter than that between and X-ray luminosity. However, NGC 1399 has an absolute magnitude much fainter than expected from its X-ray luminosity. If NGC 1399 is removed, the linear fit yields with a smaller scatter, rms = 65 km s-1 (dashed line in Fig. 12(c)). On the other hand, little correlation is seen between other pairs of parameters.
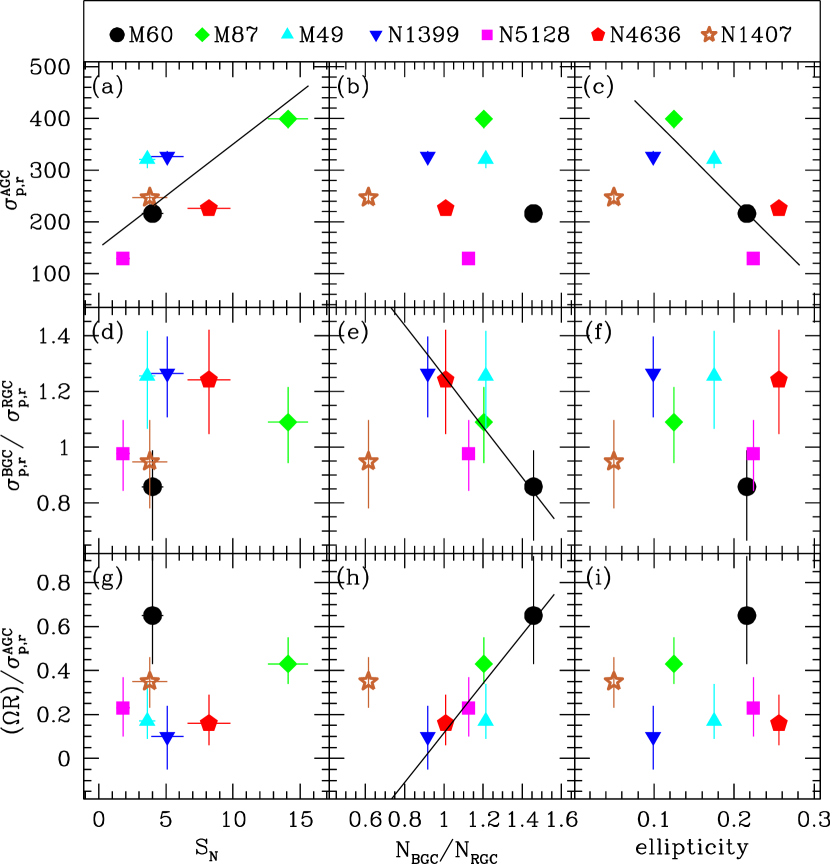
In Figure 13, we display the same three kinematic parameters versus three other global parameters (specific frequency, , the number ratio of the blue GCs and the red GCs, , and ellipticity, ) for the gEs. We find strong correlations for some pairs of parameters: (a) and , (b) and , (c) and , and (d) and . Linear fits to the data yield: with rms = 63 km s-1 (panel a), with rms = 57 km s-1 (panel c), with rms = 0.11 (panel e), and with rms = 0.09 (panel h). NGC 1407 shows much different relations including from those of other gEs so that we did not use NGC 1407 for linear fitting for (c), (e) , and (h). Thus the rotation-corrected velocity dispersion for all the GCs increases as increases, but this velocity dispersion decreases as ellipticity increases. decreases as increases, while increases as increases.
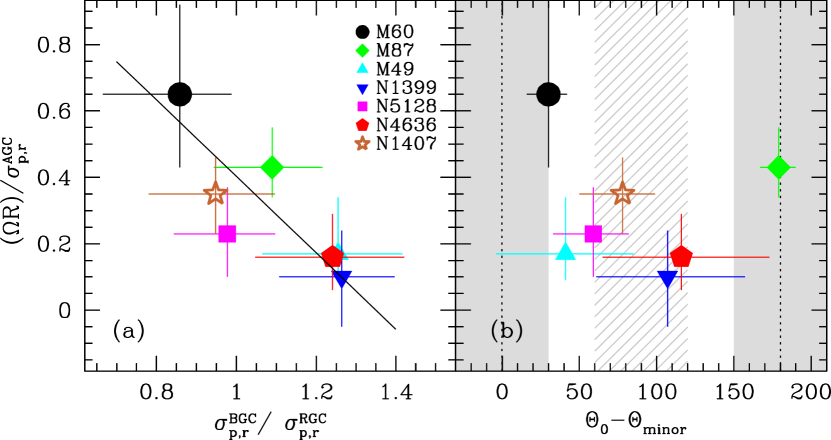
Figure 14(a) displays directly the relation between the velocity dispersion and rotational amplitudes of the GCs: The ratio of the velocity dispersion between the blue GCs and red GCs () vs. the ratio of the rotational velocity to the velocity dispersion for all the GCs (). It is found that has a strong correlation with : with rms=0.108. That is, the weaker the rotation is, the larger the velocity dispersion ratio between the blue GCs and red GCs is.
Figure 14(b) displays directly the relation between the rotational amplitudes and rotational axis of the GCs: The ratio of the rotational velocity to the velocity dispersion for all the GCs () vs. the difference between the GC rotation angle and the position angle of the minor axis of their host galaxies (). Interestingly it is seen that the GC rotation axis for the two gEs with the strongest rotation (M60 and M87) is approximately aligned with the minor axis of their host galaxies (the dotted lines in the shaded regions). This shows that the GC systems in gEs rotate around the minor axis of their host galaxies, once they have some strong rotation.
In Table 5, we summarized the results of the linear fits () given in Figures 12, 13, and 14. We listed the Spearman’s rank correlation coefficient () and its significance () in the 6th and 7th columns , respectively. These correlations found in this study provide strong constraints on modeling the GC systems in gEs (to be discussed in §4.3). Moreover, it is needed, in the future studies, to investigate which relation is the most fundamental one, if any, among several correlations between kinematic properties of the GC systems in gEs and the global parameters of their host galaxies found in this study.
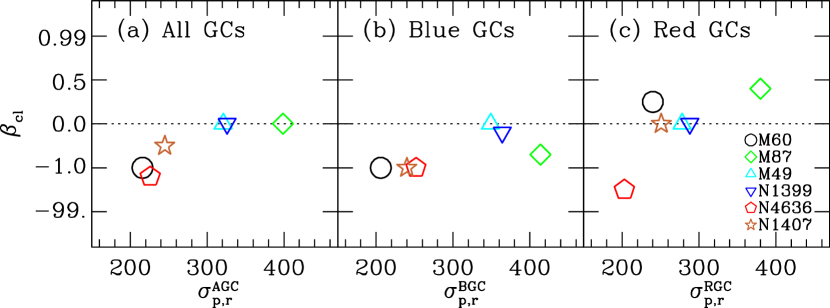
Figure 15 represents the velocity anisotropy versus the velocity dispersions for the GCs in 6 gEs (M60, M87, M49, NGC 1399, NGC 1407, and NGC 4636), determined in this study, Hwang et al. (2008) and Romanowsky et al. (2009). We consider , 0, –1, and –99, as the radial, isotropic, tangential, and strongly tangential velocity anisotropy, respectively. In the case of NGC 4636, we used the result derived for Loewenstein & Mushotzky (2003) mass profiles. All the GC systems in three gEs (M49, M87 and NGC 1399) show isotropic orbits, while those in two gEs (M60 and NGC 4636) show tangential orbits. It it noted also that more massive gEs (with larger GC velocity dispersion) have isotropic orbits, while less massive gEs have tangential orbits. The blue and red GCs in three gEs (M49, NGC 1399 and NGC 4636) show similar orbits, while those in two gEs (M60 and M87) show opposite orbits.
4.2 Radial Variation of the GC Kinematics for gEs
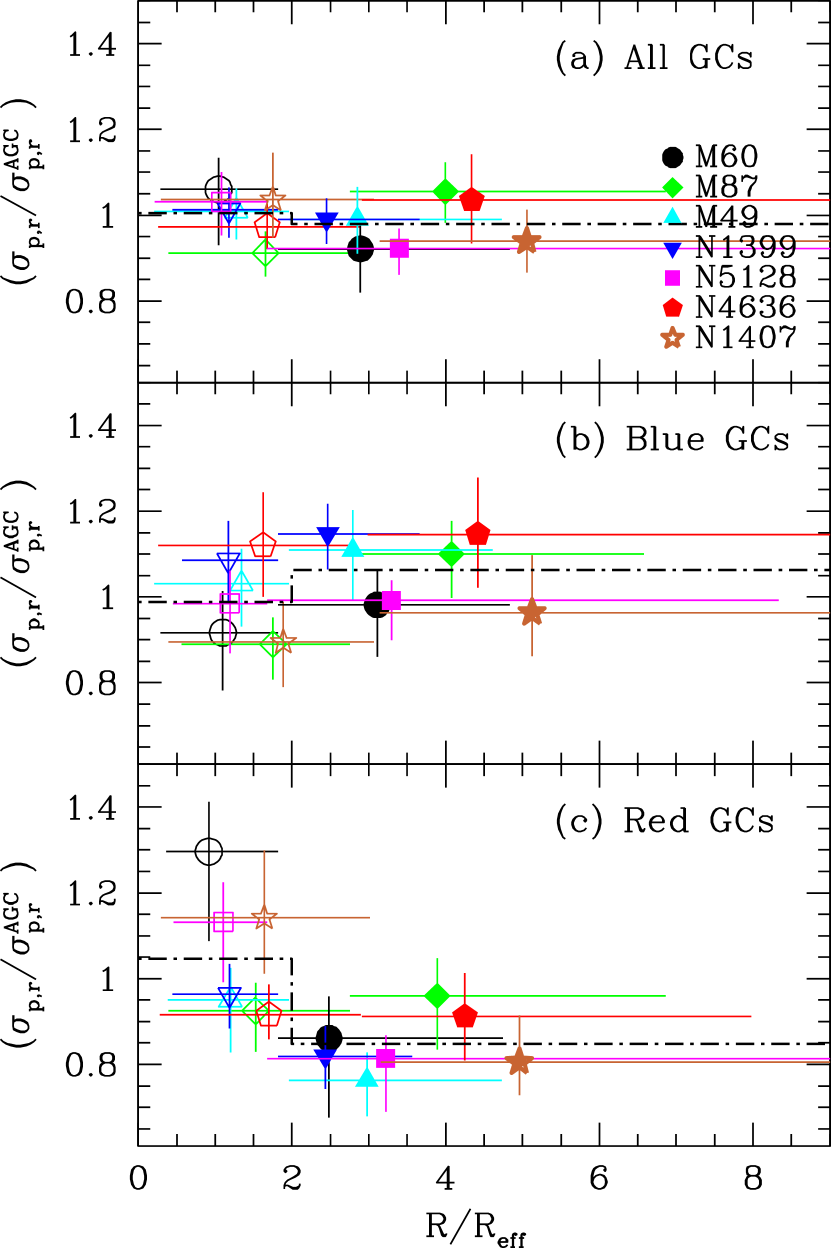
To investigate the radial variation of the kinematics of the GC systems in the gEs, we plot the rotation-corrected velocity dispersions () against the projected galactocentric distances in Figure 16. The rotation-corrected velocity dispersion is normalized by that of all the GCs in each gE. The projected galactocentric distance is normalized with respect to the effective radius of each gE, . The combined GCs do not show any significant change of the velocity dispersion over the whole region of a galaxy. However, the mean velocity dispersion for the red GCs in the inner region (), , is slightly larger than that in the outer region (), , while that for the blue GCs in the inner region is little different from that in the outer region. Note that the red GCs in M60, NGC 5128, and NGC 1407 have much larger in the inner region than in the outer region. Why the red GCs have larger velocity dispersion in the inner region than in the outer region is an interesting question to solve.
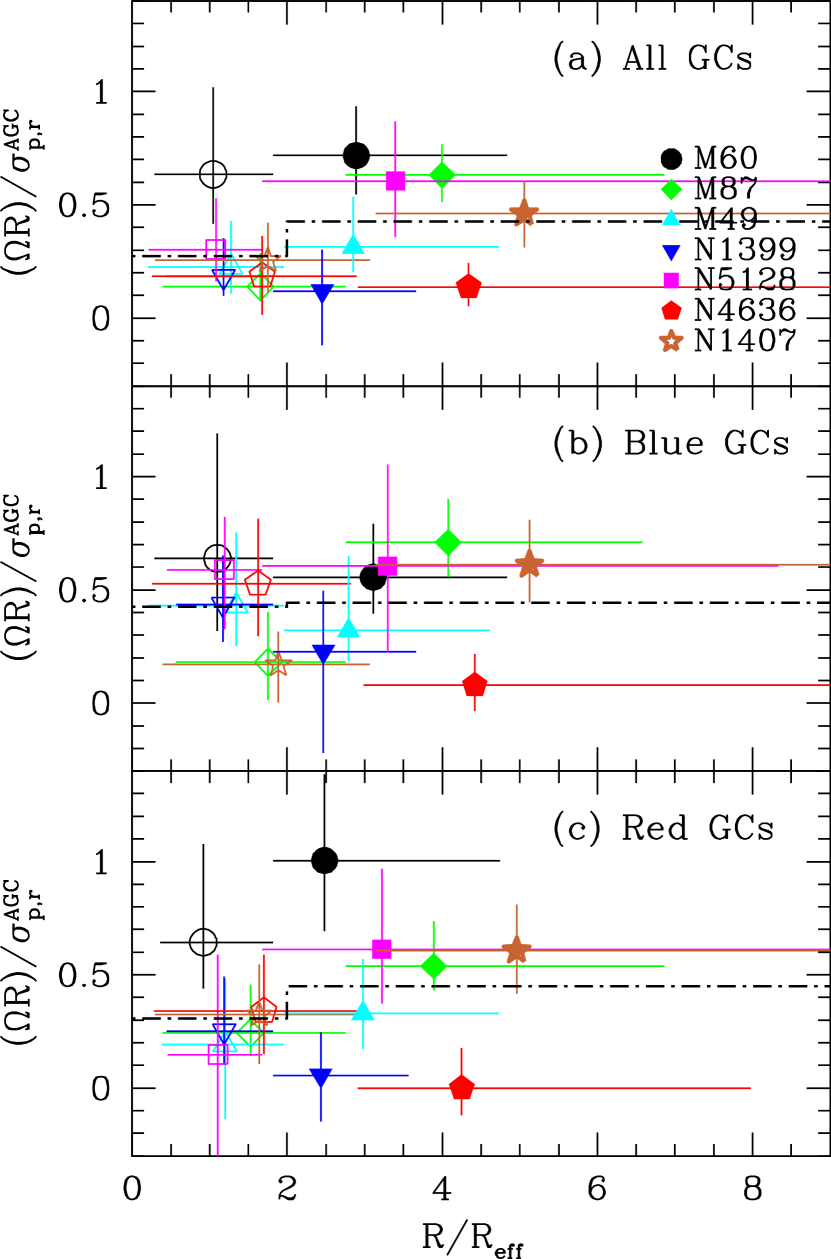
Figure 17 displays the ratio of the rotation amplitude to the rotation-corrected velocity dispersion () vs. the projected galactocentric distance normalized to the effective radius (). The combined GCs in M87, NGC 5128, and NGC 1407 show much larger in the outer region than in the inner region, while those in other galaxies show little, if any, radial variation. The blue GCs and red GCs in M87 and NGC 1407 show a similar trend, while only the red GCs in NGC 5128 show a similar trend. However, in the case of NGC 4636, both the blue and red GCs show an opposite trend, a larger in the inner region than in the outer region. It is noted that the blue GCs and red GCs in NGC 4636 rotate in opposite direction to each other.
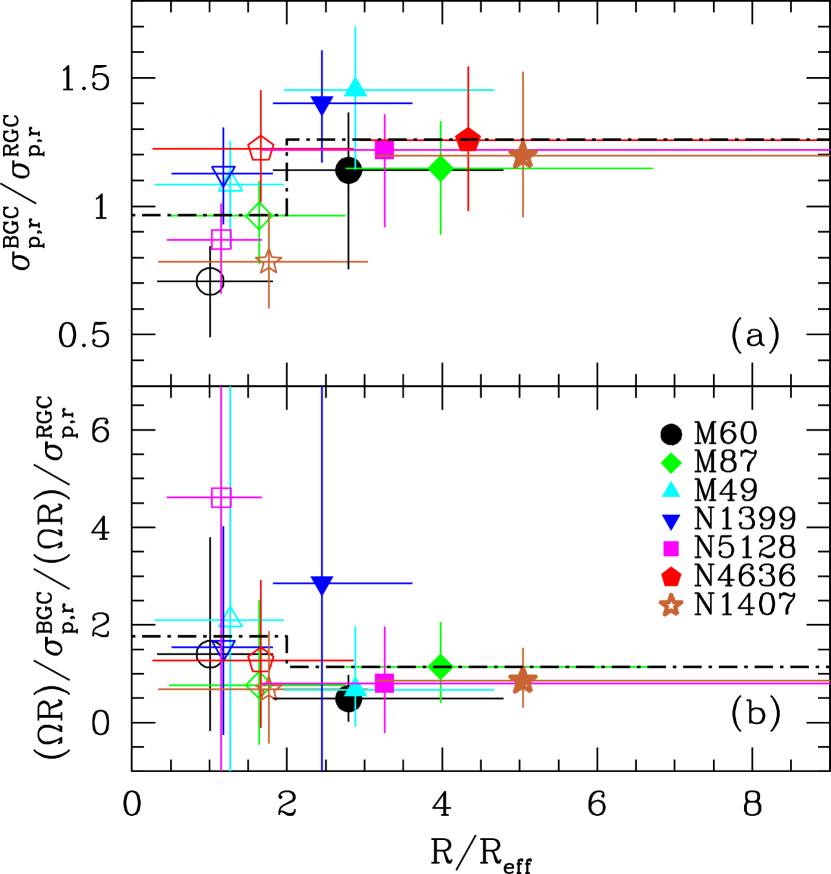
To show better the results seen in Figures 16 and 17, we display in Figure 18 the ratio of the rotation-corrected velocity dispersion between the blue GCs and red GCs () and the ratio of the rotation amplitude to the rotation-corrected velocity dispersion between the blue GCs and the red GCs ( ) as a function of projected galactocentric distance normalized to the effective radius (). It is seen that the mean value of for the inner region (), is close to one, 0.97 0.19, and that it is slightly smaller than that for the outer region (), 1.26 0.12. It is also noted that the values of for the inner region, 1.77 1.34 are marginally larger than those for the outer region, 1.14 0.87. These results show that, when compared with the red GCs, the blue GCs have a larger velocity dispersion and smaller rotation amplitude in the outer region.
4.3 Comparison with Formation Models of Globular Clusters in gEs
The kinematic properties of the GC systems in galaxies can provide strong constraints on the formation models of the GC systems and their host galaxies (Côté et al., 2001, 2003; Hwang et al., 2008; Kormendy et al., 2009). Several formation models of the GC systems in gEs have been suggested to describe the formation of GCs (Peebles, 1969; Ashman & Zepf, 1992; Harris et al., 1995; Forbes et al., 1997; Côté et al., 1998) and a summary of model descriptions and predictions can be found in several literature (Rhode & Zepf, 2001; Lee, 2003; Richtler et al., 2004; West et al., 2004; Brodie & Strader, 2006; Hwang et al., 2008). These models can be broadly divided into four categories: the monolithic collapse model, the major merger model, the multiphase dissipational collapse model, and the dissipationless accretion model. These models suggest some kinematic properties of the GCs in galaxies. These were discussed in comparison with the observation results for the GCs in gEs in Hwang et al. (2008) and will be summarized below. We focus on kinematic aspects of these models to compare with observational results below. It is noted that these classical models do not provide detailed kinematic properties so as to compare with the observational results.
In the monolithic collapse model an elliptical galaxy and its GCs are formed through the collapse of an isolated massive gas cloud or protogalaxy at high redshift (Larson, 1975; Carlberg, 1984; Arimoto & Yoshii, 1987). In this model, the rotation of GCs can be generated by tidal torques from companions (Peebles, 1969), but the resulting rotation is not expected to be strong. This model cannot explain the strong rotation of the GC system seen in M60 and M87, and the globally isotropic velocity ellipsoid of the GC system in several gEs.
In the major merger model elliptical galaxies are formed by a merger of two or more gas-rich disk galaxies (Toomre, 1977; Ashman & Zepf, 1992; Zepf et al., 2000). In this model, younger, spatially concentrated, red GCs are formed during the merger, while spatially more extended, blue GCs come from the halos of the disk galaxies (e.g., Bekki et al. 2002). This model predicts that the newly formed red GCs show little rotation compared to the blue GCs since the angular momentum would be transported to the outer region during the merging process. This model cannot explain the presence of rotation of the red GCs in M60, M87, and NGC 5128, while its prediction is consistent with the absence of rotation of the red GCs in other gEs.
In the multiphase dissipational collapse model (Forbes et al., 1997) elliptical galaxies form their GCs in distinct star formation phases through a dissipational collapse, and they capture some GCs by tidal effects from neighboring galaxies or the accretion of dwarf galaxies. The blue GCs are formed in the first star formation phase and the red GCs are formed in the subsequent star formation phase after the gas in the galaxy is self-enriched. This model predicts that the blue GC system shows no rotation and a high velocity dispersion, while the red GC system shows some rotation depending on the degree of dissipation in the collapse. Their prediction for the rotation is not consistent with the observational results for gEs in this study (e.g., rotation measured in M60 and M87).
In the dissipationless accretion model (Côté et al., 1998) the red GCs are formed in a dissipational monolithic collapse of a primary proto-galactic cloud, while the blue GCs are subsequently captured from other (low-mass) galaxies through mergers or tidal stripping. Since the blue GCs are captured from other galaxies, they are expected to show a spatial distribution more extended than that of the red GCs. The blue GCs are expected to have radially biased orbits rather than isotropic or tangentially biased orbits, and are also expected to show no rotation (Richtler et al., 2004). These predictions are not consistent with the observational results that the blue GCs in gEs show isotropic or tangential orbits as seen in Fig. 15(b), and that the blue GCs in four gEs show measurable rotation as seen in Table 4.
Above classical models give some qualitative predictions for the kinematic properties of the GC systems, but without any quantitative information. On the other hand, numerical simulations provide quantitative predictions for the kinematic properties of the GC systems in galaxies, which can be compared with the observational results. There are several numerical simulation studies that provided some predictions of kinematic properties of the GC systems in galaxies (e.g., Vesperini et al. 2003; Bekki et al. 2005; Diemand et al. 2005; Kravtsov & Gnedin 2005; Moore et al. 2006; Bekki et al. 2008). Focusing on kinematic aspects of the GC systems in gEs, we compare our observational results for several gEs with the results in the simulations.
Bekki et al. (2005) presented the results of a simulation of dissipationless major mergers of spiral galaxies derived with an assumption that the spatial distribution of the GCs in E/S0’s are initially similar to that for the Milky Way Galaxy. They predicted that both pre-existing metal-poor globular clusters (MPGCs) and metal-rich globular clusters (MRGCs) obtain stronger rotation in the outer region regardless of the orbital configuration of the merging galaxies. In Figure 17, the blue GCs and red GCs in M87 and NGC 1407 show slightly stronger rotation in the outer region () than in the inner region (), which is consistent with their prediction. However, the blue GCs and red GCs in other gEs are not consistent with their prediction.
Bekki et al. (2005) also predicted that the velocity dispersion for both the MPGCs and MRGCs decreases as the galactocentric distance increases and that there is little difference between the MPGCs and MRGCs in all major merger models, while those are sometimes flat in multiple merger models. In addition the MPGCs should show slightly larger central velocity dispersion than the MRGCs, indicating that the MPGCs are dynamically hotter than the MRGCs. However, the observational results for NGC 4636 in Figure 5 and other gEs in Figure 16 show that there is significant difference in the VDPs between the MPGCs and MRGCs, which is not consistent with the prediction by Bekki et al. (2005).
Recently Bekki et al. (2008) investigated the origin of GC systems using high-resolution cosmological N-body simulations combined with the semi-analytic models of galaxy formation. They predicted that the majority (about 90 per cent) of GCs seen in the galaxy halos today were formed in low-mass dwarf galaxies at redshifts larger than 3 and that the mean formation epochs for the MPGCs ([Fe/H]) and MRGCs ([Fe/H]) are, respectively, 12.7 Gyr ago (redshift ) and 12.3 Gyr ago (redshift ). MPGCs and MRGCs were also formed in the gas-rich major mergers for a wide range of redshifts, with peaks at and , respectively. MRGCs are formed also in isolated gas-rich galaxies. They could explain several observational results on structural, kinematic and chemical properties of the GC systems in various kinds of galaxies with their models.
Kinematic properties of the GC systems predicted in the Bekki et al. (2008)’s model are: (a) the velocity dispersions of the MPGCs and MRGCs increase according to the total luminosity of their host galaxy (); (b) the ratio of the velocity dispersions between the MPGCs and MRGCs is almost one for a wide range of the total luminosity of their host galaxy; and (c) the ratio of maximum rotational velocities to central velocity dispersions in GC systems is low () for most galaxies, which is in contrast to the case of disk-disk major mergers leading to larger () suggested by Bekki et al. (2005).
Their prediction (a) is roughly consistent with the observational results shown in Figure 12(c). Their prediction (b) also appears to be consistent with our observational results considering the large uncertainties (see Fig. 12(f) in this study and Fig. 18 in Bekki et al. 2008). However, it is worth noting that the ratio of the velocity dispersions between the blue and red GCs ranges from 0.85 to 1.25 in Figure 12(f), that the ratio is the largest for the sample of the brightest and faintest galaxies, and that it is the smallest for the intermediately luminous galaxy. This trend should be checked with a larger sample of galaxies. Four out of seven gEs (NGC 4636, NGC 1399, M49, and NGC 5128) have low ratios of maximum rotational velocities to central velocity dispersions (), as shown in Figure 12(g), which is again in a broad agreement with their prediction (c).
Therefore, the observational results appear to be approximately consistent with those in the simulations of Bekki et al. (2008) in terms of the parameters that they considered. However, it is noted that some GC systems show different behavior depending on the parameters and there remain many observational results to be explained (e.g., Figs. 12 and 13).
4.4 A Mixture Scenario for the Origin of Globular Clusters in gEs
The most notable results emerging from our study of kinematic properties of the GC systems in seven gEs are (a) that the kinematic properties of the GC systems are diverse among gEs and (b) that some kinematic parameters of the GC systems show strong correlations with the global parameters of their host galaxies. The first result indicates that the GCs in gEs were probably formed and evolved via diverse mechanisms rather than via one single way, and the second result implies that the kinematics of the GCs is controlled by the gravitational potential of their host galaxies. Considering all above comparisons and observational aspects of the GCs in gEs (Lee, 2003; Hwang et al., 2008; Peng et al., 2008), we derive a following scenario for the origin of GCs in gEs.
(1) MPGCs are formed mostly in low-mass dwarf galaxies very early, and preferentially in dwarf galaxies located in the high density environment like galaxy clusters. These are the first generation of GCs in the universe. MPGCs should be also formed in massive galaxies as well, but the number of these massive galaxies is much smaller compared with that of the dwarf galaxies. Observational evidence for this are: (a) MPGC are among the most metal-poor objects; (b) The spatial distribution of the MPGCs is more extended than that of the MRGCs around gEs (Lee, Kim, & Geisler, 1998; Dirsch et al., 2005; Lee, 2003); (c) The dwarfs in higher density environment have higher specific frequency than those in the lower density environments (Peng et al., 2008); and (d) the intracluster GCs are mostly MPGCs (Tamura et al., 2006).
(2) MRGCs are formed together with stars in massive galaxies or dissipational merging galaxies later than MPGCs, but not much later than MPGCs. The chemical enrichment of the galaxies is rapid after the formation of MPGCs and the difference in the formation epoch of MPGCs and MRGCs should be small (e.g., much smaller than 1 Gyr). Observational evidence for this are: (a) MRGCs have, on average, similar metallicity to that of the stellar halo in gEs (Geisler, Lee, & Kim, 1998; Lee et al., 2008b); and (b) the difference in estimated ages between the MPGCs and MRGCs is small, while the difference in mean metallicity of the two populations of GCs is about a dex (Lee, 2003; Lee et al., 2008b).
(3) Massive galaxies grow becoming gEs via dissipationless or dissipational merging of galaxies of various types and via accretion of many dwarf galaxies. New MRGCs will be formed during dissipational merging, but the faction of dissipational merging at this stage should be minor. A significant fraction of MPGCs in gEs we see today are from dissipationless merging or accretion. Observational evidence for this are: (a) The spatial distribution of the MPGCs is more extended than that of the MRGCs around gEs (Lee, Kim, & Geisler, 1998; Lee, 2003; Dirsch et al., 2005; Lee et al., 2008b); (b) The intracluster GCs are mostly MPGCs (Tamura et al., 2006); (c) The kinematics of the GCs are diverse among the gEs, and there are strong correlations of the GC kinematics with some global parameters of their host galaxies found in this study. It is also noted that Kormendy et al. (2009) concluded from the study of structure of a large sample of elliptical galaxies that bright boxy elliptical galaxies (like gEs) were formed via dissipationless (dry) merger, while faint disky elliptical galaxies were formed via dissipational (wet) merger and conversion of late-type galaxies into spheroidals.
In this scenario each gE has a different history of growing involved with diverse merging and accretion, explaining naturally the diversity in the kinematics of the GC systems in gEs. This scenario also explains the bimodal color distribution of the GCs, the difference in spatial distribution between the blue GCs and red GCs, the correlation in color between the red GCs and their host galaxies. This is a mixture model or a bibimbap model (bibimbap is a Korean dish where diverse vegetables and warm rice are mixed together with some tasty sauces) in that it includes all the key elements in the previous models.
5 Summary
Using the photometric and spectroscopic database of 238 GCs (108 blue GCs and 130 red GCs) in NGC 4636 (gE in the Virgo cluster), we have derived the kinematics of the GC system of this galaxy. Then we have compared the kinematics of the GC systems in seven gEs including NGC 4636, and have investigated correlations between the GC kinematics and the globular parameters of their host galaxies. Our primary results are summarized as follows.
-
1.
The red GC subsample of NGC 4636 shows marginal overall rotation. In the inner region both the blue and red GC subsamples show some rotation.
-
2.
Both of the velocity dispersions about the mean velocity and about the best fit rotation curve of the blue GCs are about 50 km s-1 larger than those of the red GCs.
-
3.
Comparison of observed stellar and GC velocity dispersion profiles with those calculated from the stellar mass profile shows that the mass-to-light ratio is not constant, but should increase as the galactocentric distance increases, indicating the existence of an extended dark matter halo in NGC 4636.
-
4.
Using the X-ray mass profiles, the number density distribution of GCs, and the observed VDP of GCs, we have determined the velocity anisotropy of the NGC 4636 GC system. The orbits of the NGC 4636 GC system are tangentially biased. The orbits of both the red GCs and blue GCs at kpc are tangential, and the orbits of the red GCs is slightly more tangential than that of the blue GCs. The orbit of the blue GCs in the inner region at kpc is found to be radial.
-
5.
From the comparison of the kinematics of the NGC 4636 GC system in this study with those for other gEs, we found several correlations between the kinematic properties of the GC systems and the global parameters of their host galaxies.
-
6.
We compared the observational results for the GC systems in gEs including NGC 4636 with those in several GC formation models, and found that some results are consistent with the predictions from the models but some are not. We suggested a mixture scenario for the origin of the GCs in gEs.
References
- Arimoto & Yoshii (1987) Arimoto N., & Yoshii Y. 1987, A&A, 173, 23
- Ashman & Zepf (1992) Ashman, K.M., & Zepf, S.E. 1992, ApJ, 384, 50
- Baldi et al. (2009) Baldi, A., et al. 2009, ApJ, submitted (astrop-ph/0904-2569)
- Beers et al. (1990) Beers, T. C., Flynn, K., & Gebhardt, K. 1990, AJ, 100, 32
- Bekki et al. (2002) Bekki, K., Forbes, D. A., Beasley, M. A., & Couch, W. J. 2002, MNRAS, 335, 1176
- Bekki et al. (2005) Bekki, K., Beasley, M. A., Brodie, J. P., & Forbes, D. A. 2005, MNRAS, 363, 1211
- Bekki et al. (2008) Bekki, K., Yahagi, H., Nagashima, M., & Forbes, D. A. 2008, MNRAS, 387, 1131
- Bender et al. (1992) Bender, R., Burstein, D., & Faber, S. M. 1992, ApJ, 399, 462
- Bender et al. (1994) Bender, R., Saglia, R. P., & Gerhard, O. E. 1994, MNRAS, 269, 785
- Beuing et al. (1999) Beuing, J., Dobereiner, S., Bohringer, H., & Bender, R. 1999, MNRAS, 302, 209
- Binney & Tremaine (1987) Binney, J., & Tremaine, S. 1987, Galactic Dynamics (Princeton: Princeton Univ. Press)
- Bridges et al. (2006) Bridges, T., et al. 2006, MNRAS, 373, 157
- Brighenti & Mathews (1997) Brighenti, F., & Mathews, W. G. 1997, ApJ, 486, L83
- Brodie & Strader (2006) Brodie, J. P., & Strader, J. 2006, ARA&A, 44, 193
- Carlberg (1984) Carlberg, R. G. 1984, ApJ, 286, 403
- Chakrabarty & Raychaudury (2008) Chakrabarty, D. & Raychaudury, S. 2008, AJ, 135, 2350
- Cohen & Ryzhov (1997) Cohen, J.G., & Ryzhov, A. 1997, ApJ, 486, 230
- Côté et al. (1998) Côté, P., Marzke, R.O., & West, M.J. 1998, ApJ, 501, 554
- Côté et al. (2001) Côté, P., et al. 2001, ApJ, 559, 828
- Côté et al. (2003) Côté P., McLaughlin D. E., Cohen J. G., & Blakeslee J. P. 2003, ApJ, 591, 850
- Dehnen (1993) Dehnen, W. 1993, MNRAS, 265, 250
- de Vaucouleurs et al. (1991) de Vaucouleurs, G., de Vaucouleurs, A., Corwin, H. G. Jr., Buta, R. J., Paturel, H. G., & Fouqué, P. 1991, Third Reference Catalog of Bright Galaxies (New York: Springer)
- Diemand et al. (2005) Diemand, J., Madau, P., & Moore, B. 2005, MNRAS, 364, 367
- Dirsch et al. (2005) Dirsch, B., Schuberth, Y., & Richtler, T. 2005, A&A, 433, 43
- Dufour et al. (1979) Dufour, R. J., et al. 1979, AJ, 84, 284
- Faber et al. (1997) Faber, S. M., et al. 1997, AJ, 114, 1771
- Forbes et al. (1997) Forbes D.A., Brodie J.P., & Grillmair C.J. 1997, AJ, 113, 1652
- Forbes et al. (2004) Forbes D. A., et al. 2004, MNRAS, 355, 608
- Forbes et al. (2006) Forbes, D. A., Sánchez-Blázquez, P., Phan, A. T. T., Brodie, J. P., Strader, J., & Spitler, L. 2006, MNRAS, 366, 1230
- Geisler (1996) Geisler, D. 1996, AJ, 111, 480
- Geisler, Lee, & Kim (1998) Geisler, D., Lee, M. G., & Kim, E. 1998, AJ, 111, 1529
- Harris et al. (1995) Harris, W. E., Pritchet, C. J., & McClure, R. D. 1995, ApJ, 441, 120
- Harris et al. (2004) Harris, W. E., Harris, G. L. H., & Geisler, D. 2004, AJ, 128, 723
- Harris et al. (2006) Harris, W. E., Harris, G. L. H., Barmby, P., McLaughlin, D. E., & Forbes, D. A. 2006, AJ, 132, 2187
- Hui et al. (1995) Hui, X., Ford, H. C., Freeman, K. C., & Dopita, M. A. 1995, ApJ, 449, 592
- Hwang et al. (2008) Hwang, H. S., et al. 2008, ApJ, 674, 869
- Isobe et al. (1990) Isobe, T., Feigelson, E. D., Akritas, M. G., & Babu, G. J. 1990, ApJ, 364, 104
- Johnson et al. (2009) Johnson, R., Dalia Chakrabarty, D., O’Sullivan, E. & Raychaudhury, S. 2009, ApJ, in press (astro-ph/0910.2468)
- Kim et al. (2006) Kim, E., Kim, D.-W., Fabbiano, G., Lee, M. G., Park, H. S., & Dirsch, B. 2006, ApJ, 647, 276
- Kissler et al. (1994) Kissler, M., Richtler, T., Held, E. V., Grebel, E. K., Wagner, S. J., & Capaccioli, M. 1994, A&A, 287, 463
- Kissler-Patig et al. (1998) Kissler-Patig, M., Brodie, J. P., Schroder, L. L., Forbes, D. A., Grillmair, C. J., & Huchra, J. P. 1998, AJ, 115, 105
- Kissler-Patig & Gebhardt (1998) Kissler-Patig, M., & Gebhardt, K. 1998, AJ, 116, 2237
- Kissler-Patig et al. (1999) Kissler-Patig M., Grillmair C. J., Meylan G., Brodie, J. P., Minniti, D., & Goudfrooij, P. 1999, AJ, 117, 1206
- Kormendy et al. (2009) Kormendy, J., Fisher, D. B., Cornell, M. E., & Bender, R. 2009, ApJS, 182, 216
- Kravtsov & Gnedin (2005) Kravtsov, A. V., & Gnedin, O. Y. 2005, ApJ, 623, 650
- Kronawitter et al. (2000) Kronawitter, A., Saglia, R. P., Gerhard, O., & Bender, R. 2000, A&AS, 144, 53
- Larson (1975) Larson R.B. 1975, MNRAS, 173, 671
- Lee, Kim, & Geisler (1998) Lee, M. G., Kim, E., & Geisler, D. 1998, AJ, 115, 947
- Lee (2003) Lee, M. G. 2003, Jour. Korean Astron. Soc., 36, 189
- Lee et al. (2008a) Lee, M. G., et al. 2008a, ApJ, 674, 857
- Lee et al. (2008b) Lee, M. G., Park, H. S., Kim, E., Hwang, H. S., Kim, S. C., & Geisler, D. 2008b, ApJ, 682, 135
- Lee et al. (2008c) Lee, M. G., Hwang, H. S., Kim, S. C., Park, H. S., Geisler, D., Sarajedini, A., & Harris, W. E. 2008c, ApJ, 674, 886
- Loewenstein & Mushotzky (2002) Loewenstein, & M., Mushotzky, R. F. 2002, astro-ph, 0208090
- Loewenstein & Mushotzky (2003) Loewenstein, & M., Mushotzky, R. F. 2003, Nucl. Phys. B. Proc. Suppl., 124, 91
- Matsushita et al. (1998) Matsushita, K., Makishima, K., Ikebe, Y., Rokunanda, E., Uamasaki, N. Y., & Ohashi, T. 1998, ApJ, 499, L13
- McLaughlin (1999) McLaughlin, D.E. 1999, AJ, 117, 2398
- Minniti et al. (1998) Minniti, D., Kissler-Patig, M., Goudfrooij, P., & Meylan, G. 1998, AJ, 115, 121
- Moore et al. (2006) Moore, B., Diemand, J., Madau, P., Zemp, M., & Stadel, J. 2006, MNRAS, 368, 563
- Mushotzky et al. (1994) Mushotzky, R. F., Loewenstein, M., Awaki, H., Makishima, K., Matsushita, K., & Matsumoto, H. 1994, ApJ, 436, L79
- Navarro et al. (1997) Navarro, J. F., Frenk, C. S., & White, S. D. M. 1997, ApJ, 490, 493
- Nolthenius (1993) Nolthenius, R. 1993, ApJS, 85, 1
- O’Sullivan et al. (2001) O’Sullivan, E., Forbes, D. A., & Ponman, T. J. 2001, MNRAS, 328, 461
- O’Sullivan et al. (2003) O’Sullivan, E., Ponman, T. J., & Collins, R. S. 2003, MNRAS, 340, 1375
- O’Sullivan et al. (2005) O’Sullivan, E., Vrtilek, J. M., & Kempner, J. C. 2005, ApJ, 624, L77
- Park et al. (2009a) Park, H. S., Lee, M. G., Hwang, H. S., Arimoto, N., Tamura, N., & Onodera, M. 2009a, submitted (Paper I)
- Park et al. (2009b) Park, H. S. et al. 2009b, in preparation
- Peebles (1969) Peebles, P. J. E. 1969, ApJ, 155, 393
- Peletier et al. (1990) Peletier, R. F., Davies, R. L., Illingworth, G. D., Davis, L. E., & Cawson, M. 1990, AJ, 100, 1091
- Peng et al. (2004a) Peng, E. W., Ford, H. C., & Freeman, K. C. 2004a, ApJS, 150, 367
- Peng et al. (2004b) Peng, E. W., Ford, H. C., & Freeman, K. C. 2004b, ApJ, 602, 705
- Peng et al. (2008) Peng, E. W. et al. 2008, ApJ, 681, 197
- Perrett et al. (1997) Perrett, K. M., Hanes, D. A., Butterworth, S. T., Kavelaars, J., Geisler, D., & Harris, W. E. 1997, AJ, 113, 895
- Pierce et al. (2006) Pierce, M., et al. 2006, MNRAS, 368, 325
- Posson-Brown et al. (2009) Posson-Brown, J., Raychaudhury, S., Forman, W., Hank D. R., & Jones, C. 2009, ApJ, 695, 1094
- Richtler et al. (2004) Richtler, T., et al. 2004, AJ, 127, 2094
- Richtler et al. (2008) Richtler, T., Schuberth, Y., Hilker, M., Dirsch, B., Bassino, L., & Romanowsky, A. J. 2008, A&A, 478, L23
- Rhode & Zepf (2001) Rhode K. L., & Zepf S. E. 2001, AJ, 121, 210
- Romanowsky & Kochanek (2001) Romanowsky, A. J., & Kochanek, C. S. 2001, ApJ, 553, 722
- Romanowsky et al. (2009) Romanowsky, A. J., Strader, J., Spitler, L. R., Johnson, R., Brodie, J. P., Forbes, D. A., & Ponman, T. 2009, AJ, 137, 4956
- Saglia et al. (2000) Saglia, R. P., Kronawitter, A., Gerhard, O., & Bender, R. 2000, AJ, 119, 153
- Sandage (1961) Sandage, A. 1961, in the Hubble Atalas of Galaxies. (Washington, DC: CIW)
- Schuberth et al. (2006) Schubert, Y., Richtler, T., Dirsch, B., Hilker, M., Larsen, S. S., Kissler-Patig, M., & Mebold, U. 2006, A&A, 459, 391
- Smith et al. (2000) Smith, R. J., Lucey, J. R., Hudson, M. J., Schlegel, D. J., & Davies, R. L. 2000, MNRAS, 313, 469
- Spolaor et al. (2008) Spolaor, M., Forbes, D. A., Hau, G. K. T., Proctor, R. N., & Brough, S. 2008, MNRAS, 385, 667
- Tamura et al. (2006) Tamura, N. Sharples, R. M., Arimoto, N., Onodera, M., Ohta, K., & Yamada, Y. 2006, MNRAS, 373, 601
- Temi et al. (2003) Temi, P., Mathews, W. G., Brighenti, F., & Bregman, J. 2003, ApJ, 585, L121
- Tonry et al. (2001) Tonry, J., et al. 2001, ApJ, 546, 681
- Toomre (1977) Toomre, A. 1977, in The Evolution of Galaxies and Stellar Populations, ed. B. Tinsley & R. Larson (New Haven: Yale Univ. Obs.)
- Trinchieri et al. (1986) Trinchieri, G., Fabbiano, G., & Canizares, C. R. 1986, ApJ, 310, 637
- Trinchieri et al. (1994) Trinchieri, G., Kim, D.-W., Fabbiano, G., & Canizares, C. R. C. 1994, ApJ, 428, 555
- Vesperini et al. (2003) Vesperini, E., Zepf, S. E., Kundu, A., & Ashman, K. M. 2003, ApJ, 593, 760
- West et al. (2004) West, M. J., Côté, P., Marzke, R. O., & Jordan, A. 2004, Nature, 427, 31
- Wilkinson et al. (1986) Wilkinson, A., Sharples, R. M., Fosbury, R. A. E., & Wallace, P. T. 1986, MNRAS, 218, 297
- Woodley et al. (2007) Woodley, K. A., Harris, W. E., Beasley, M. A., Peng, E. W., Bridges, T. J., Forbes, D. A., & Harris, G. L. H. 2007, ApJ, 134, 494
- Zepf et al. (2000) Zepf, S. E., Beasley, M. A., Bridges, T. J., Hanes, D. A., Sharples, R. M., Ashman, K. M., & Geisler, D. 2000, AJ, 120, 2928
| (arcsec) | (arcsec) | (km s-1) | (km s-1) | (deg) | (km s-1) | (km s-1) | / | |
|---|---|---|---|---|---|---|---|---|
| (1) | (2) | (3) | (4) | (5) | (6) | (7) | (8) | (9) |
| All GCs: 238 Clusters with 0.9 2.1 | ||||||||
| 23 926 | 268 | 238 | ||||||
| 23 259 | 150 | 120 | ||||||
| 260 926 | 388 | 118 | ||||||
| Blue GCs: 108 Clusters with 0.9 1.55 | ||||||||
| 23 926 | 298 | 108 | ||||||
| 23 252 | 145 | 42 | ||||||
| 267 926 | 395 | 66 | ||||||
| Red GCs: 130 Clusters with 1.55 2.1 | ||||||||
| 25 713 | 243 | 130 | ||||||
| 25 259 | 152 | 78 | ||||||
| 260 713 | 380 | 52 | ||||||
| (arcsec) | (arcsec) | (km s-1) | (km s-1) | (deg) | (km s-1) | (km s-1) | / | |
|---|---|---|---|---|---|---|---|---|
| (1) | (2) | (3) | (4) | (5) | (6) | (7) | (8) | (9) |
| All GCs: 172 Clusters with 0.70 1.30 | ||||||||
| 21 666 | 247 | 172 | ||||||
| 21 221 | 126 | 84 | ||||||
| 226 666 | 364 | 88 | ||||||
| Blue GCs: 86 Clusters with 0.70 0.98 | ||||||||
| 28 663 | 272 | 86 | ||||||
| 28 221 | 136 | 36 | ||||||
| 226 663 | 369 | 50 | ||||||
| Red GCs: 86 Clusters with 0.98 1.30 | ||||||||
| 21 666 | 223 | 86 | ||||||
| 21 217 | 118 | 48 | ||||||
| 227 666 | 357 | 38 | ||||||
| Galaxy | a afootnotemark: | b bfootnotemark: | Reff c cfootnotemark: | d dfootnotemark: | P.A.min e efootnotemark: | Distance f ffootnotemark: | g gfootnotemark: | log() h hfootnotemark: | NGC i ifootnotemark: | SN j jfootnotemark: |
|---|---|---|---|---|---|---|---|---|---|---|
| (km s-1) | (kpc) | (deg) | (Mpc) | (km s-1) | (erg s-1) | blue red | ||||
| (1) | (2) | (3) | (4) | (5) | (6) | (7) | (8) | (9) | (10) | (11) |
| M60 | 22.13 | 1056 | 7.33 | 0.216 | 15 | 16.8 | 337 9 | 41.270.042 | 663 455 | 4.00.8 |
| M87 | 22.38 | 1307 | 7.16 | 0.125 | 69 | 16.1 | 330 5 | 43.080.007 | 928 771 | 14.11.5 |
| M49 | 22.57 | 997 | 9.48 | 0.175 | 65 | 16.3 | 294 5 | 41.710.043 | 683 563 | 3.60.6 |
| NGC 1399 | 21.71 | 1442 | 14.55 | 0.099 | 20 | 20.0 | 25012 | 42.180.040 | 459 500 | 5.11.2 |
| NGC 5128 | 21.90 | 541 | 6.02 | 0.224 | 125 | 4.2 | 14040 | 40.150.200 | 178 158 | 1.80.5 |
| NGC 4636 | 21.67 | 928 | 6.35 | 0.256 | 58 | 14.7 | 202 3 | 41.680.046 | 639 633 | 8.21.6 |
| NGC 1407 | 21.86 | 1784 | 7.34 | 0.050 | 148 | 21.0 | 26515 | 41.140.092 | 446 725 | 3.81.3 |
| Galaxy | GC | / | ||||||
|---|---|---|---|---|---|---|---|---|
| (km s-1) | (km s-1) | (deg) | (km s-1) | (km s-1) | ||||
| M60 | AGC | 121 | ||||||
| BGC | 83 | |||||||
| RGC | 38 | |||||||
| M87 | AGC | 276 | ||||||
| BGC | 158 | |||||||
| RGC | 118 | |||||||
| M49 | AGC | 263 | ||||||
| BGC | 159 | |||||||
| RGC | 104 | |||||||
| NGC 1399 | AGC | 435 | ||||||
| BGC | 216 | |||||||
| RGC | 219 | |||||||
| NGC 5128 | AGC | 341 | ||||||
| BGC | 160 | |||||||
| RGC | 146 | |||||||
| NGC 4636 | AGC | 238 | ||||||
| BGC | 108 | |||||||
| RGC | 130 | |||||||
| NGC 1407 | AGC | 172 | ||||||
| BGC | 86 | |||||||
| RGC | 86 |
| X | Y | rms | Remarks | ||||
|---|---|---|---|---|---|---|---|
| 97.66 | –3796 | 27.77 | 0.89 | 0.01 | Fig. 12(a) | ||
| 110.28 | –4309 | 32.48 | 0.96 | 0.00 | Fig. 12(a) | ||
| 84.04 | –3243 | 27.13 | 0.86 | 0.01 | Fig. 12(a) | ||
| 1.394 | –69.51 | 30.71 | 0.83 | 0.04 | Fig. 12(b) | ||
| 1.538 | –88.77 | 45.63 | 0.71 | 0.11 | Fig. 12(b) | ||
| 1.237 | –50.31 | 23.93 | 0.83 | 0.04 | Fig. 12(b) | ||
| –255.6 | -5389 | 64.80 | –0.49 | 0.33 | Fig. 12(c) | ||
| –279.0 | -5898 | 71.90 | –0.43 | 0.40 | Fig. 12(c) | ||
| –222.1 | -4658 | 59.60 | –0.66 | 0.16 | Fig. 12(c) | ||
| 20.03 | 150.1 | 63.28 | 0.57 | 0.18 | Fig. 13(a) | ||
| -1548 | 552.2 | 56.70 | –0.77 | 0.07 | Fig. 13(c) | ||
| –0.908 | 2.163 | 0.107 | –0.60 | 0.21 | Fig. 13(e) | ||
| 1.120 | –1.003 | 0.091 | 0.83 | 0.04 | Fig. 13(h) | ||
| –1.153 | 1.556 | 0.108 | –0.86 | 0.01 | Fig. 14(a) |