Influence of nuclear physics inputs and astrophysical conditions on
Th/U chronometer
Abstract
The productions of thorium and uranium are key ingredients in -process nucleo-cosmochronology. With the combination of improved nuclear and stellar data, we have made detailed investigations on the -process abundance pattern in the very metal-poor halo stars based on the classical -process approach. It is found that the results are almost independent of specified simulations to observed abundances. The influence from nuclear mass uncertainties on Th/U chronometer can approach 2 Gyr. Moreover, the ages of the metal-poor stars HE 1523-0901, CS 31082-001, and BD +17∘3248 are determined as , , and Gyr, respectively. The results can serve as an independent check for age estimate of the universe.
pacs:
26.30.Hj, 21.10.Dr, 98.80.Ft, 97.20.TrI Introduction
The age of the universe is one of the most important physical quantities in cosmology. As the very metal-poor ([Fe/H]-2) stars were formed at the early epoch of the universe, their ages can set a lower limit on the age of the universe. The ages of these stars can be determined by nuclear chronometers, which rely on the comparison of the present abundances of radioactive nuclei with the initial abundances at their productions. This method can avoid uncertainties in the Galactic chemical evolution models, and thus can be used as an independent dating technique for the universe.
The radioactive element Th was detected in the -process enhanced metal-poor star CS 22892-052 for the first time in 1995 CS22892052a , and was observed later as well in other metal-poor stars Cowan1999ApJ ; HD115444 ; HD221170 . These observations make it possible to determine their ages using Th/X (X represents a stable -process element, e.g., Eu) chronometer Cowan1997ApJ . The U line was firstly detected in CS 31082-001 CS31082001 , which allows determining its age using a more ideal Th/U footnote chronometer, since Th and U are both -only nuclei and close in mass number. Recently, the U lines were also detected in other two metal-poor stars, namely, BD +17∘3248 BD173248 and HE 1523-0901 HE15230901 . These observations from metal-poor stars have provided the opportunity of age estimates from Th/U chronometers. However, a precise age determination via nuclear chronometers still requires reliable estimations of the initial -process abundances of actinides.
The initial abundances of Th and U can be derived from -process nucleosynthesis calculations. However, the astrophysical condition of -process is still in debate up to now. It is found that the -process elemental abundance patterns observed from very metal-poor stars and the solar system are universal for the heavier elements above Ba. This universality suggests that there is probably only one -process site in the Galaxy Cowan1999ApJ ; Cowan2006Nature , whereas a different process could be responsible for the scatter of the lighter -process elemental (, here Z is atomic number) abundance pattern Travaglio2004ApJ ; Qian2007PRp ; Montes2007ApJ . Furthermore, there are some indications that the observed stable abundance pattern of the main r-process (except for U and Th) extends to the light r-process elements (e.g., Montes2007ApJ ). This uncertainty of astrophysical site(s) has complicated -process calculations, thus parameterized -process models (e.g., Kratz1993ApJ ; Pfeiffer1997ZPA ; Arnould2007PR ) have been widely employed to calculate the initial abundances of Th and U via the best fit to the observed abundances.
A number of investigations Cowan1999ApJ ; Goriely2001AA ; Schatz2002ApJ ; Kratz2007ApJ in -process chronometers have been made so far in literatures. These works employed the solar -process abundances to predict the zero-decay abundances of the radioactive elements (e.g., Th and U). Nevertheless, a basic hypothesis of these works is that the universal -process abundance pattern from metal-poor stars and the solar system not only hold for the elemental abundance distribution () but also for the isotopic abundance distribution (). However, with improved observations of metal-poor stars (e.g., CS31082001b ; CS22892052 ; Sneden2008ARAA ; Sneden2009ApJSS ), now it is possible to make a step further for -process chronometers by directly simulating the abundances of very metal-poor stars thus having a more solid ground. Furthermore, by comparing the abundance patterns determined by simulating the abundances of elements in the region with those determined by simulating the abundances of elements in the region , it may help to understand the uncertainty of astrophysical site(s) of -process nucleosynthesis.
Another major source of the uncertainty of nuclear chronometer is the nuclear physics inputs employed in -process calculations, such as nuclear masses and -decay rates. Although lots of efforts have been devoted in recent years to the measurements of nuclear ground state properties, majority of neutron-rich nuclei of relevance to the -process are still out of the reach of experimental capabilities. Consequently, theoretical predictions have to be used. However, as there is no clear evidence to test the reliability of theoretical models, it is necessary to make a systematic investigation on the uncertainties of age estimates based on different theoretical predictions, including those newly developed models Sun2008CPL .
In this paper, we will analyze the abundance pattern in these earliest Galactic stars and deduce their ages based on the combination of improved stellar and nuclear data. The paper is organized as follows. In Sect. II, numerical details including a short introduction to the classical -process model and the nuclear physics inputs used in this paper are given. In Sect. III, possible constraints on nuclear mass models are discussed based on the experimental data and the solar -process abundances. Then calculations are made by directly simulating the abundances in metal-poor stars. Moreover, the influence of astrophysical conditions and nuclear physics inputs on the -process simulations and on the age estimates of the stars HE 1523-0901, CS 31082-001, and BD +17∘3248 are discussed in details. Finally, the summary and perspective are presented in Sect. IV.
II Sketch of the classical -process model and numerical details
The classical -process model is employed in this investigation to deduce the zero-decay Th/U abundance ratio similar to Refs. Cowan1999ApJ ; Schatz2002ApJ . In this model, seed-nuclei (Fe) are irradiated by neutron sources of high and continuous neutron densities over a timescale in a high temperature environment (1 GK). Similar to Refs. Sun2008PRC ; Pfeiffer1997ZPA , sixteen components with neutron densities in the range of to cm-3 are used to reproduce the observed -process abundances. The weight and the irradiation time of each -process component follow exponential relations on neutron density :
| (1) |
The parameters , , and can be determined from a least-square fit to the observed -process abundances with the Marquardt method Marquardt1968JSIAM , while follows the normalization of the weighting factors. This model is considered as a realistic simplification of dynamical -process model, and it has been successfully employed in describing -process patterns of both the solar system and metal-poor stars (e.g. Sun2008PRC ; Kratz2007ApJ ; Freiburghaus1999ApJ ; Pfeiffer2001NPA ).
The abundances for each -process component are calculated within the waiting-point approximation. In this method, the abundance distribution in an isotopic chain is given by the Saha equation and is entirely determined by neutron separation energies for a given temperature (in this paper, GK) and a neutron density . The matter flow between neighboring isotopic chains is determined by the total -decay rates (including up to three neutrons -delay emissions). After neutron sources freeze out, all the isotopes then proceed to the corresponding stable isotopes via - and -decays. The process of spontaneous fission is also taken into account to calculate the final abundances of actinides.
During the early phase of the -process, the waiting-point approximation is generally believed to be well maintained Kratz1993ApJ ; Freiburghaus1999ApJ since the reaction rates for neutron captures and photo-dissociations are much faster than the -decay rates. Recent dynamical calculations showed that the neutron captures may influence the final abundance distribution (e.g. Surman2009PRC ) where the corresponding neutron capture rates varied by 2 orders of magnitude. However, the Th/U ratio should not be affected dramatically in comparison to the Th/X ratio by the waiting-point approximation. Other effects induced by neutrino spallation Qian1997PRC during the freeze out may have small influence on the Th and U chronometer Terasawa2004ApJ . Therefore, we will focus hereafter on the influence of the nuclear ground state properties within the waiting-point approximation.
The astrophysical condition of -process nucleosythesis can be obtained by the best fit to the observed abundances in metal-poor stars or the solar -process abundances. In this paper, we take the scaled average abundances of the most Eu-enriched stars CS 31082-001 CS31082001b and CS 22892-052 CS22892052 as a representative of stable, universal -process abundances for elements in the region . However, there is an obvious discrepancy of Pb abundance in these two metal-poor stars, which may be due to the obscure -process contribution Eck2001Nature . Hence in order to estimate the uncertainty of Pb abundance and furthermore its influence on the actinide abundance predictions, in our first step we have adopted the Pb abundances in these two stars to find out their corresponding best simulations. The corresponding results will be discussed in next section. As the Pb abundance in CS 22892-052 is in better agreement with the scaled solar -process abundance, the Pb abundance hereafter is adopted from CS 22892-052 otherwise specified.
In order to estimate the potential astrophysical uncertainties, we have performed different fits to the observations. In the first case, all the neutron-capture elements in the very metal-poor stars are assumed to be synthesized in a unique -process site. Consequently, one has to fit the average scaled abundances of elements in the range (labeled as fit I hereafter). In the second case, which states that the abundance pattern of heavier -process elements () in metal-poor stars are identical to those in the solar system, we perform a fit to the average scaled abundances of elements only in the range (labeled as fit II), as well as a fit to the solar -process isotopic abundances with mass number in the region Sneden2008ARAA (labeled as fit III). The results from the fit I and II can help to understand whether there are different origins for elements lighter and heavier than Barium. Meanwhile, the two independent calculations (the fit II and III), in principle, may serve as a critical test to the hypothesis, namely, whether the isotopic abundances are identical in metal-poor stars and the solar system.
In this paper, available experimental data Audi2003NPA:a ; Sun2008NPA are used, otherwise predictions of three newly developed mass models (HFB-17 HFB17 , RMF RMF , and KTUY KTUY ) or five commonly used mass models DZ10 DZ10 , DZ28 DZ28 , ETFSI-2 ETFSI2 , ETFSI-Q ETFSIQ , FRDM FRDM are employed. These models span from macroscopic-microscopic to self-consistent microscopic models. As for the -decay rates, the predictions of the FRDM+QRPA method FRDMQRPA are employed throughout the paper as a complementary to the experimental data Audi2003NPA:a , and those from the ETFSI+CQRPA method ETFSICQRPA are used for comparison.
III Results and discussions
In this section, we will focus on the prediction of Th/U production ratio, the age determination of metal-poor stars as well as their uncertainties related to astrophysical conditions and nuclear physics inputs. We will start with the global comparison and possible constraint on nuclear mass models.
III.1 Comparison and Constraint on Mass Models
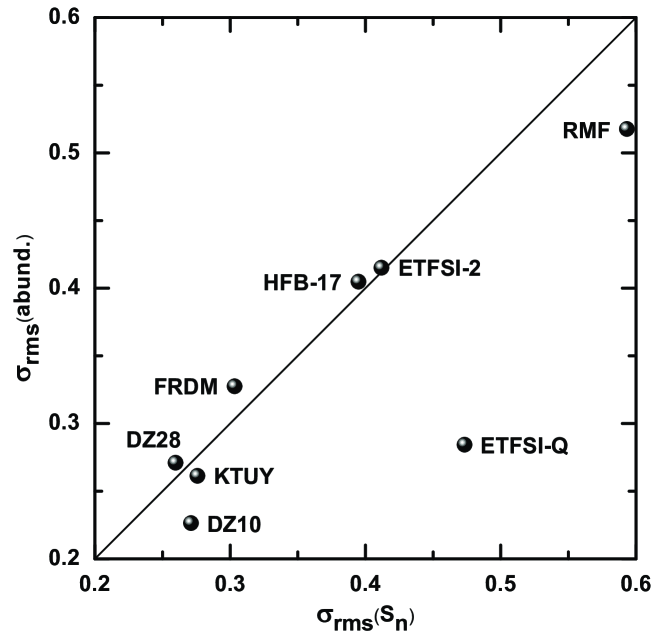
-process calculations using various nuclear mass models may yield abundances differing even by several orders of magnitude Sun2008PRC . It is therefore essential to test their reliability before applying them in the astrophysical calculations. As one-neutron separation energy () is the practically used quantity in -process calculations, the rms deviations of () calculated in different mass models relative to experimentally measured values Audi2003NPA:a ; Sun2008NPA , , are calculated and shown by the horizontal axis in Fig. 1. In all models considered here, is within 0.6 MeV. The DZ28 model better reproduces the experimental , whereas the of the RMF model is as large as 0.59 MeV. As for the latest version of the HFB model, a of 0.39 MeV is somewhat in between. Furthermore, the best fits to the solar -process abundances with mass numbers in the range of 125 to 209 have been done using different mass models (the fit III mentioned in Sec. II) and the corresponding rms values relative to the solar -process abundances, (abund.), are shown by the vertical axis in Fig. 1.
From Fig. 1, it is clearly shown that the model, which describes the experimental values better, generally results in better agreement with the observations in the -process simulation. A clear deviation to this trend is observed for the ETFSI-Q model. This mainly results from the phenomenological quenching effect at the shell closure introduced in the ETFSI-Q model, which smoothes out the trough before peak. This effect is not predicted in any of the other models Sun2008PRC . Moreover, it may be worth mentioning that the -process simulation is generally not improved using the HFB-17 model, although its reproductive power of nuclear mass has been significantly improved compared with the previous versions. Potential problems in the HFB models, like the fitting procedure employed to get the effective interaction parameters, have been discussed in Stone2005JPG . Another open question in these mean-field models is how to incorporate self-consistently the effects beyond mean field. On the other hand, the results from DZ models are surprisingly good, which may imply that such effects have been effectively treated better in DZ models Olofsson2006PRL .
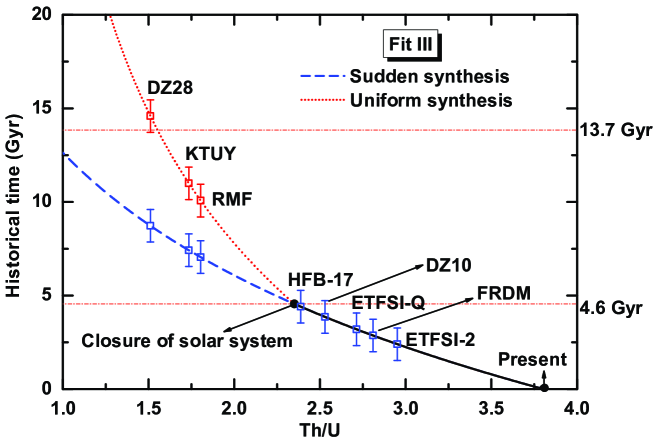
Constraints on various mass models, in principle, can also be obtained from the present knowledge of the evolution of our solar system. Using the present abundance ratio Th/U from solar system Lodders2003ApJ as well as their known half-lives ( yr and yr Audi2003NPA:a ), the ratio can be calculated by extrapolation backward in time to an epoch when solar system became a closed system, namely 4.6 Gyr ago Rolfs1988Book . Beyond this time, the estimate of the Galactic age has to rely on the Galactic chemical evolution model, which is however not well understood yet. Instead, some constraints can be obtained from two extreme assumptions of the Galactic chemical evolution models: the sudden and uniform synthesis Rolfs1988Book , where the former can provide a lower boundary of the Galactic age.
The time evolutions of the abundance ratio Th/U are governed by assuming the sudden and uniform synthesis, respectively,
| (2) | |||||
| (3) |
where is the corresponding decay constant, represent the primordial solar system abundance ratio and the ratio after r-process nucleosynthesis. From these two equations, the Th/U ratio can be deduced as a function of time for both assumptions with Lodders2003ApJ , as shown by the dashed and dotted curves in Fig. 2. On the other hand, the Th/U ratio after r-process nucleosynthesis can also be estimated from simulating the solar r-process abundance pattern, namely, the fit III. In this case, one can determine the corresponding time for the epoch of nucleosynthesis using Eqs. (2) and (3). Different predictions when using various mass models are labeled in the corresponding curves. Clearly, a reasonable age estimate for the epoch of nucleosynthesis should be longer than the age of the solar system (4.6 Gyr) but shorter than the age of the universe (13.7 Gyr WMAP ).
The simulations using the ETFSI-2, ETFSI-Q and FRDM models predict too larger Th/U abundance ratio, thus the corresponding age estimates are clearly lower than the age of the solar system even if the observable uncertainty of 0.04 dex Lodders2003ApJ is included. Especially for the frequently used ETFSI-Q model, the present result, lower than the age of the solar system, is in agreement with the age estimate in Ref. Goriely2001AA but in disagreement with those in Refs. Schatz2002ApJ ; Kratz2007ApJ . On the other hand, the Th/U predictions from five other mass models, DZ28, KTUY, RMF, HFB-17 and DZ10, are consistent with this constraint of the Galactic age. Of course, a better knowledge of the Galactic chemical evolution would further tight the constraint on mass models.
III.2 The Influence of Astrophysical Conditions and Mass Models
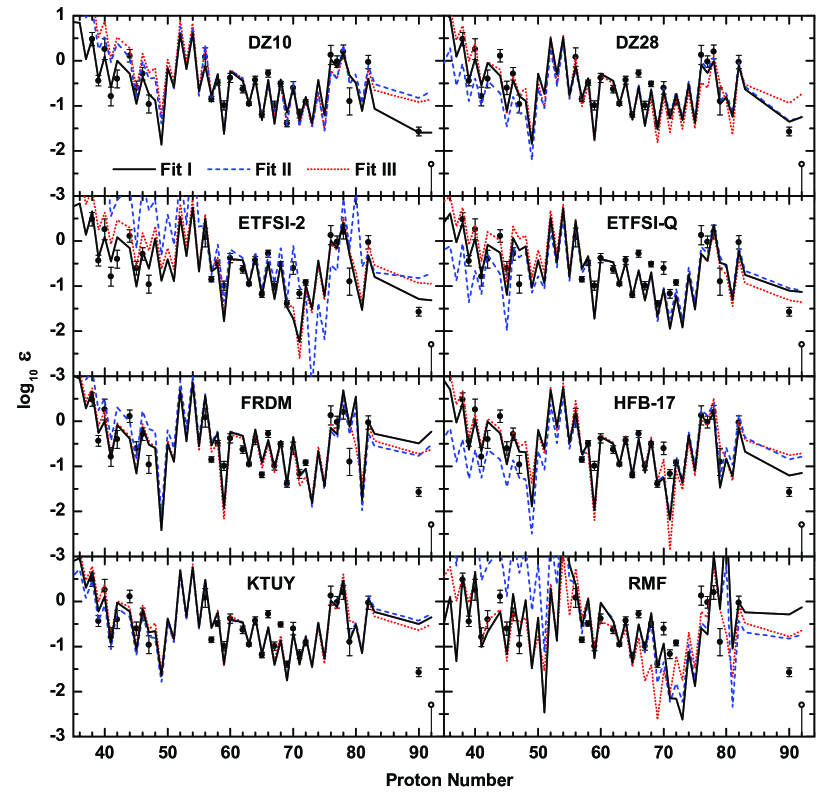
With the recent observations of metal-poor stars Sneden2008ARAA ; Sneden2009ApJSS , it is now possible to determine the astrophysical condition by simulating directly the abundances of -process enhanced metal-poor stars. The simulations from the fit I and II are shown for all the mass models in Fig. 3 by the solid and dashed lines, respectively. For comparison with previous investigations, simulations are also preformed based on the solar -process abundances, namely the fit III (dotted lines).
In the region , where all the three fits covered, all simulations well reproduce the stellar abundances. For the light neutron-capture elements with , the calculated abundances from the fit II are much higher than those from the fit I when the RMF mass model is adopted. Similar results have been also found for simulations using the DZ10, ETFSI-2 and FRDM models. On the other hand, the calculated abundances from the fit II are only slightly lower than those from the fit I for the DZ28, ETFSI-Q, HFB-17 and KTUY simulations. Therefore, it is hard to distinguish the ”potential” difference between the fit I and the fit II in the present work, since two different conclusions can be drawn. As for the calculations from the fit III, they are in better coincidence with those from the fit I than those from the fit II. This probably results from the fact that the constraint from the observation in the fit II is weak comparing with the other two fits.
Furthermore, first impression on the impact of mass model uncertainty can be made by comparing the different panels in Fig. 3 for the fit I. In the region , the simulations using the DZ10, DZ28, and KTUY mass models better reproduce observations and the rms values with respect to observations are approximately 0.25. For simulations using other mass models, their rms values are 0.47, 0.40, 0.36, 0.35, 0.34 for the RMF, ETFSI-2, ETFSI-Q, FRDM, HFB-17 simulations, respectively.
In the region , all simulations using different mass models well reproduce the observations. However, the calculated abundances for elements around are very different. A possible reason is that the exact locations of nuclear shape transition differ in different theoretical predictions, resulting in different predictions and thus r-process paths Sun2008PRC . In the region , large troughs around are found for the simulations using the ETFSI-2, ETFSI-Q and RMF mass models, which might be due to the large neutron shell gap.
In the region , large abundances of Hg (Z=80) are obtained for the FRDM and RMF simulations. This can be traced back to the longer irradiation times for components with higher neutron density. Moveover, the Pb abundances for different simulations also deviate each other and the lowest value is obtained for the DZ10 simulation. In fact, the relative Pb abundance from CS 22892-052 is not consistent with that from CS31082-001, where the former is about 6 times larger than the latter. Therefore, precise stellar data of elements heavier than Au in the future can further improve the calculations of abundances of actinides, and can be also used to test the mass predictions for the corresponding heavy elements.
III.3 The Influence of -decay Rates
Besides the physical uncertainty in nuclear masses for -process calculations, another important source of physical uncertainty is -decay rates of neutron-rich nuclei. To investigate its influence on age estimates, we have further performed -process calculations by replacing the FRDM+QRPA -decay predictions FRDMQRPA with those from the ETFSI+CQRPA model ETFSICQRPA if available. The astrophysical conditions are readjusted to reproduce the observations when the ETFSI+CQRPA -decay predictions are included.
Fig. 4 presents the corresponding results from the fit I, where the solid and dashed curves are the predicted -process abundances using -decay rates from the FRDM+QRPA and ETFSI+CQRPA models, respectively. Two representative models, DZ28 and RMF, are used as examples and their corresponding simulations are shown in the panel (a) and panel (b), respectively. As the data from the ETFSI+CQRPA model are only available for nuclei with neutron numbers around the magic numbers, the differences of the predicted -process abundances using these two -decay rates are observed mainly for elements with (with ) and (with ). It is found that the simulations using FRDM+QRPA can better reproduce the observed abundances of elements with , while the abundances determined using ETFSI+CQRPA are generally in better agreement with the observed abundances of elements with .
The differences of (Th/U) due to the variance of the -decay rates can be as large as 0.25 for the FRDM simulation, which corresponds to an age variation of about 5.5 Gyr, which clearly shows the important influence of the -decay rates on the Th/U chronometer.
III.4 Age Determination from Th/U Chronometer
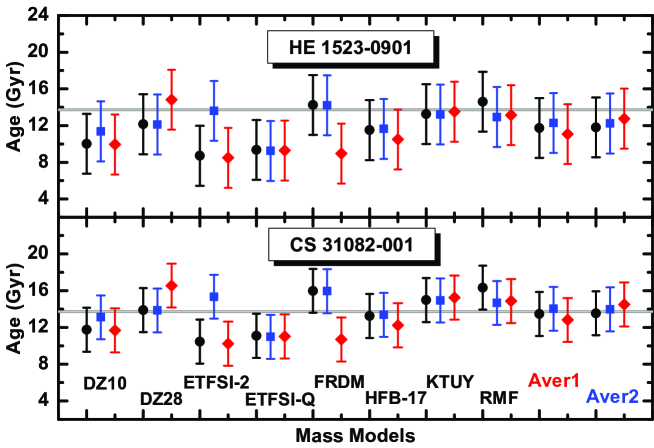
With the initial -process abundance ratio Th/U and their present observed values, one can eventually deduce the age of low metallicity stars. In Fig. 5, the ages of the metal-poor stars HE 1523-0901 and CS 31082-001 are summarized. The circles (squares, diamonds) denote ages determined using the fit I (II, III). The average ages for all mass models and the three mass models DZ10, DZ28, HFB-17 are labeled as Aver1 and Aver2, respectively. The errors are attributed to uncertainties from observations of the corresponding metal-poor stars. The shadowed area corresponds to the age of the universe derived from WMAP data WMAP .
In general, for a given mass model, the ages determined using different fits are in good agreements with each other. The discrepancy is generally within 2.7 Gyr. This reflects that the age estimate is not sensitive to different fits, which correspond to the possible astrophysical conditions of -process calculation. Similar conclusion is also obtained based on the dynamical -process model in Ref. Otsuki2003NA . As for the ETFSI-2 or FRDM models, the production ratio Th/U predicted from the fit III is too large to give a reasonable age for the solar system (refer to Fig. 2).
On the other hand, for a fixed fit, the deviation using different mass models is rather large. The corresponding difference can be as large as 5.9, 5.0, and 6.3 Gyr for the fit I, II, and III, respectively. From the above discussion, it is clear that the DZ10, DZ28, and KTUY simulations better reproduce the stable element abundances than the others. Furthermore, their predictions for Th/U production ratio are also consistent with the constraint from the Th/U ratio measured in the solar system. Therefore, these mass models might be more credible and are selected to estimate the age of the metal-poor star.
In order to estimate the age of the star more reliably, one could adopt the average values for different simulations. The corresponding uncertainty is their root mean square deviation. In this way, the discrepancy between the average values of ages estimated using the three selected mass models for different fits decreases to 0.9 Gyr. For the fit I, the age of the metal-poor star HE 1523-0901 is obtained as Gyr which agrees with the value of Gyr in Ref. HE15230901 . The uncertainty of age determined here includes that of 1.6 Gyr from nuclear mass models and 3.3 Gyr from observation. Similarly, ages of CS 31082-001 and BD +17∘3248 are deduced as Gyr and Gyr, respectively. These results can served as the lower limit of the cosmic age, and are in consistent with results derived from the WAMP data WMAP .
For comparison, the corresponding average ages for all the mass models using the fit I are determined as , , and Gyr for HE 1523-0901, CS 31082-001, and BD +17∘3248, respectively, with uncertainties of 2.2 Gyr from nuclear mass models. In Table 1, we have tabulated the predicted abundances of Th and U, the production ratios Th/U, and the ages of the metal-poor stars HE 1523-0901, CS 31082-001, BD +17∘3248 for different fits.
IV Summary and perspective
In this paper, we have analyzed the -process actinide production and determined the ages of the metal-poor stars HE 1523-0901, CS 31082-001, BD +17∘3248. The predictions are made within the framework of the classical -process model. This approach is especially suitable for evaluating uncertainties emerging from the nuclear physics inputs and the astrophysical conditions. In the calculations, new developments in mass models and the updated stellar data have been considered. By directly simulating the observed abundances in the low-metallicity stars or the solar system, the impact of the potential uncertainties in -process nucleosynthesis condition on the Th/U chronometer is investigated. It is found that the age estimate is more sensitive to the mass models than the fits. By adopting the three selected mass models (i.e., DZ10, DZ28, KTUY), the ages of the metal-poor stars HE 1523-0901, CS 31082-001, and BD +17∘3248 are determined as 11.8, 13.5, and 10.9 Gyr, respectively, with an uncertainty of about 1.6 Gyr from nuclear mass models. Moreover, the impact of the mass predictions and -decay rates on the Th/U chronometer have been discussed in details.
In order to distinguish the difference between various fitting cases (thus possible different origins of elements in very metal-poor stars), the stellar data, especially those missing abundances in the medium heavy elements, are urgently required in our investigations. Meanwhile, the stellar data of heavy elements heavier than Au, also play a very important role in -process chronometers, and can be used as a test for the corresponding mass predictions of heavy isotopes in different mass models.
V Acknowledgements
We would like to thank F. Montes for valuable discussions. This work is partly supported by Major State 973 Program 2007CB815000 and the NSFC under Grant Nos. 10775004, 10975008 and 10947149.
References
- (1) C. Sneden, A. McWilliam, G. W. Preston, J. J. Cowan, D. L. Burris, and B. J. Armosky, Astrophys. J. 467, 819 (1996).
- (2) J. J. Cowan, B. Pfeiffer, K.-L. Kratz, F.-K. Thielemann, C. Sneden, S. Burles, D. Tytler, and T. C. Beers, Astrophys. J. 521, 194 (1999).
- (3) J. Westin, C. Sneden, B. Gustafsson, and J. J. Cowan, Astrophys. J. 530, 783 (2000).
- (4) I. I. Ivans, J. Simmerer, C. Sneden, J. E. Lawler, J. J. Cowan, R. Gallino, and S. Bisterzo, Astrophys. J. 645, 613 (2006).
- (5) J. J. Cowan, A. McWilliam, C. Sneden, and D. L. Burris, Astrophys. J. 480, 246 (1997).
- (6) R. Cayrel et al., Nature 409, 691 (2001).
- (7) Due to the significant short half-life of 235U ( yr) compared to 238U ( yr), we approximate the uranium abundances that of 238U. For briefly, we’ll use Th and U represent 232Th and 238U hereafter.
- (8) J. J. Cowan et al., Astrophys. J. 572, 861 (2002).
- (9) A. Frebel, N. Christlieb, J. E. Norris, C. Thom, T. C. Beers, and J. Rhee, Astrophys. J. 660, L117 (2007).
- (10) J. J. Cowan and C. Sneden, Nature 440, 1151 (2006).
- (11) C. Travaglio, R. Gallino, E. Arnone, J. J. Cowan, F. Jordan, and C. Sneden, Astrophys. J. 601, 864 (2004).
- (12) Y.-Z. Qian and G. J. Wasserburg, Phys. Rep. 442, 237 (2007).
- (13) F. Montes et al., Astrophys. J. 671, 1685 (2007).
- (14) K.-L. Kratz, J. P. Bitouzet, F.-K. Thielemann, P. Möller, and B. Pfeiffer, Astrophys. J. 403, 216 (1993).
- (15) B. Pfeiffer, K.-L. Kratz, and F.-K. Thielemann, Z. Phys. A 357, 235 (1997).
- (16) M. Arnould, S. Goriely, and K. Takahashi, Phys. Rep. 450, 97 (2007).
- (17) S. Goriely and M. Arnould, Astron. Astrophys. 379, 1113 (2001).
- (18) H. Schatz, R. Toenjes, B. Pfeiffer, T. C. Beers, J. J. Cowan, V. Hill, and K.-L. Kratz, Astrophys. J. 579, 626 (2002).
- (19) K.-L. Kratz, K. Farouqi, B. Pfeiffer, J. W. Truran, C. Sneden, and J. J. Cowan, Astrophys. J. 662, 39 (2007).
- (20) V. Hill et al., Astron. Astrophys. 387, 560 (2002).
- (21) C. Sneden et al., Astrophys. J. 591, 936 (2003).
- (22) C. Sneden, J. J. Cowan, and R. Gallino, Annu. Rev. Astron. Astrophys. 46, 241 (2008), and references therein.
- (23) C. Sneden, J. E. Lawler, J. J. Cowan, I. I. Ivans, and E. A. Den Hartog, Astrophys. J. Suppl. Ser., 182, 80 (2009), and references therein.
- (24) B. Sun and J. Meng, Chin. Phys. Lett. 25, 2429 (2008).
- (25) B. Sun, F. Montes, L. S. Geng, H. Geissel, Yu. A. Litvinov, and J. Meng, Phys. Rev. C 78, 025806 (2008).
- (26) D. W. Marquardt, J. Soc. Ind. Appl. Math. 11, 431 (1963).
- (27) C. Freiburghaus, J.-F. Rembges, T. Rauscher, E. Kolbe, F.-K. Thielemann, K.-L. Kratz, B. Pfeiffer, and J. J. Cowan, Astrophys. J. 516, 381 (1999).
- (28) B. Pfeiffer, K.-L. Kratz, F.-K. Thielemann, and W. B. Walters, Nucl. Phys. A693, 282 (2001).
- (29) R. Surman, J. Beun, G. C. McLaughlin, and W. R. Hix, Phys. Rev. C 79, 045809 (2009).
- (30) Y.-Z. Qian, W. C. Haxton, K. Langanke, and P. Vogel, Phys. Rev. C 55, 1532 (1997).
- (31) M. Terasawa, K. Langanke, T. Kajino, G. J. Mathews, and E. Kolbe, Astrophys. J. 608, 470 (2004).
- (32) S. Van Eck, S. Goriely, A. Jorissen, and B. Plez, Nature 412, 793 (2001).
- (33) G. Audi, O. Bersillon, J. Blachot, and A. H. Wapstra, Nuclear Physics A729, 3 (2003).
- (34) B. Sun, et al., Nuclear Physics A812, 1 (2008).
- (35) S. Goriely, N. Chamel, and J. M. Pearson, Phys. Rev. Lett. 102, 152503 (2009).
- (36) L. S. Geng, H. Toki, and J. Meng, Prog. Theor. Phys. 113, 785 (2005).
- (37) H. Koura, M. Uno, T. Tachibana, and M. Yamada, Nucl. Phys. A674, 47 (2000); H. Koura, T. Tachibana, M. Uno, and M. Yamada, Prog. Theor. Phys. 113, 305 (2005).
- (38) J. Duflo and A. P. Zuker, http://csn-srv3.in2p3.fr/AMDC/theory/dz_zu_10.feb96fort.
- (39) J. Duflo and A. P. Zuker, Phys. Rev. C 52, R23 (1995).
- (40) S. Goriely, in 10th International Symposium on Capture Gamma-Ray Spectroscopy and Related Topics, edited by S. Wender (AIP Conference Proceedings 529, 2000), p. 287.
- (41) J. M. Pearson, R. C. Nayak, and S. Goriely, Phys. Lett. B387, 455 (1996).
- (42) P. Möller, J. R. Nix, W. D. Myers, and W. J. Swiateck, Atom. Data Nucl. Data Tables 59, 185 (1995).
- (43) P. Möller, B. Pfeiffer, and K.-L. Kratz, Phys. Rev. C 67, 055802 (2003).
- (44) I. N. Borzov and S. Goriely, Phys. Rev. C 62, 035501 (2000).
- (45) J. R. Stone, J. Phys. G 31, R211 (2005).
- (46) H. Olofsson, S. Åberg, O. Bohigas, and P. Leboeuf, Physc. Rev. Lett. 96, 042502 (2006).
- (47) K. Lodders, Astrophys. J. 591, 1220 (2003).
- (48) C. E. Rolfs and W. S. Rodney, Cauldrons in the Cosmos (The University of Chicago Press, Chicago, 1988).
- (49) E. Komatsu et al., Astrophys. J. Suppl. Ser. 180, 330 (2009).
- (50) K. Otsuki, G. J. Mathews, and T. Kajino, New Astron. 8, 767 (2003).

| Fit | Mass Model | 232Th | 238U | 232Th238U | HE 1523-0901 | CS 31082-001 | BD +17∘3248 |
|---|---|---|---|---|---|---|---|
| I | DZ10 | 0.0643 | 0.0256 | 2.51 | 10.01 | 11.76 | 9.14 |
| DZ28 | 0.1468 | 0.0732 | 2.01 | 12.14 | 13.88 | 11.27 | |
| ETFSI-2 | 0.1125 | 0.0390 | 2.88 | 8.71 | 10.45 | 7.84 | |
| ETFSI-Q | 0.1007 | 0.0374 | 2.69 | 9.36 | 11.10 | 8.48 | |
| FRDM | 0.2009 | 0.1252 | 1.60 | 14.25 | 15.99 | 13.38 | |
| HFB-17 | 0.1413 | 0.0659 | 2.14 | 11.51 | 13.25 | 10.64 | |
| KTUY | 0.2387 | 0.1338 | 1.78 | 13.25 | 14.99 | 12.38 | |
| RMF | 0.6605 | 0.4273 | 1.55 | 14.60 | 16.34 | 13.73 | |
| II | DZ10 | 0.1153 | 0.0530 | 2.18 | 11.37 | 13.11 | 10.50 |
| DZ28 | 0.2023 | 0.1006 | 2.01 | 12.11 | 13.86 | 11.24 | |
| ETFSI-2 | 0.0140 | 0.0081 | 1.72 | 13.61 | 15.35 | 12.74 | |
| ETFSI-Q | 0.6341 | 0.2326 | 2.73 | 9.24 | 10.98 | 8.37 | |
| FRDM | 0.0644 | 0.0400 | 1.61 | 14.21 | 15.95 | 13.34 | |
| HFB-17 | 0.5475 | 0.2588 | 2.12 | 11.64 | 13.38 | 10.76 | |
| KTUY | 0.3495 | 0.1951 | 1.79 | 13.21 | 14.95 | 12.34 | |
| RMF | 0.0128 | 0.0069 | 1.84 | 12.93 | 14.67 | 12.06 | |
| III | DZ10 | 0.0794 | 0.0314 | 2.53 | 9.94 | 11.69 | 9.07 |
| DZ28 | 0.1119 | 0.0741 | 1.51 | 14.82 | 16.56 | 13.95 | |
| ETFSI-2 | 0.0866 | 0.0294 | 2.95 | 8.49 | 10.23 | 7.62 | |
| ETFSI-Q | 0.0464 | 0.0171 | 2.71 | 9.28 | 11.02 | 8.41 | |
| FRDM | 0.1228 | 0.0437 | 2.81 | 8.95 | 10.69 | 8.08 | |
| HFB-17 | 0.1385 | 0.0580 | 2.39 | 10.49 | 12.23 | 9.62 | |
| KTUY | 0.1331 | 0.0767 | 1.74 | 13.51 | 15.25 | 12.64 | |
| RMF | 0.1795 | 0.0995 | 1.80 | 13.14 | 14.88 | 12.27 |