Phase Transitions and Dynamics in Bulk and Interfacial Water
Abstract
New experiments for water at the surface of proteins at very low temperature display intriguing dynamic behaviors. The extreme conditions of these experiments make it difficult to explore the wide range of thermodynamic state points needed to offer a suitable interpretation. Detailed simulations suffer the same problem, where equilibration times at low temperature become unreasonably long. We show how Monte Carlo simulations and mean field calculations of a tractable model of water help interpret the experimental results. Here we summarize the results for bulk water and investigate the thermodynamic and dynamic properties of supercooled water at an interface.
1 Introduction
Water is essential in biology, because it participates in nearly every process necessary for life (including cell metabolism, transport of nutrients and residues, protein conformation changes, etc.), and is the most common solvent in chemistry. It regulates a large variety of processes, including atmospheric phenomena, the formation of geophysical structures, the propagation of cracks in stones and cement, the sliding of glaciers, the transport in plants, and is ubiquitous in the universe as ice in the interstellar space. In all these examples the properties of water are essential to understand what is observed.
Nevertheless, water has proven to be a complex puzzle to many researchers for its anomalous thermodynamic and dynamic properties at room temperature and pressure. For example, by decreasing temperature at pressure atm, water’s volume fluctuations, proportional to the isothermal compressibility , increase below C, and entropy fluctuations, proportional to the isobaric specific heat increase below C, while in normal liquid any fluctuation decreases when is decreased [1, 2, 3]. These water’s anomalies grow upon cooling and increase in number. For example below C the cross-fluctuation of volume and entropy, proportional to the isobaric thermal expansion coefficient , becomes negative [4], while it is always positive in normal liquids where the entropy decreases when the volume decreases [5].
By decreasing even more, it is experimentally possible to supercool liquid water down to C at 1 atm and to C at 2000 atm, where the liquid is metastable with respect to crystal phases [1]. These extreme conditions are not unusual in nature, where water exists in its liquid form at C in insects, C in clouds or C in plants [6]. Below the homogeneous nucleation of crystal ice occurs in a time too short to allow any measurements. But even the crystal phase of water is not simple. In fact, water is a polymorph with at least sixteen forms of crystal ices, the last one, Ice XV, was discovered in 2009 [7].
However, at very low , crystal water is not the only possible kind of ice. By rapidly quenching liquid water below C [8], or by condensing the vapour at low [9], or by compressing crystal ice at low [10], or by irradiation (with ions for example [11]), it is possible to solidify water as an amorphous, or glass, i. e. a form that has the elastic properties of a solid, but the structure of a liquid with no long-range order [12]. As for the crystal state, the amorphous state of water is also not unique. Water is a polyamorph with at least three different amorphous states: low–density amorphous (LDA), discovered in 1935 [13], high–density amorphous (HDA), discovered in 1984 [14], and very high-density amorphous ice (VHDA), discovered in 2001 [15].
All these anomalies of water are a consequence of the properties of the hydrogen bond network that they form. The hydrogen bond interaction is characterized by a preferred geometrical configuration, that at low and is approximately a tetrahedron of four molecules around a central one, with an angle varying around (slightly smaller than a tetrahedral angle of ) and a distance oscillating around Å[5]. The local arrangement, including the number of nearest neighbours, can change with and . In particular, in 2000 Soper and Ricci observed at K, compressing from to MPa, a continuous transformation from low–density liquid (LDL) local arrangement of water with an open, hydrogen-bonded tetrahedral structure, to high–density liquid (HDL) local arrangement with nontetrahedral O-O-O angles and a collapsed second coordination shell with broken hydrogen bonds, and a change in density of about 73% [16].
1.1 Thermodynamic Interpretations of Water Behavior
All the above results are consistent with theories that propose different mechanisms and different phase behaviors in the supercooled region. They can be summarized in four possible scenarios for the phase diagram.
(i) In the stability limit (SL) scenario [17] the behavior of the superheated liquid spinodal, i. e. the limit of stability of the liquid with respect to the gas, and the stretched water, i. e. water under tension as in a plant fibers, are related. In particular, it is hypothesized that the limits of stability of these two regions are continuously connected at negative pressure, forming a re-entrant curve toward the positive region below . The response functions, including , and , diverge when is decreased a positive as a consequence of the approaching of the re-entrant spinodal line.
(ii) In the liquid–liquid critical point (LLCP) scenario [18] it is hypothesized the existence of a LDL–HDL first–order phase transition line with negative slope in the plane and terminating in a critical point . Below the critical pressure the response functions increase on approaching the Widom line (the locus of correlation length maxima emanating from into the one–phase region) [5], and for by approaching the HDL–to–LDL spinodal line. The possibility with have also been proposed [19].
(iii) In the singularity–free (SF) scenario [20] it is hypothesized that the low- anticorrelation between volume and entropy gives rise to response functions that increase upon cooling and display maxima at non–zero , but do not display any singular behavior. Specifically, Sastry et al. [20] show that this is a direct consequence of the fact that water’s line of temperatures of maximum density (TMD) has a negative slope in the plane.
(iv) In the critical–point free (CPF) scenario [21] it is hypothesized that a first–order phase transition line separates two liquid phases and extends to toward the superheated limit of stability of liquid water. This scenario effectively predicts a continuous locus of stability limit spanning the superheated, stretched and supercooled state, because the spinodal associated with the first–order transition will intersect the liquid–gas spinodal at negative pressure. No critical point is present in this scenario.
Since all these scenarios are consistent with the available experimental data, a natural question is if we can design an experiment that would discriminate among them. Unfortunately, many scientists have discovered that an answer to this question is a difficult challenge [21]. In fact, experiments on bulk water are hampered by freezing below , and no measurements on bulk liquid water can be performed with our present technology below this temperature. Nevertheless, the different proposed theories have different implications on phenomena such as the cold denaturation (and stop of activity) of proteins at low , an important issue in cryopreservation, cryonics, cryostasis and cryobiology.
1.2 Interfacial Water
One possible strategy to probe supercooled water at very low is to consider water at an interface. Water adsorbed onto the surface of proteins or confined in nanopores freezes at much lower than bulk water, giving access to a low-temperature region where interfacial water is still liquid, while bulk water would not be [22]. In many cases of interest for practical purposes in biology, geology or industrial applications, water is hydrating a surface or is confined. As a consequence, fundamental research in physics and chemistry has been performed in recent years with experiments [21, 23, 24, 25, 26, 27, 28, 29, 22, 30], theories and simulations [31, 32, 33, 34].
During the last years experiments on water in Vycor micropores [35], in nanopores of MCM-41 silica [36, 37, 38], of sol–gel silica glass [39], of NaA zeolites [40], or of double-wall carbon nanotubes [41] have contributed to the investigation of water dynamics in confinement. In particular, confinement in hydrophilic MCM-41 silica nanopores of and nm diameter allows to study water dynamics down to K where quasielastic neutron scattering reveals a crossover at K in the average translational relaxation time from a non-Arrhenius behavior at high to an Arrhenius behavior at low [42]. A similar crossover is also observed for the self-diffusion coefficient of water by nuclear magnetic resonance at K [43]. By increasing from bars to bars the external pressure applied on a sample of MCM-41 silica nanopores with nm diameter at full hydration level of g of H2O per g of silica, it has been observed that the crossover occurs at lower , reaching K at bars and disappears at higher [44].
Quasielastic neutron scattering experiments show the same crossover for the average translational relaxation time of at least three different systems: (i) water hydrating lysozymes, at hydration level g of H2O per g of dry lysozyme, for K, a temperature below which the protein has a glassy dynamics [30], (ii) DNA hydration water, at hydration level corresponding to about 15 water molecules per base pairs, for K, at which DNA displays the onset of anharmonic molecular motion [45], and (iii) RNA hydration water, at a similar hydration level, for K, where both RNA and its hydration water exhibit a sharp change in slope for the mean-square displacements of the hydrogen atoms [46],
All these results can be interpreted as a consequence of a structural rearrangement of water molecules associated with a LDL-HDL critical point [44]. In fact, along the Widom line in the supercritical region of the LDL-HDL critical point, the changes in the hydrogen bond network are consistent with the dynamic behavior observed in the experiments, as we will discuss in the following sections.
This interpretation has been criticized [47] on the base of similar crossover observed for water confined in molecular sieves [48] or for water mixtures [49] and water solutions [50]. It has also been proposed a possible interpretation as a consequence of the dynamics of (Bjerrum-type) defects due to orientationally disordered water molecules that are hydrogen bonded to less than four other water molecules [51, 52].
2H-NMR studies on hydrated proteins, at a comparable hydration level as in [44], show no evidence for the crossover at K and indicate that water performs thermally activated and distorted tetrahedral jumps at K, which may be related to a universal defect diffusion [28]. Also, dielectric spectroscopy studies of hydrated protein show a smooth temperature variations of conductivity at K and ascribe the crossover observed in neutron scattering to a secondary relaxation that splits from the main structural relaxation [29, 53].
On the other hand, numerical simulations for bulk water show that crossing the Widom line emanating from a LDL-HDL critical point, the structural change in water is maximum, as emphasized by the maximum in specific heat, and the diffusion constant has a crossover [54]. This result is observed also in water hydrating lysozyme or DNA, where the dynamic transition of the macromolecules occurs at the temperature of dynamic crossover in the diffusivity of hydration water and also coincides with the maximum change in water structure [55].
A crossover from high- non-Arrhenius to low- Arrhenius behavior is observed also in simulation of water hydrating lysozyme powder in the translational correlation time and in the inverse of the self-diffusion constant, in agreement with the neutron scattering experiments, at about K [56]. The activation energy for the Arrhenius regime is found to be of about eV, as in the neutron scattering experiments [56]. Also, simulations of water hydrating elastin-like and collagen-like peptides show this crossover, but with a weaker change in the slope and an Arrhenius activation energy of about eV, consistent with dielectric spectroscopy and nuclear magnetic resonance studies [57, 28].
It is therefore difficult not only in the experiments, but also in the models to get a clear answer about the relevant dynamic mechanisms and their relation with the thermodynamics in water at interfaces. Moreover, the relation between confined water and bulk water remains not fully understood. For this reason models that are tractable with a theoretical approach are particularly appealing in this context. With these models, in fact, simulations can be compared with analytic calculations to develop a consistent theory.
2 Cooperative Cell Model for a Monolayer of Water
We consider the case of water in two dimensions (2D). This case can be considered as an extreme confinement of one single layer of water between two repulsive (hydrophobic) walls when the distance between the walls is such to inhibit the crystal formation [58]. In fact, it has been shown that the relevant parameter to avoid the transition to a crystal phase is the distance between the confining wall and not the characteristics of the hydrophobic interaction with the wall [58].
Another case in which the study of a monolayer of water is relevant is when a substrate of protein powder is, on average, hydrated only by a single layer of water, and the proteins do not undergo any configurational transformation and/or large scale motion [59]. In these conditions, for a hydrophilic protein surface, we can assume that the effect of the water–protein interaction is to attract water on a surface that, by constraining the water molecule positions, inhibits its crystallization.
A very desirable feature of a model for a liquid is transferability. The parameters and effective interactions of a model are optimized to precisely reproduce static and dynamic properties of the liquid at one particular thermodynamic state point. The quality of the model is measured by the range of validity of its predictions in other state points. Unfortunately, there is no water model that is truly transferable, nor can reproduce all the properties of water [60]. Many routes have been explored to solve this issue. Molecular polarizability [61, 62] is one way to introduce effects not considered by standard pairwise additive potentials. However, polarizable models are computationally very expensive and provide only a partial solution [63]. An alternative way is to include many–body effects into the potential. In the following we define a model with an effective many–body interaction introduced through a cooperative hydrogen bond term.
2.1 Definition of the Model with Cooperative Interaction
We consider molecules in a volume with periodic boundary conditions (p.b.c.) in two dimensions, and the size of about one single molecule (and no p.b.c.) in the third dimension. We initially consider the case in which the molecules are distributed in a homogeneous way, with each molecule occupying the same volume larger than a hard–core volume Å3 due to short-range electron clouds repulsion. We consider the case in which each molecule has coordination number four, consistent with the tendency of a water molecule to minimize its energy by forming four hydrogen bonds.
The interaction Hamiltonian for water molecules is [64, 65, 66, 5]
| (1) |
where denotes the sum of all the isotropic interactions (e. g. van der Waals) between molecules at distance , represented by a Lennard–Jones potential with attractive energy plus a hard–core at distance .
The second term (with if and otherwise, and denoting that and are nearest–neighbors) accounts for the directional contribution to the hydrogen bond energy with strength , where is a (Potts) variable representing the orientational state of the hydrogen (or the lone e-) of molecule facing the lone e- (or the hydrogen, respectively) of the molecules . For the sake of simplicity we do not distinguish between hydrogen and lone e-, associating to each molecule four equivalent bond indices . We choose the parameter by selecting 30o as the maximum deviation from a linear bond, i. e. the O—H….O angle is less than 30o, as estimated from Debye-Waller factors [67, 68]. Hence, and every molecule has possible orientations. The effect of choosing a different value for has been analyzed in [5].
The third term (with indicating each of the six different pairs of the four bond indices of molecule ) represents an interaction accounting for the hydrogen bond cooperativity and giving rise to the O–O–O correlation [25], locally driving the molecules toward an ordered (tetrahedral in the bulk) configuration with lower energy.
By defining the energy per hydrogen bond (between and ) as the sum of the interactions in which two bonded molecules ( and ) are participating, we obtain , where is the number of cooperative interactions in which that bond variables ( and ) are partaking. If we choose as parameters kJ/mol (consistent with the value kJ/mol of the estimate of the van der Waals attraction based on isoelectronic molecules at optimal separation [69]), kJ/mol and kJ/mol, the values of ranges between and kJ/mol depending on . However, a definition of based on a cluster of or bonded molecules in 3-dimensions increases this range up to or kJ/mol, respectively. Therefore, depends on the environment (the value of and the number of molecules bonded in a cluster), as observed in computer simulation of the crystalline phases of ice [70], and has values within the range 6.3 [71]— 23.3 kJ/mol [72], proposed on the base of experiments.
Experiments show that formation of the hydrogen bonds leads to an open —locally tetrahedral— structure that induces an increase of volume per molecule [73, 16]. This effect is incorporated in the model by considering that a full bonded molecule, i. e. a molecule with four hydrogen bonds, has a molecular volume larger than a non-bonded molecule by an amount
| (2) |
where is the volume increase per H bond. Hence, if
| (3) |
is the total number of hydrogen bonds in the system, the hydrogen bond contribution to the total volume is
| (4) |
We adopt Å consistent with the expected value of the van der Waals radius [74], and , with , corresponding to a maximum hydrogen bond distance of about Å, consistent with the range of a water molecule’s first coordination shell, Å, as determined from the oxygen-oxygen radial distribution function [75].
3 The Phase Diagram
The model is studied using both mean–field (MF) analysis and Monte Carlo (MC) simulations. The MF approach has been describe in details in Ref.s [5, 76]. It consists of expressing the molar Gibbs free energy in terms of an exact partition function for a portion of the system made of a treatable number of degrees of freedom. We take into account the effect of all the rest of the system as a mean field acting on the border of this portion [5, 64, 65, 66, 76, 77, 78, 79, 80, 81, 82].
MC simulations are performed at constant , , , allowing the volume of the system to fluctuate as a stochastic variable. The average distance between the molecules is then calculated as , where in two dimensions. The total volume of the system is by definition
| (5) |
where is the hydrogen bond volume contribution in Eq.(4). Note that is not included in the calculation of to avoid MF–type long–range correlation in volume fluctuations in the MC simulations.
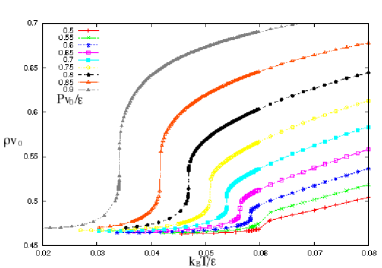
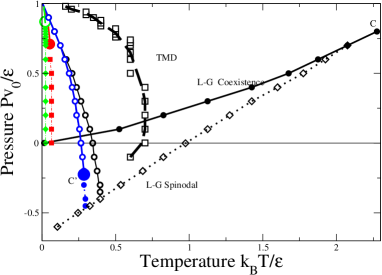
For the parameters choice , and , we find that the density as a function of at constant displays a discontinuous change at high and low corresponding to the gas-liquid first order phase transition anding in a critical point where the discontinuity disappears (Fig. 1a). By decreasing , the density reaches a maximum, that in real water at atmospheric pressure occurs at C. At lower , in the supercooled state, and higher we find another discontinuity in density, this time with a lower density at lower (Fig. 1b). The system at these supercooled displays a first order phase transition from HDL to LDL, as hypothesized in the LLCP scenario (Fig. 2).
(a)
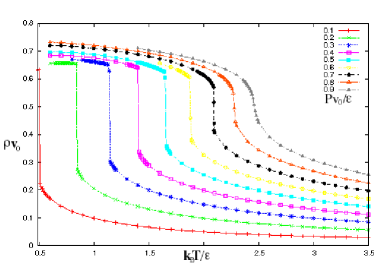 (b)
(b)
3.1 Effect of Hydrogen Bond Cooperativity on the Behavior of Water
The experiments for confined water have boosted the debate over the supercooled phase diagram of water, motivating the proposal of the CPF scenario hypothesized by C. A. Angell [21], as described above. This new scenario leads to questions such as
-
(i)
How to understand the new Angell hypothesis?
-
(ii)
How to connect it to the other three existing hypotheses?
A recent work by Stokely et al. [83] succeeds in answering both questions (i) and (ii). Specifically, it is shown that all four existing hypotheses are cases of the cooperative water model. Thus no matter which hypothesis may be correct (if any is correct), it is possible that the underlying mechanism is basically the same—the thermodynamic properties of water can be accounted for by considering two main contributions to the hydrogen bond interaction: (a) the directional (or covalent) contribution (parametrized by in the model) and (b) the three-body (or cooperative) contribution (parametrized by in the model).
By MF calculations and MC simulations, Stokely et al. [83] demonstrate that the balance between contributions (a) and (b) determines which of the four hypotheses presented in section 1.1. best describes experimental facts. Since the characteristic energy associated with these two contributions can be estimated, the work allows to begin to validate or contradict each hypothesis on an experimental basis.
Specifically, by fixing the parameters and , and varying the parameter , it is possible to observe that the cooperative model reproduces all four scenarios of section 1.1. The overall picture that emerges is one in which the amount of cooperativity among H bonds (), in relation to the H bond directional strength (), governs the location of a LLCP, hence which scenario is realized. For zero cooperativity, the temperature where and diverge is at zero temperature, and no liquid-liquid transition exists for –the SF scenario. For very large cooperativity, lies outside the region of stable liquid states, and a liquid-liquid transition extends to the entire (supercooled and superheated) liquid phase–the CPF/SL scenario. For intermediate values of H bond cooperativity, varies in a smooth way between these two extremes–the LLCP scenario. Due to the anticorrelation between the volume and entropy associated to the H bonds, the larger , the smaller , eventually with for larger cooperativity. These cases are summarized in Fig. 3.
(a)
 (b)
(b)
4 Water at Interfaces
To elucidate the relation between the protein dynamic crossover at about K and the dynamic crossover observed for the average translational correlation time in the first layer of protein hydration water [30, 45, 46, 44], we perform MF calculations and MC simulations of the cooperative model of water of section 2.1. Since we are interested in cases at low humidity, we consider the case of a water monolayer hydrating an immobile surface of globular protein that, forcing the water molecules out of place with respect to crystal configurations, inhibits the crystallization. We focus on the hydrogen bonds dynamics, regardless if the hydrogen bonds are formed with the protein or among water molecules.
4.1 The Hydrogen Bond Dynamics for Hydrated Proteins
Following the work of Kumar et al. [80, 79, 81], Mazza et al. [59] study the orientational correlation time associated with the hydrogen bond dynamics of the model is in section 2.1. They confirm the occurrence of a dynamic crossover at a temperature of about corresponding to the of maximum variation of the number of hydrogen bonds, that in turn corresponds to the Widom line. They also confirm that the crossover is from a non–Arrhenius behavior at high to another non–Arrhenius behavior [82], that closely resembles an Arrhenius behavior around the crossover.
These results are consistent with those from simulations of other models for hydrated proteins where a crossover in the translational dynamics is observed [55]. The difference here is that (i) the crossover is for the dynamics of the hydrogen bonds, (ii) in the cooperative water model the crossover can be calculated from MF and an exact relation can be found between the crossover and the Widom line, and (iii) the model can test different hypotheses. In particular, Kumar et al. have shown that the crossover at is independent of whether water at very low temperature is characterized by a LLCP or is SF. In fact, the crossover is a consequence of the sharp change in the average number of hydrogen bonds at the temperature of the specific heat maximum, that occurs in both scenarios. Kumar et al. were able also to make predictions about the –dependence of quantities characterizing the crossover at : (i) the time scale of the crossover, showing that it is independent of (isochronic crossover); (ii) the activation energy of the apparent Arrhenius behavior at low and (iii) the crossover temperature, showing that both (ii) and (iii) decrease linearly upon increasing [80]. These predictions have been confirmed by Chu et al. [84, 82] in a study on the dynamics of a hydrated protein under moderately high pressures at low temperatures using the quasielastic neutron scattering method. They relate these predictions (i)–(iii) to the mechanical response of the protein to an external force, that is the average elastic constant calculated from the mean square displacement of the protein atoms. In particular, the degree of “softness” of the protein, related to the enzymatic activity, is preserved at lower if the pressure is increased [84]. However, a criterion proposed in Ref. [80] for discriminating which scenario better describe water on the basis of the crossover at , cannot be tested in the experiments since the predicted difference between the two scenarios (of the order of 1%) is within the error bars of the measurements [82].
The answer to the puzzle of which of the scenarios better describe water might be related to the very recent experimental discovery of another crossover for the hydrogen bond to an Arrhenius behavior at very low , of the order of K at hydration g H2O/g. This crossover has been observed by Mazza et al. at [59], in relation to an ordering process of the hydrogen bonds leading to the HDL-LDL critical point. The study has been possible thanks to the use of a highly efficient cluster MC dynamics [85, 86]. This very–low crossover would reduce even more the at which the proteins preserve their “softness”, essential for their correct functionality.
4.2 Water Monolayer in Hydrophobic Confinement
By considering partially hydrated hydrophobic plates at a distance such to inhibit the crystallization of water at low , Franzese and de los Santos [87] have show that water has a glassy behavior [88] for both the translational and rotational degrees of freedom when cooled down to a low . This result is consistent with simulations of TIP4P water forming a quasi-2d amorphous when confined in a hydrophobic slit pore with wall-to-wall separation just enough to accommodate two molecular layers [89].
At higher the hydrogen bond network builds up in a less gradual way, allowing the system to equilibrate the rotational degrees of freedom also at very low , but not the translational degrees of freedom. This effect is emphasized by the appearance of many dehydrated regions [87], as also observed in water confined between two protein-like hydrophobic flattened surfaces at distances ranging from to nm [33].
When is close to the LLCP value, the cooperativity of the hydrogen bond network induces a strong non-exponential behavior [90] for the hydrogen bond correlation function. However, both rotational and translational degrees of freedom equilibrate within the simulation time. At higher the rotational correlation function recovers the exponential behavior and the diffusion of the system allows the formation a large dry cavity, while the rest of the surface is well hydrated. It is interesting to observe that the cooperative model allows to calculate, in the MF approximation, the diffusion constant at any and [91].
The hydrophobic confinement has effects also on water thermodynamics. It shifts the HDL-LDL phase transition to lower temperature and lower pressure compared to bulk water when the confinement is between plates [92, 93]. Moreover, it shifts both the line of maximum density and the liquid-to-gas spinodal toward higher pressures and lower temperatures with respect to bulk when the confinement is in a hydrophobic disordered matrix of soft spheres [34]. This result is confirmed also in the analysis performed by using the cooperative water model in confinement between hydrophobic hard spheres [94]. However, the effect of the matrix on the HDL-LDL critical point is less clear and is presently under investigation.
5 Conclusions
The effect of confinement is of great interest to biology, chemistry, and engineering, yet the recent experimental and simulations results are object of an intense debate. A better understanding of the physico–chemical properties of liquid water at interfaces is important to provide accurate predictions of the behavior of biological molecules [95], including the folding-unfolding transitions seen in proteins [96, 97, 98], and the dynamical behavior of DNA [45]. However, it is still unclear whether such behaviors are inherent in the structure of such molecules, or an effect of water in which they are always found, or due to the interactions between the two.
To get insight into this subject the formulation of a model that allows the development of a theory could be useful to find functional relations connecting different observables. The advantage of this approach is to have two independent ways of approaching the problem, one theoretical and the other numerical.
We have presented here several recent results obtained with a cooperative water model suitable for studies with mean field theories and with , , simulations with thousands of molecules. The model has been studies in the context of water monolayers on hydrated proteins, between hydrophobic surfaces or in a hydrophobic matrix.
Some of the conclusions reached with this model are the following.
-
•
The different scenarios proposed to interpret the low- behavior of water are instances of the same mechanism, with different values of the directional (covalent) strength and the cooperative (many-body) interaction of the hydrogen bonds. The parameters that can be estimated from the experiments suggest that the scenario with the LLCP is the most plausible for water.
-
•
Previous experiments showing one dynamic crossover in the water monolayer hydrating proteins, RNA and DNA are consistent with (at least) two scenarios.
-
•
The possibility of a second dynamic crossovers detectable at lower and lower hydration level would be consistent only with the LLCP scenario, because its origin would be related to the ordering of the hydrogen bond network.
-
•
A consequence of the occurrence of a LLCP should be detectable when the translational and rotational dynamics of water are studied for a monolayer in a hydrophobic confinement. In particular, the rotational dynamics should appear with the strongest non-exponential behavior in the vicinity of the LLCP, as an effect of the cooperativity. Moreover, the slow increase of the number of hydrogen bonds at ow and low is the cause of the formation of an amorphous glassy state when the confinement is such that to inhibit the crystallization of water. Under this conditions, the dehydration of hydrophobic surfaces is characterized by the appearance of heterogeneities and cavitation.
-
•
The hydrophobic confinement affects the thermodynamics of water by lowering the and increasing the of the liquid-gas phase transition and of the TMD line. It also affects the LDL-HDL phase transition in a way that is possibly more complex.
All these results are potentially relevant in problems such as the protein denaturation or the protein aggregation. Works are in progress to underpin and build up a theory of water at interfaces that could help us to acquire a better understanding of these subjects.
Acknowledgments
This work was partially supported by the Spanish Ministerio de Ciencia e Innovación Grants Nos. FIS2005-00791 and FIS2009-10210 (co-financed FEDER), Junta de Andalucía Contract No. FQM 357.
References
References
- [1] Debenedetti P G and Stanley H E 2003 Physics Today 56 40–46
- [2] Angell C A and Tucker J C 1973 Science 181 342–344
- [3] Speedy R J R J and Angell C A 1976 J. Chem. Phys. 65 851–858
- [4] Hare D E and Sorensen C M 1986 The Journal of Chemical Physics 84 5085–5089
- [5] Franzese G and Stanley H E 2007 Journal of Physics-Condensed Matter 19 205126
- [6] Debenedetti P G 1996 Metastable Liquids. Concepts and Principles (Princeton, NJ: Princeton University Press)
- [7] Salzmann C G, Radaelli P G, Mayer E and Finney J L 2009 Physical Review Letters 103 105701
- [8] Bruggeller P and Mayer E 1980 Nature 288 569–571
- [9] Jenniskens P and Blake D 1994 Science 265 753–756
- [10] Mishima O, Calvert L and Whalley E 1985 Nature 314 76–78
- [11] Strazzulla G, Baratta G A, Leto G and Foti G 1992 EPL (Europhysics Letters) 18
- [12] Loerting T and Giovambattista N 2006 J. Phys: Cond. Mat. 18 R919–R977
- [13] Burton E F and Oliver W F 1935 Proc. R. Soc. Lond. A 153 166–172
- [14] Mishima O, Calvert L and Whalley E 1984 Nature 310 393–395
- [15] Loerting T, Salzmann C, Kohl I, Mayer E and Hallbrucker A 2001 Physical Chemistry Chemical Physics 3 5355–5357
- [16] Soper A and Ricci M 2000 Physical Review Letters 84 2881–2884
- [17] Speedy R J 1982 The Journal of Physical Chemistry 86 3002–3005
- [18] Poole P, Sciortino F, Essmann U and Stanley H 1992 Nature 360 324–328
- [19] Tanaka H 1996 Nature 380 328
- [20] Sastry S, Debenedetti P G, Sciortino F and Stanley H E 1996 Physical Review E 53 6144–6154
- [21] Angell C A 2008 Science 319 582–587
- [22] Mallamace F, Branca C, Broccio M, Corsaro C, Mou C Y and Chen S H 2007 Proceedings of the National Academy of Sciences 104 18387–18391
- [23] Granick S and Bae S C 2008 Science 322 1477–1478
- [24] Faraone A, Liu K H, Mou C Y, Zhang Y and Chen S H 2009 Journal Of Chemical Physics 130
- [25] Ricci M A, Bruni F and Giuliani A 2009 Faraday Discussussion 141 347–358
- [26] Soper A K 2008 Molecular Physics 106 2053 – 2076
- [27] Bellissent-Funel M C 2008 Journal of Physics: Condensed Matter 20 244120
- [28] Vogel M 2008 Physical Review Letters 101 225701
- [29] Pawlus S, Khodadadi S and Sokolov A P 2008 Physical Review Letters 100 108103
- [30] Chen S H, Liu L, Fratini E, Baglioni P, Faraone A and Mamontov E 2006 Proceedings of the National Academy of Sciences of the United States of America 103 9012–9016
- [31] Chandler D 2005 Nature 437 640–7
- [32] Dill K A, Truskett T M, Vlachy V and Hribar-Lee B 2005 Annual Review of Biophysics and Biomolecular Structure 34 173–199
- [33] Giovambattista N, Lopez C F, Rossky P J and Debenedetti P G 2008 Proceedings of the National Academy of Sciences of the United States of America 105 2274–2279
- [34] Gallo P and Rovere M 2007 Physical Review E (Statistical, Nonlinear, and Soft Matter Physics) 76 061202–7
- [35] Bellissent-Funel M C, Chen S H and Zanotti J M 1995 Phys. Rev. E 51 4558–4569
- [36] Takahara S, Nakano M, Kittaka S, Kuroda Y, Mori T, Hamano H and Yamaguchi T 1999 The Journal of Physical Chemistry B 103 5814–5819
- [37] Faraone A, Liu L, Mou C Y, Shih P C, Copley J R D and Chen S H 2003 The Journal of Chemical Physics 119 3963–3971
- [38] Chen S H, Mallamace F, Mou C Y, Broccio M, Corsaro C, Faraone A and Liu L 2006 Proceedings of the National Academy of Sciences 103 12974–12978
- [39] Crupi V, Majolino D, Migliardo P and Venuti V 2002 The Journal of Physical Chemistry B 106 10884–10894
- [40] Crupi V, Majolino D, Migliardo P, Venuti V, Wanderlingh U, Mizota T and Telling M 2004 The Journal of Physical Chemistry B 108 4314–4323
- [41] Chu X Q, Kolesnikov A I, Moravsky A P, Garcia-Sakai V and Chen S H 2007 Physical Review E (Statistical, Nonlinear, and Soft Matter Physics) 76 021505–6
- [42] Faraone A, Liu L, Mou C Y, Yen C W and Chen S H 2004 The Journal of Chemical Physics 121 10843–10846
- [43] Mallamace F, Broccio M, Corsaro C, Faraone A, Wanderlingh U, Liu L, Mou C Y and Chen S H 2006 The Journal of Chemical Physics 124 161102
- [44] Liu L, Chen S H, Faraone A, Yen C W and Mou C Y 2005 Phys. Rev. Lett. 95 117802
- [45] Chen S H, Liu L, Chu X, Zhang Y, Fratini E, Baglioni P, Faraone A and Mamontov E 2006 The Journal of Chemical Physics 125 171103
- [46] qiang Chu X, Fratini E, Baglioni P, Faraone A and Chen S H 2008 Physical Review E (Statistical, Nonlinear, and Soft Matter Physics) 77 011908
- [47] Cerveny S, Colmenero J and Alegría A 2006 Physical Review Letters 97 189802
- [48] Jansson H and Swenson J 2003 The European Physical Journal E: Soft Matter and Biological Physics 12 51–54
- [49] Sudo S, Tsubotani S, Shimomura M, Shinyashiki N and Yagihara S 2004 The Journal of Chemical Physics 121 7332–7340
- [50] Cerveny S, Schwartz G A, Alegría A, Bergman R and Swenson J 2006 The Journal of Chemical Physics 124 194501
- [51] Swenson J 2006 Physical Review Letters 97 189801
- [52] Swenson J, Jansson H and Bergman R 2008 Aspects Of Physical Biology: Biological Water, Protein Solutions, Transport And Replication (Lecture Notes In Physics vol 752) ed Franzese, G and Rubi, M pp 23–42
- [53] Khodadadi S, Pawlus S, Roh J H, Sakai V G, Mamontov E and Sokolov A P 2008 Journal Of Chemical Physics 128 195106
- [54] Xu L, Kumar P, Buldyrev S V, Chen S H, Poole P H, Sciortino F and Stanley H E 2005 Proceedings of the National Academy of Sciences of the United States of America 102 16558–16562
- [55] Kumar P, Yan Z, Xu L, Mazza M G, Buldyrev S V, Chen S H, Sastry S and Stanley H E 2006 Physical Review Letters 97 177802
- [56] Lagi M, Chu X, Kim C, Mallamace F, Baglioni P and Chen S H 2008 J Phys Chem B 112 1571–5
- [57] Cerveny S, Schwartz G A, Bergman R and Swenson J 2004 Phys. Rev. Lett. 93 245702
- [58] Kumar P, Starr F W, Buldyrev S V and Stanley H E 2007 Physical Review E (Statistical, Nonlinear, and Soft Matter Physics) 75 011202
- [59] Mazza M G, Stokely K, Pagnotta S E, Bruni F, Stanley H E and Franzese G Two dynamic crossovers in protein hydration water and their thermodynamic interpretation
- [60] Guillot B 2002 Journal of Molecular Liquids 101 219 – 260
- [61] Lamoureux G, Alexander D MacKerell J and Roux B 2003 The Journal of Chemical Physics 119 5185–5197
- [62] Mankoo P K and Keyes T 2008 The Journal of Chemical Physics 129 034504
- [63] Piquemal J P, Chelli R, Procacci P and Gresh N 2007 The Journal of Physical Chemistry A 111 8170–8176
- [64] Franzese G and Stanley H E 2002 Journal of Physics-Condensed Matter 14 2201–2209
- [65] Franzese G and Stanley H E 2002 Physica A-Statistical Mechanics And Its Applications 314 508–513
- [66] Franzese G, Marques M I and Stanley H E 2003 Physical Review E 67 011103
- [67] Teixeira J and Bellissent-Funel M C 1990 Journal of Physics: Condensed Matter 2
- [68] Luzar A and Chandler D 1996 Phys. Rev. Lett. 76 928–931
- [69] Henry M 2002 Chemphyschem 3 561–9
- [70] Baranyai A, Bartók A and Chialvo A A 2005 J Chem Phys 123 054502
- [71] Smith J D, Cappa C D, Wilson K R, Messer B M, Cohen R C and Saykally R J 2004 Science 306 851–3
- [72] Suresh S J and Naik V M 2000 The Journal of Chemical Physics 113 9727–9732
- [73] Debenedetti P G 2003 Journal of Physics: Condensed Matter 15 R1669–R1726
- [74] Narten A, Danford M and Levy H 1967 Discussions of the Faraday Society 97–&
- [75] Soper A K and Phillips M G 1986 Chemical Physics 107 47 – 60
- [76] Stokely K, Mazza M G, Stanley H E and Franzese G 2010 Metastable Systems under Pressure (Springer) chap Metastable Water Under Pressure, pp 197–216 NATO Science for Peace and Security Series A: Chemistry and Biology
- [77] Franzese G, Yamada M and Stanley H E 2000 Aip Conference Proceedings vol 519 pp 281–287
- [78] Franzese G and Stanley H E 2005 Science And Culture Series: Physics vol 26 pp 210–214
- [79] Kumar P, Franzese G and Stanley H E 2008 Journal of Physics: Condensed Matter 20 244114
- [80] Kumar P, Franzese G and Stanley H E 2008 Physical Review Letters 100 105701
- [81] Kumar P, Franzese G, Buldyrev S V and Stanley H E 2008 Aspects of Physical Biology 3–22
- [82] Franzese G, Stokely K, Chu X Q, Kumar P, Mazza M G, Chen S H and Stanley H E 2008 Journal of Physics-Condensed Matter 20 494210
- [83] Stokely K, Mazza M G, Stanley H E and Franzese G 2010 Proc Natl Acad Sci U S A
- [84] Chu X q, Faraone A, Kim C, Fratini E, Baglioni P, Leao J B and Chen S H 2009 The Journal of Physical Chemistry B 113 5001–5006
- [85] Mazza M G, Stokely K, Strekalova E G, Stanley H E and Franzese G 2009 Computer Physics Communications 180 497–502
- [86] Cataudella V, Franzese G, Nicodemi M, Scala A and Coniglio A 1996 Physical Review E 54 175–189
- [87] Franzese G and de los Santos F 2009 J. Phys.: Condens. Matter 21 504107
- [88] Kumar P, Franzese G, Buldyrev S V and Stanley H E 2006 Physical Review E 73 041505
- [89] Koga K, Tanaka H and Zeng X C 2000 Nature 2000 564–567
- [90] Franzese G and Coniglio A 1999 Physical Review E 59 6409–6412
- [91] de los Santos F and Franzese G 2009 Modeling And Simulation Of New Materials: Proceedings Of Modeling And Simulation Of New Materials: Tenth Granada Lectures (AIP Conf. Proc. vol 1091) ed Marro J, Garrido P L and Hurtado P I (Granada (Spain): AIP) pp 185–197
- [92] Truskett T M, Debenedetti P G and Torquato S 2001 The Journal of Chemical Physics 114 2401–2418
- [93] Kumar P, Buldyrev S V, Starr F W, Giovambattista N and Stanley H E 2005 Physical Review E (Statistical, Nonlinear, and Soft Matter Physics) 72 051503
- [94] Strekalova E G, Mazza M G, Stanley H E and Franzese G in preparation
- [95] Ball P 2008 Chemical Reviews 108 74–108
- [96] De Los Rios P and Caldarelli G 2000 Phys. Rev. E 62 8449–8452
- [97] Levy Y and Onuchic J N 2006 Annu. Rev. Biophys. Biomol. Struct. 35 389–415
- [98] Dias C L, Ala-Nissila T, Karttunen M, Vattulainen I and Grant M 2008 Physical Review Letters 100 118101–4