Dimensional phase transitions in small Yukawa clusters
Abstract
We investigate the one- to two-dimensional zigzag transition in clusters consisting of a small number of particles interacting through a Yukawa (Debye) potential and confined in a two-dimensional biharmonic potential well. Dusty (complex) plasma clusters with monodisperse particles are characterized experimentally for two different confining wells. The well anisotropy is accurately measured, and the Debye shielding parameter is determined from the longitudinal breathing frequency. Debye shielding is shown to be important. A model for this system is used to predict equilibrium particle configurations. The experiment and model exhibit excellent agreement. The critical value of for the zigzag transition is found to be less than that predicted for an unshielded Coulomb interaction. The zigzag transition is shown to behave as a continuous phase transition from a one-dimensional to a two-dimensional state, where the state variables are the number of particles, the well anisotropy and the Debye shielding parameter. A universal critical exponent for the zigzag transition is identified for transitions caused by varying the Debye shielding parameter.
pacs:
52.27.Lw, 64.60.an, 37.10.Gh, 52.27.GrI Introduction
Consider a strongly-coupled, two-dimensional (2D) system of particles with identical mass and charge . A confining potential well is required to balance the repulsive interparticle force and create a stable configuration. For almost any 2D potential well expanded around its minimum, the lowest order terms in a particle’s potential energy are
| (1) |
where is a constant. Consequently, we can approximate the confining potential energy as
| (2) |
where and are force constants, and and are single-particle (center-of-mass) oscillation frequencies in the and directions, respectively. In 2D, the biharmonic well [Eq. (2)] gives the general confining potential energy when higher order terms are negligible.
When charged particles are in free space, they interact through an unshielded Coulomb potential sch ; dev ; bed . However, if the particles are in a dielectric, then the Coulomb interaction is shielded by the medium’s dielectric response, and particles interact through a Yukawa potential (i.e., a shielded Coulomb or Debye potential),
| (3) |
where is the separation distance, and is the Debye length. We call a system of particles confined to two dimensions and interacting through a Yukawa potential a “2D Yukawa system”. If is small, then the system is a “Yukawa cluster”. In 2D Yukawa systems the finite Debye length allows the particle-particle interaction length to be varied from long range to short range tes7 , affecting both the system’s static and dynamic properties.
The case of 2D Yukawa systems in isotropic () potential wells has been explored extensively, both theoretically kon ; lai ; tes5 and experimentally juan ; tes2 ; tes3 ; ivan ; mel2 . For isotropic wells, large- systems form a circular disk where the interior of the disk has a triangular lattice bed . For clusters (small- systems), different shell configurations become stable as the interaction is tuned from long range to short range. When the potential well is anisotropic, qualitatively new types of configurations can occur sch ; can ; apo . If the well is weakly anisotropic then clusters are elliptical and have well-defined shell structures can ; tes4 . On the other hand, when the well is highly anisotropic, the particle configuration is a one-dimensional (1D) straight line hom ; mis ; liu ; pia . A 1D cluster becomes a 2D cluster through a zigzag transition. Zigzag configurations may become elliptical and then circular through further structural transitions can .
Dusty (complex) plasma should be an ideal experimental system for studying the zigzag transition in 2D Yukawa clusters. In laboratory dusty plasmas, monodisperse dust particles interacting through a Yukawa potential ukon are confined near the sheath edge above a horizontal electrode to form a 2D system. A rectangular confining structure placed on top of the electrode can produce a biharmonic potential well hom ; mel1 ; tes4 .
Melzer mel1 experimentally observed zigzag transitions in dusty plasmas confined in a radio frequency (rf) discharge as a function of particle number and neutral gas pressure, and attempted to infer the well anisotropy and Debye shielding parameter using a static analysis of the cluster configuration together with a comparison to unshielded Coulomb theory. He concluded that the measured cluster properties, including the critical value of for the zigzag transition, were not inconsistent with the physics of an unshielded Coulomb interaction (i.e., ).
In this paper, we study Yukawa clusters in one- and two-dimensional configurations and the transition between these configurations. Dusty plasma experiments are performed as a function of particle number for two rectangular confining wells, giving two values of the well anisotropy. This work extends previous experiments tes4 on 2D Yukawa clusters in weakly anisotropic wells. We directly measure the well anisotropy and Debye shielding parameter tes4 . We find that Debye shielding is important, i.e., our results are not consistent with physics in the unshielded Coulomb regime. Using the measured cluster parameters, we compute predicted equilibrium configurations from the model of Sec. II. The predicted and measured configurations exhibit excellent agreement. The critical value of for the zigzag transition is found to be the same in both experiment and theory, and to be less than that predicted for an unshielded Coulomb interaction. Even though is small, the zigzag transition is shown to behave as a 1D-2D continuous phase transition and a universal critical exponent is identified.
II Model
Two-dimensional Yukawa clusters can be modeled as a strongly-coupled system of identical particles with charge and mass at positions interacting through a Yukawa potential [Eq. (3)] with Debye length . The particles are confined in a 2D biharmonic well [Eq. (2)] where and are oscillation frequencies for the (longitudinal) and (transverse) directions, respectively. The separation distance between particles and is . The total potential energy of the system is can ; tes4
| (4) |
where the first sum in Eq. (4) is the potential energy of confinement, and the second sum is the potential energy due to particle-particle interactions. Equation (4) can be nondimensionalized to give
| (5) |
where is the characteristic potential energy, and , , and are normalized distances. We define the characteristic length scale
| (6) |
using the longitudinal oscillation frequency . The dimensionless parameters in Eq. (5) are the particle number , the well anisotropy and the Debye shielding parameters , where
| (7) |
respectively. To compare this model to experiment, and must be measured in the experiment.
This model [Eq. (5)] has three parameters: , and . The isotropic well is given by . Without loss of generality, we assume that the anisotropic well has (i.e., ) so that the major axis of the potential well lies in the (longitudinal) direction. An unshielded Coulomb interaction corresponds to . As increases the interparticle force becomes more localized. Given , and , a solution of the model [Eq. (5)] is a set of particle positions that minimizes . Properties of such solutions have previously been investigated by Cândido, et al. can . To minimize we use simulated annealing together with a final step of conjugate gradient minimization tes5 . For a given configuration, normal modes and their associated frequencies can be computed from the dynamical matrix.
A zigzag transition sch is a transition from a 1D straight line configuration to a 2D configuration. For particle coordinates measured with respect to the cluster’s center of mass, the cluster’s length and width can be characterized by the rms values
| (8) |
Consequently, a zigzag transition is a transition from to caused by a change in one of the model parameters. If a cluster is initially in a straight line configuration, then for constant and a zigzag transition will occur as is increased. We denote the critical value of , which is the smallest value of in the zigzag configuration, by . A 1D-2D transition also occurs when is increased above a critical value . If a cluster is initially in a 2D configuration, then increasing causes a transition to a 1D cluster can for which above the critical value . As a consequence, 1D configurations are independent of when .
An unbounded 1D chain can be modeled by letting while remains finite. Longitudinal confinement can be achieved either by using periodic boundary conditions pia or a ring topology tesp . It is then convenient to define the characteristic length scale using the transverse frequency pia ; mel1 ,
| (9) |
This gives a transverse Debye shielding parameter which is related to [Eq. (7)] by
| (10) |
A zigzag transition occurs when the 1D lattice constant where is a critical value pia ; tesp . For an unbounded Yukawa chain, the dimensionless critical lattice constant is a solution of tesp
| (11) |
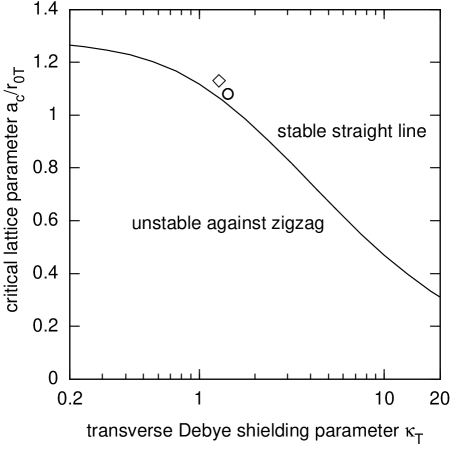
which depends only on the transverse shielding parameter . For a pure Coulomb interaction, , so that . The critical lattice spacing decreases as the Debye shielding parameter increases (see Fig. 5 below).
III Experiment
Dusty plasma experiments were performed in the Dusty Ohio Northern University experimenT (DONUT) tes1 ; tes2 ; tes3 ; tes4 ; tes6 . An argon plasma was created around an 89-mm diameter powered electrode in a radio frequency discharge at 13.56 MHz. A blocking capacitor allows the electrode to develop a negative dc self-bias that levitates the negatively-charged dust particles. As shown in Fig. 1, the biharmonic well is formed at the minimum of a confining geometry consisting of four rectangular aluminum bars placed on the powered electrode. The end bars measure 6.35 mm 12.7 mm 76.2 mm, while the inner bars measure 6.35 mm 12.7 mm 50.8 mm. The distance between the two inner bars can be changed to vary the dimensions of the confining rectangular depression, and thereby change the anisotropy parameter . Clusters were made using monodisperse melamine formaldehyde spheres with a nominal diameter of . As explained previously tes2 , we believe that the dust particle diameter is closer to .
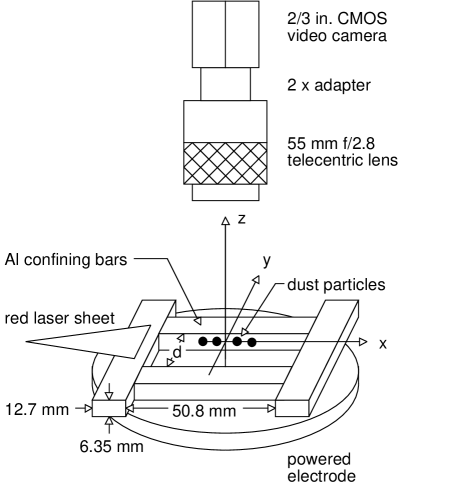
To determine dust particle positions, the particles are illuminated by a red diode laser and viewed using a inch CMOS camera with a telecentric lens mounted above the top face of the electrode. For these experiments, we recorded 4097 frames of video at frames/s for each particle configuration to determine center-of-mass (c.m.) and breathing frequencies. A side-view camera was used to verify that out-of-plane motion was minimal.
Two different confinement geometries were studied for similar plasma conditions. In the first, the inner bars were separated by , while in the second they were separated by . For the 25.4 mm 50.8 mm well, the neutral Ar pressure was 12.4 mtorr (1.65 Pa), the rf power was forward, the dc self bias on the electrode was 89.0 V, and particle positions were recorded with a resolution of 16.51 . For the 14.0 mm 50.8 mm well, the neutral Ar pressure was 12.1 mtorr (1.61 Pa), the rf power was forward, the dc self bias was , and positions were recorded with a resolution of 16.77 .
Normal mode frequencies were determined by projecting the particle’s thermal motion onto the center-of-mass and longitudinal breathing modes tes1 ; tes3 . A Fourier transform of the time history of the mode amplitude gives the power spectral density for that mode, which is that of a driven damped harmonic oscillator. For the neutral pressures used, the oscillations are underdamped and the power spectra display a clear resonance peak. Measuring the center-of-mass frequencies and directly determines the anisotropy parameter , while comparing the longitudinal breathing frequency for 1D configurations to model solutions determines the Debye shielding parameter .
IV Experimental Results
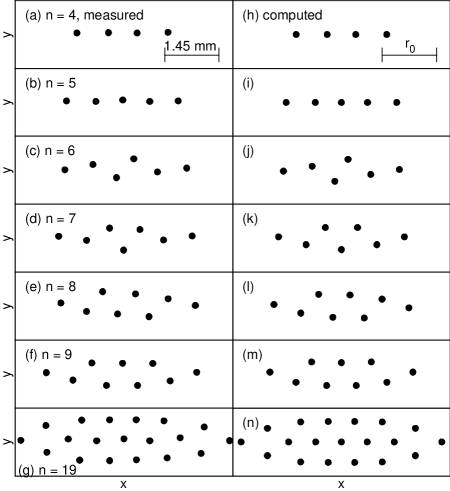
For the 25.4 mm 50.8 mm confining well, nine sets of particles were analyzed with to 19. Representative configurations are shown in Figs. 2(a)-(g). For the particles are in a 1D linear configuration. When one more particle is added () the cluster changes to a 2D zigzag configuration, so . As increases the number of zigzags also increases until zigzags stretch from one end of the cluster to the other (, 9). For the system displays a full (5,14) elliptical shell structure can ; tes4 .
For the narrower confining well, , we analyzed twelve sets of particles for nine different values of (). Measured configurations are shown in Figs. 3(a)-(g). In comparison to , we expect the anisotropy parameter to be larger so that the critical value of is increased. For these conditions, clusters with are in a 1D configuration. A zigzag configuration is seen for , so . As further increases the zigzag region expands away from the center of the cluster. However, even for the cluster still has short linear tails at each end can and is not an elliptical configuration.

The anisotropy parameter for each confining well was determined from measurements of the center-of-mass frequencies excited by thermal noise tes3 for the and directions, as shown in Fig. 4. For the 25.4 mm 50.8 mm well [Fig. 4(a)], mode temperatures were found to be , indicating that the clusters are stable and in equilibrium with the neutral gas component. The c.m. frequencies do not depend on the number of particles, so the clusters do not perturb the potential well. By averaging over the measured c.m. frequencies, we find and . Equation (6) then gives , so that the anisotropy parameter has been precisely determined.
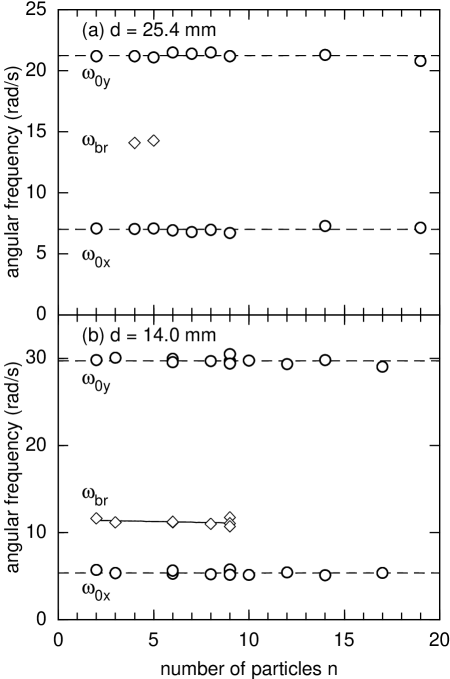
For the 14.0 mm 50.8 mm well [Fig. 4(b)], data were taken at for two different sets of particles and with three different sets to estimate the spread in the measured frequencies, as can be seen in Fig. 4(b). In comparison to , we observed a larger range of mode temperatures, , indicating that the clusters are somewhat less stable. The c.m. frequencies are again found to be independent of , and the average c.m. frequencies are and , giving . In comparison to the case, has increased as expected, while has decreased slightly, even though the long side of the rectangular well (50.8 mm) has not changed. This indicates that decreasing is pushing the sheath out of the concave depression formed by the bars.
The Debye shielding parameter was estimated by comparing measured longitudinal breathing frequencies for several of the linear configurations to normal mode frequencies calculated using the model. Since the breathing oscillation varies the interparticle spacing, it probes the dependence of the interparticle potential on particle separation, and therefore . For an unshielded Coulomb interaction , the squared normalized breathing frequency irrespective of , and the unshielded Coulomb regime is . For the 25.4 mm 50.8 mm well with , the experimental value , so that , giving , while for , the experimental value , so that , giving . The measured values of are clearly not consistent with , and we conclude that Debye shielding cannot be neglected when modeling these clusters. The uncertainty in is fairly large, so we take . Using this value of , we compare the measured cluster width to the dimensionless cluster width to find , and . These values of and are consistent with measurements made in isotropic wells for similar discharge conditions tes1 ; tes2 ; tes3 ; tes4 ; tes5 . In this case, the particle separation, which is at the center of the cluster, is greater than the Debye length, emphasizing the importance of Debye shielding.
For the Debye shielding parameter was estimated from the normalized breathing frequencies for clusters with 8 and 9 particles. For we find and 4.38, for , and for , , 4.24 and 4.78. From this data we estimate , giving , and . As we show in the next section, is very close to the critical value for the zigzag transition, which may somewhat explain the spread in the breathing frequencies for . The physical parameters and are consistent with the values found for the well even though is somewhat larger due to the decrease in [Eq. (7)].
Equilibrium configurations computed from the model [Eq. (5)] for and are shown in Figs. 2(h)-(n) for comparison to the experimental configurations. For each value of , the experimental and predicted positions are very similar, and the particle arrangements are identical. In particular, the zigzag transition occurs at in both cases, so that experimentally the critical value . For and , , which does not agree with the experimental results. A comparison between the measured configurations and configurations computed for and is shown in Fig. 3. Again, the measured and computed configurations show excellent agreement and the particle arrangements are identical. Further, the critical value of for the zigzag transition is the same for the experimental and the model results. For and , the critical value . In the experiment we find , so that our results are not consistent with . The very good agreement between experiment and model, and the consistency of the results for two different confining wells, indicates that the experimental results are robust.
In Fig. 5 we compare the values of the experimentally measured lattice constant for the last straight configurations, , to the unbounded theory of Eq. (11) for the critical lattice constant. For both potential wells, the last straight configuration has odd, so we approximate by the average of the distances between the central particle and its two nearest neighbors. For with , we find , and for with , we find . Using the measured values of , and we then calculate for : and , and for : and . The experimental points lie close to the instability line, but slightly above it, in the stable region. Since for both cases , decreasing (e.g., increasing ) while holding constant moves the cluster into the unstable region, causing a zigzag transition. Here finite size effects do not appear to be very important, which may be because for the zigzag instability is dominated by nearest neighbor interactions tesp .
In Fig. 6 we compare the measured cluster width with model solutions as a function of for the measured values of and . The only adjustable parameter is the length scale for the cluster , which was chosen to give good agreement between the model and experiment. In both cases we see an abrupt increase in the cluster width which is associated with the zigzag transition. Above the transition, the data exhibit a power law behavior which is consistent with a continuous phase transition. Agreement between the model and the experiment is quite good. For there is a second structural transition at which corresponds to the change from a zigzag configuration to an elliptical shell configuration [Fig. 2(g)] can ; tes4 . This transition may be roughly analogous to the transition from two to three parallel chains in the unbounded system pia . Such a transition is not seen for since is not large enough, as confirmed by the fact that the configuration is an extended zigzag [Fig. 3(g)].

V Dimensional Phase Transitions
A phase transition is a sudden change in some property of a system, called an order parameter, due to a small change in a control parameter. Within this conceptual framework, the zigzag transition in these clusters can be viewed as a dimensional phase transition between one-dimensional and two-dimensional states sch . We characterize the cluster size in the longitudinal () and transverse () directions by the rms values of the particle positions in the respective directions [Eq. (8)]. In particular, is a good choice for an (unnormalized) order parameter since in the 1D configuration and in the 2D (zigzag) configuration. The state variables that determine the system configuration are then , and , where is discrete and and are continuous.
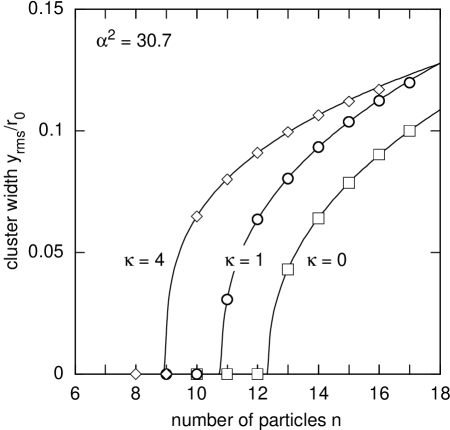
Figure 7 demonstrates that decreases as increases using . That is, expressions which predict the critical value of for a given with can are incorrect when the strength of Debye shielding is such that the interaction is not essentially unshielded. Interestingly, even though is small and discrete, the cluster width above the transition is well characterized by a power law pia
| (12) |
where is a continuous critical , and . That is continuous indicates there may be a continuum theory for the zigzag transition where is also continuous. For and 1 and 4, we fit the first five points after the transition to find , 10.82 and 8.99, and a critical exponent , 0.387 and 0.310, respectively. Here decreases with increasing . As discussed above, is very close to the critical value when , and we find very close to an integer value. In fact, for , so we expect , which is not satisfied here due to a small uncertainty in the fitting coefficients.
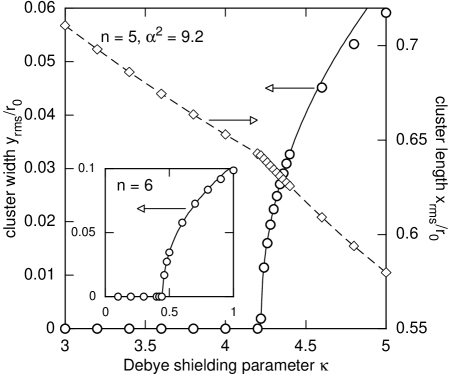
The computed dependence of cluster length and width for and 6 and on the Debye shielding parameter is shown in Fig. 8. For the finite model, in contrast to the unbounded case pia , increasing decreases the nearest neighbor distance, and therefore the linear particle density. For the critical value of for the zigzag transition is . That is, the cluster is in a 1D configuration for . For , is positive and increases rapidly with . The cluster length has a discontinuous first derivative at the phase transition. The inset of Fig. 8 shows the transition for , where the critical value is . Consequently, for and the cluster is linear. Since we find experimentally that the cluster is in the zigzag configuration, we conclude that the experimental Debye shielding parameter must lie in the interval . For , the cluster width has a power law behavior
| (13) |
where is a critical exponent that is independent of the normalization of . For the and 6 cases illustrated in Fig. 8, we find and 0.450, respectively. This analysis was repeated for with and 10. For , and , while for , and . Experimentally, we find , which means that for the experiment must lie in the interval . The critical exponent for the zigzag transition vs is nearly the same for the four cases considered here, so it may be that in Yukawa clusters there is a universal critical exponent for the zigzag transition caused by changing the Debye shielding parameter .
For fixed values of and , a 2D-1D transition (an “inverse zigzag”) takes place as the anisotropy parameter increases, as shown in Fig. 9 for and . As increases, the dimensionless cluster length increases while the width decreases. Near the transition, the width exhibits a power-law approach to . Assuming
| (14) |
we find the critical value and the critical exponent . That is, if and then particles will be in a zigzag configuration. These results are consistent with the experiment where we observed a 1D configuration for . When the model results are independent of , which can be seen by the constancy of , since and the configuration only depends on and .

VI Conclusions
We have studied one- and two-dimensional Yukawa clusters with a small number of particles confined in biharmonic potential wells both experimentally and theoretically. Experiments were performed in the Dusty Ohio Northern University experimenT (DONUT). For less than a critical value , the clusters are in a one-dimensional straight line state. When the cluster undergoes a zigzag transformation to a two-dimensional state. In our experiments, the anisotropy of the confining potential well was accurately determined by measuring the frequencies of center-of-mass oscillations excited by thermal noise in both the (longitudinal) and (transverse) directions and the Debye shielding parameter was estimated from the measured longitudinal breathing frequency of 1D clusters. Experimental and model data show excellent quantitative agreement, confirming that dusty plasma is a very good real-world system for studying 1D and 2D Yukawa systems and the transitions between these states. In particular, strongly-coupled linear configurations with are true 1D systems for which normal modes are either purely longitudinal or purely transverse.
Our results clearly show that Debye shielding is important for our experimental conditions, and our results are not consistent with physics in the unshielded Coulomb regime. For a given value of the potential well anisotropy, the critical particle number decreases as the shielding parameter increases (i.e., as the Debye length decreases). For the measured well anisotropies, the experimental values of are below those predicted for an unshielded Coulomb interaction (), indicating . This is reinforced by noting that the measured Debye lengths are less than the particle separation and that the normalized squared longitudinal breathing frequencies .
Our finding that contradicts the conclusion in Ref. mel1 for a similar experiment where the results where said to be consistent with an unshielded Coulomb interaction. The method used in Ref. mel1 to determine cluster parameters is a static analysis that treats both the anisotropy parameter and shielding parameter as free parameters and compares the observed with that predicted for . When the decrease in with described in the present work is considered, it seems likely that static analysis method mel1 is only weakly constrained and cannot be used to accurately determine cluster parameters.
Finally, we have demonstrated that the zigzag transition in a Yukawa cluster can be viewed as a phase transition from a one-dimensional state to a two-dimensional state. Though this was previously demonstrated for unbounded systems pia , here the number of particles is finite and really quite small. This is true for transitions initiated by changing the Debye shielding parameter, the potential well anisotropy and the number of particles. In all three cases, we find that the transverse cluster width has a power law dependence near the transition, indicated that transition behaves as a continuous phase transition with a critical exponent. For 1D-2D transitions caused by increasing the Debye shielding parameter, we tentatively identify a universal critical exponent [Eq. (13)] with a value .
Acknowledgements.
T.E.S. would like to thank Ohio Northern University for sabbatical release time.References
- (1) J. P. Schiffer, Phys. Rev. Lett. 70, 818 (1993).
- (2) V. M. Bedanov and F. M. Peeters, Phys. Rev. B 49, 2667 (1994).
- (3) R. G. DeVoe, Phys. Rev. A 58, 910 (1998).
- (4) T. E. Sheridan, Phys. Plasmas 14, 032108 (2007).
- (5) M. Kong, B. Partoens and F. M. Peeters, New J. Phys. 5, 23 (2003).
- (6) Ying-Ju Lai and Lin I, Phys. Rev. E 60, 4743 (1999).
- (7) T. E. Sheridan, J. Phys. D: Appl. Phys. 39, 693 (2006).
- (8) W.-T. Juan et al., Phys. Rev. E 58, 6947 (1998).
- (9) T. E. Sheridan, Phys. Rev. E 72, 026405 (2005).
- (10) T. E. Sheridan and W. L. Theisen, Phys. Plasmas 13, 062110 (2006).
- (11) Y. Ivanov and A. Melzer, Phys. Plasmas 12, 072110 (2005).
- (12) A. Melzer, Phys. Rev. E 67, 016411 (2003).
- (13) L. Cândido, J.-P. Rino, N. Studart and F. M. Peeters, J. Phys.: Condens. Matter 10, 11627 (1998).
- (14) S. W. S. Apolinario, B. Partoens and F. M. Peeters, Phys. Rev. E 74, 031107 (2006).
- (15) T. E. Sheridan, K. D. Wells, M. J. Garee and A. C. Herrick, J. Appl. Phys. 101, 113309 (2007).
- (16) A. Homann, A. Melzer, S. Peters and A. Piel, Phys. Rev. E 56, 7138 (1997).
- (17) T. Misawa, N. Ohno, K. Asano, M. Sawai, S. Takamura and P. K. Kaw, Phys. Rev. Lett. 86 1219 (2001).
- (18) B. Liu, K. Avinash and J. Goree, Phys. Rev. E 69, 036410 (2004).
- (19) G. Piacente, I. V. Schweigert, J. J. Betouras and F. M. Peeters, Phys. Rev. B 69, 045324 (2004).
- (20) U. Konopka, G. E. Morfill and L. Ratke, Phys. Rev. Lett. 84, 891 (2000).
- (21) A. Melzer, Phys. Rev. E 73, 056404 (2006).
- (22) T. E. Sheridan, Phys. Scr. 80, 065502 (2009).
- (23) T. E. Sheridan, M. R. Katschke and K. D. Wells, Rev. Sci. Instrum. 78, 023502 (2007).
- (24) T. E. Sheridan, J. Appl. Phys. 106, 033303 (2009).