The Type Ia Supernova Rate in Radio and Infrared Galaxies from the CFHT Supernova Legacy Survey
Abstract
We have combined the large SN Ia database of the Canada-France-Hawaii Telescope Supernova Legacy Survey and catalogs of galaxies with photometric redshifts, VLA 1.4 GHz radio sources, and Spitzer infrared sources. We present eight SNe Ia in early-type host galaxies which have counterparts in the radio and infrared source catalogs. We find the SN Ia rate in subsets of radio and infrared early-type galaxies is 1–5 times the rate in all early-type galaxies, and that any enhancement is always . Rates in these subsets are consistent with predictions of the two component “A+B” SN Ia rate model. Since infrared properties of radio SN Ia hosts indicate dust obscured star formation, we incorporate infrared star formation rates into the “A+B” model. We also show the properties of SNe Ia in radio and infrared galaxies suggest the hosts contain dust and support a continuum of delay time distributions for SNe Ia, although other delay time distributions cannot be ruled out based on our data.
Subject headings:
supernovae: general — galaxies: radio, starburst1. INTRODUCTION
Type Ia supernovae (SNe Ia) are currently the best cosmological tool to investigate the dark energy driving the accelerated expansion of the universe (Riess et al., 1998; Perlmutter et al., 1999; Astier et al., 2006; Wood-Vasey et al., 2007; Riess et al., 2007). Though generally accepted as thermonuclear explosions of carbon-oxygen white dwarfs which have accreted sufficient mass from their companion, two competitive models exist for the companion scenario: the single-degenerate (main sequence or red giant companion) and double-degenerate (another white dwarf). Since the time delay between star formation and SNe Ia explosion is scenario-dependent, rates in hosts of varying star formation rate (SFR) help constrain this. In fact, SN Ia rates are known to be correlated with host morphology, B-K color, and by inference also with star formation (Mannucci et al., 2005). As such, a galaxy’s SN Ia rate is commonly expressed as the sum of a “delayed” component from old stellar populations and a “prompt” component from young stellar populations. These components are parametrized as “A” and “B”, proportional to a galaxy’s mass and SFR respectively (Scannapieco and Bildsten, 2005; Sullivan et al. 2006a, ). This “A+B” two-component model can be matched with progenitor populations that have distributions of delay times as described by Mannucci et al. (2006), and Pritchet et al. (2008).
The C99 catalog matched with Very Large Array (VLA) 1.4GHz radio data revealed the specific SN Ia rate may be enhanced by 2–7 times in radio-loud () over radio-quiet () early-type galaxies (Della Valle et al. 2005, hereafter DV05). Although winds from active galactic nuclei (AGN) could increase accretion rates of the interstellar medium (ISM) onto white dwarfs, a process thought to trigger classical nova eruptions (Livio et al., 2002; Madrid et al., 2007), DV05 reject this explanation for the enhanced specific SN Ia rate in radio-loud galaxies. They find galaxy interactions are most likely to cause the radio emission and supply the necessary SN Ia progenitors via stellar capture during dwarf accretion or star formation induced by major mergers (Della Valle et al., 2005).
The existence of bright infrared counterparts for radio galaxies has been well documented and often attributed to dust obscured star formation coeval with the AGN (Magliocchetti et al., 2008; Mainieri et al., 2008). By matching a hypothetical galaxy interaction and AGN activity timeline with a recurring star formation model of ten year long episodes each separated by years, Mannucci et al. (2006) find the enhanced specific SN Ia rate in radio-loud early-type galaxies is best fit by a bimodal delay-time distribution (DTD) in which the “prompt” (B) delay time is constrained to just years. They suggest this implies two physical populations of SN Ia progenitors, but note a broad single-population DTD could not be ruled out. As this controversial implication relies on a rate enhancement found with 21 photometrically identified SNe Ia from DV05, we look to confirm this in the large database of spectroscopically typed SNe Ia from the Canada-France Hawaii Telescope (CFHT) Supernova Legacy Survey (SNLS).
We use photometric redshift galaxy catalogs (Ilbert et al., 2006) and 1.4 GHz radio catalogs to calculate the SN Ia rate in radio-loud early-type galaxies, and also infrared source catalogs to look for obscured star formation in the radio-loud SN Ia host galaxies. Dust extinction in starbursts hinders SN detection: only one SN Ia has been detected, and the SN Ia rate remains unconstrained in starburst galaxies (Mannucci et al., 2003, 2007). We use the infrared catalogs to calculate the SN Ia rate in bright and luminous infrared galaxies, which are known to experience bursts of star formation up to . We also statistically compare the SN Ia rates in radio and infrared galaxies to predictions of the two-component “A+B” model, and perform an identical analysis with the low redshift C99 catalog.
In § 2 we describe the SNLS and C99 SN Ia databases and galaxy catalogs, the overlapping radio and infrared source catalogs, and present the radio and infrared properties of SNLS and C99 SN Ia early-type host galaxies. We derive the SN Ia rate in radio and infrared galaxies in § 3, compare to expectations of the two-component “A+B” model in § 4, and reanalyze with relaxed data constraints in § 5. In § 6 we juxtapose the properties of the SNe Ia in radio and infrared host galaxies with known correlations between SN Ia properties and stellar populations. Finally, in § 7 we discuss the implications of our results regarding current SN Ia science and future surveys, and conclude in § 8.
2. OBSERVATIONS
Here we describe the combination and processing of private and public catalogs of supernovae, galaxies, and radio and infrared sources.
2.1. CFHT Supernova Legacy Survey Catalog
From 2003 to 2008, CFHTLS Deep component imaged four 1 deg2 fields (D1–D4) every three to four nights (during dark/grey time, when visible) in four MegaCam filters () to a depth ; this was accompanied by a strong spectroscopic campaign to follow up on as many potential SN Ia candidates as possible (Perrett et al., 2009). After final reductions of all data, the SNLS111http://cfht.hawaii.edu/SNLS will have discovered and identified hundreds of SNe Ia, provide the best direct constraints on the dark energy equation of state parameter (Astier et al., 2006) and be a useful compliment to other cosmological techniques (Komatsu et al., 2009). We use the 91 and 64 SNe Ia identified prior to 2006 Dec 31 in CFHTLS deep fields 1 and 2 respectively ( of the final four-field total), because suitable VLA radio surveys cover D1 and D2 only, and up to this date the SNLS spectroscopic analysis and typing is complete.
2.2. Ilbert et al. (2006) Galaxy Catalog
The Ilbert et al. (2006) galaxy catalog222http://terapix.iap.fr incorporates VIMOS VLT Deep Survey spectroscopic redshifts to calibrate their spectral energy distribution (SED) fitting routine, resulting in accurate () photometric redshifts for galaxies in the four SNLS Deep fields. In optimizing the photo-z calculation, the accuracies of the SEDs are compromised (Ilbert, private communication) and the distribution of SED types is discontinuous. To solve this we fit 51 SEDs, interpolated from Coleman et al. (1980) and Kinney et al. (1996) templates made by Stephen Gwyn at the Canadian Astronomical Data Centre333http://www.cadc.hia.nrc.gc.ca/community/CFHTLS–SG/docs/cfhtls.html, to the catalog galaxies, and estimate galaxy stellar masses and star formation rates using fits of this library of SEDs to the models of Buzzoni (2005). We correct these for systematic offsets (of about a factor of 2) to agree with the PEGASE models (Sullivan et al. 2006b, ). Our SED types include E/S0 (ellipticals or early-types), Sbc and Scd (spiral galaxies), Irr (irregular galaxies), and SB (starbursts, ). To ensure catalog purity we restrict the catalog as recommended by Ilbert et al. (2006), and limit to .
2.3. Additional Galaxy and SN Catalog Processing
We identify SN Ia hosts as the nearest Ilbert catalog galaxy unless there are two within 2 arcseconds, in which case redshift is used to discriminate. In D1 and D2, 22 and 15 SNe Ia have no catalog galaxy within 5 arcseconds (maximum host offset) and cannot be used; this mainly includes SNe Ia in hosts which do not meet our catalog restrictions (17 and 12), but also a few SN Ia whose hosts are not in the original galaxy catalgs (5 and 3; many are near field edges, or close to foreground stars). For SNe Ia with Ilbert catalog hosts, iterative outlier rejection is applied to the residual dispersion between host photometric and SN Ia spectroscopic redshifts for each deep field, resulting in photometric redshift uncertainties of and , rejecting 2 and 6 SNe Ia hosts as outliers in D1 and D2. We use SN Ia with spectroscopic redshifts , the limit to which the SNLS SN Ia sample is nearly complete (Neill et al., 2006). These restrictions yield 33 and 29 usable SNe Ia in D1 and D2 respectively; possible effects of the redshift restriction are considered in § 5.
For every galaxy we calculate its SN Ia observed rate per year, , from the two-component “A+B” model applying the time dilation correction to our observed frame of reference, as shown in Equation 1:
| (1) |
where is stellar mass (), is star formation rate ( / yr), and the A and B values are from Sullivan et al. (2006): and . The rate is the number of SNe Ia expected in a galaxy per year of observing. We use it to determine an effective control time, , to account for SNLS survey efficiencies such as detection and spectroscopic completeness, and the lengths of SNLS observing seasons (approximately 6 months), for fields D1 and D2 separately (i.e. to have and ) as follows:
| (2) |
where is the total number of SNLS SNe Ia observed in the field prior to 2006 Dec 31 with , and is the total number of SNe Ia expected in all galaxies per year of observing the field. We find and where has units of years.
2.4. VLA Radio Catalogs
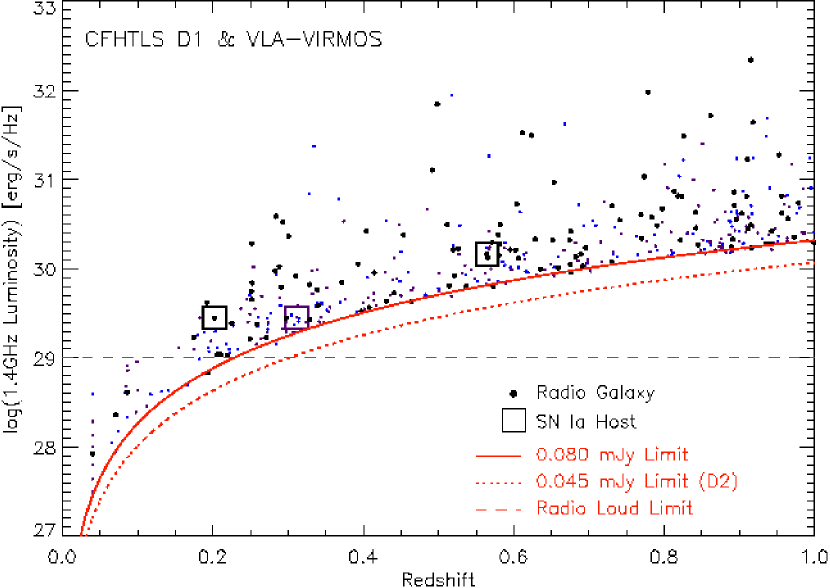
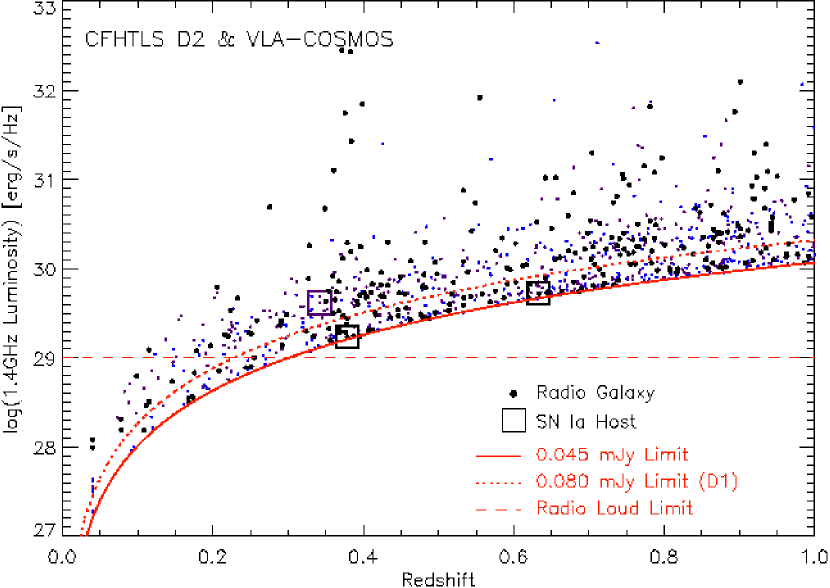
The VLA-VIRMOS 1.4 GHz Deep survey covers D1 to a flux of , with a mean rms noise , and 75% completeness at fluxes 80–180 (Bondi et al., 2003). Of the 1054 radio sources, 503 optical counterparts are identified as the closest galaxy within 2 arcseconds (maximum VLA positional error). Away from the galaxy catalog’s masked regions around foreground stars our recovery rate is , similar to Ciliegi et al. (2005). The VLA-COSMOS 1.4 GHz Large Project covers D2 to with a mean rms noise of (Schinnerer et al., 2006), for which we match of radio sources with a galaxy.
Radio luminosities are derived from photometric redshifts of galaxy counterparts, include a bandpass correction (Hogg et al., 2002), and are plotted in Figure 1. A galaxy is radio-loud if , the faint-end limit of the radio luminosity function, although exact limits for radio-loud, -faint, and -quiet galaxies are not universal (Zamfir et al., 2008). Ledlow & Owen (1996) find () of elliptical galaxies with absolute R magnitude are radio-loud, and amongst C99 elliptical galaxies DV05 find () are radio-loud. In our sample of SED type E/S0 galaxies with we find 4–8% of galaxies with are radio-loud, suggesting we can identify half of the radio-loud population amongst optically bright galaxies due to our higher minimum radio flux limit.
The apparent bimodality of VLA-COSMOS (D2) radio luminosities in Figure 1 is a result of combining the integrated fluxes of resolved and unresolved sources. The flux of the bimodality valley corresponds to the lower limit of integrated fluxes for resolved sources, , as shown in the right-hand plot of Figure 17 from Schinnerer et al. (2006). Coincidentally, it also corresponds to the VLA-VIRMOS (D1) lower limit. This may indicate VLA-VIRMOS and VLA-COSMOS sample slightly different radio source populations, with more faint, unresolved sources in D2. We consider any influence of this on our results in § 5.
2.5. Spitzer Infrared Catalogs
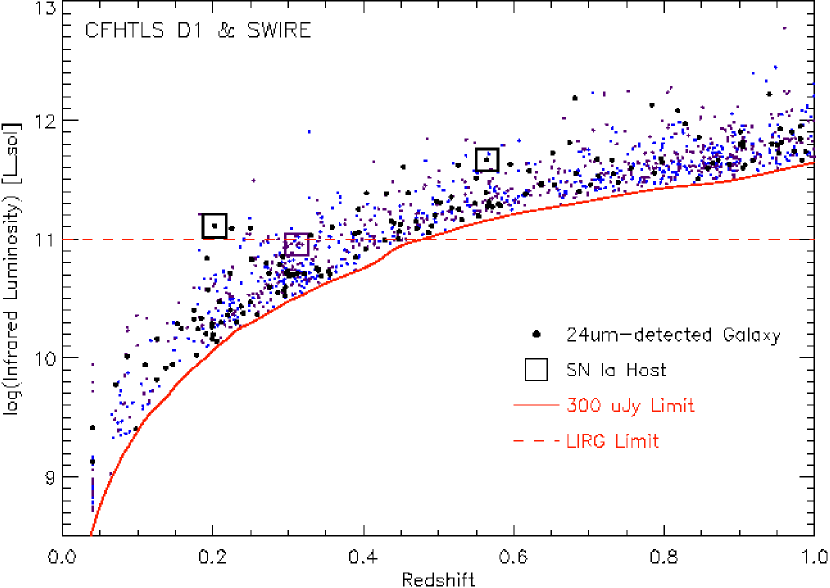
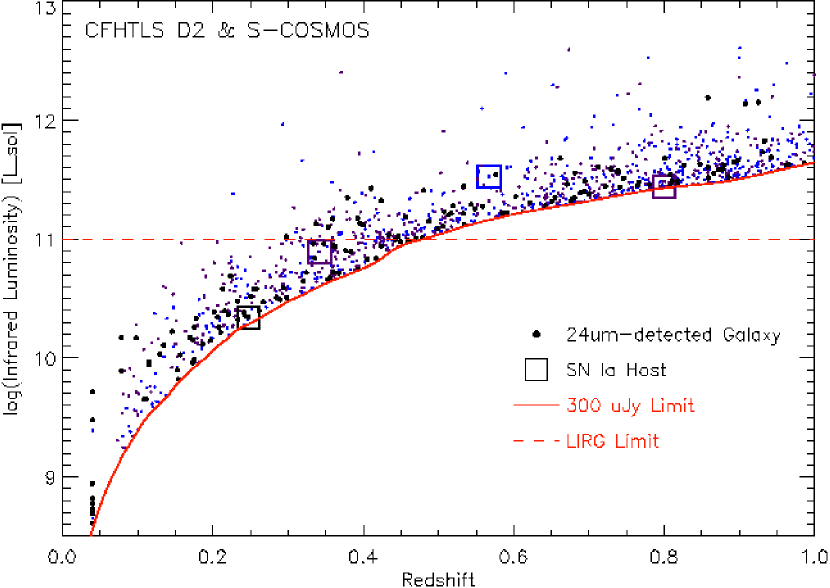
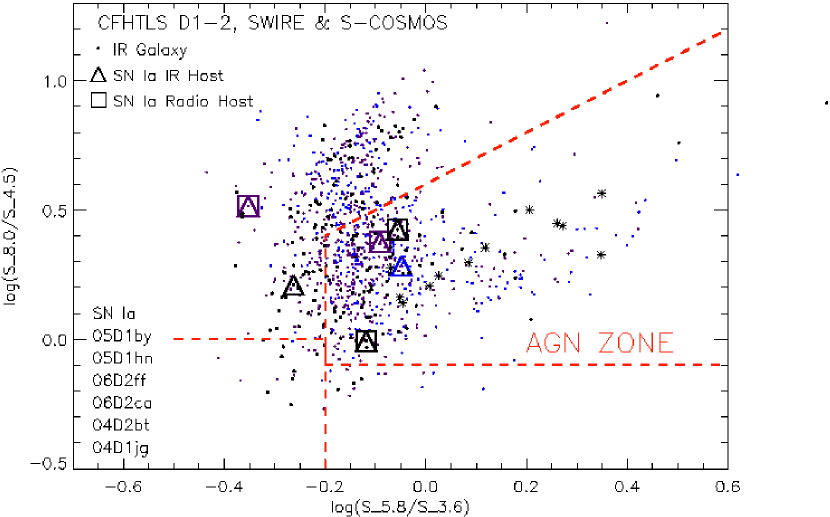
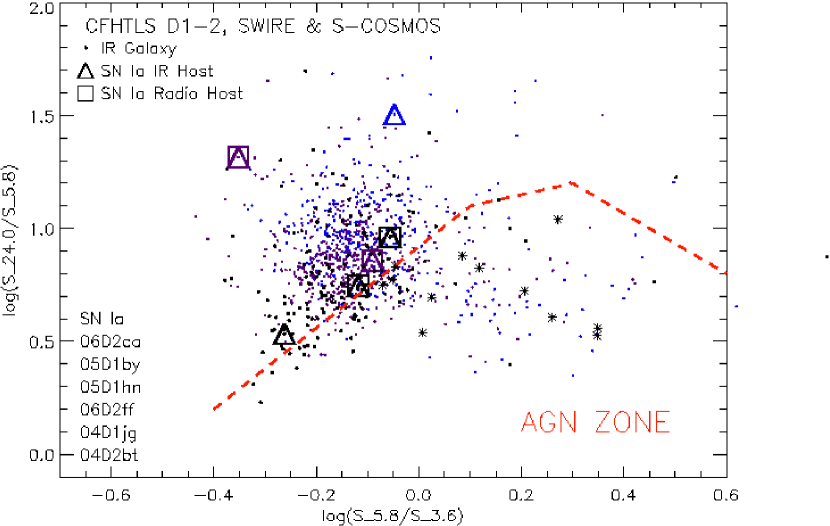
The Spitzer Wide-area Infrared Extragalactic (SWIRE) survey covers D1 to a flux of (where subscript on S denotes wavelength), and to (Lonsdale et al., 2003). SWIRE objects with and stellarity are most likely stars or QSOs and rejected from the catalog444http://irsa.ipac.caltech.edu/data/SPITZER/SWIRE/docs/delivery_doc_r2_v2.pdf, page 43. The Spitzer Cosmic Evolution Survey (S-COSMOS) covers D2 to and after required aperture corrections (Sanders et al., 2007). Objects flagged as likely compromised by nearby bright sources are rejected555http://irsa.ipac.caltech.edu/data/COSMOS/gator_docs/scosmos_irac_colDescriptions.html. Both catalogs are available via the NASA Infrared Space Archive666http://irsa.ipac.caltech.edu. We reject foreground objects and QSOs, identify optical counterparts as in § 2.4, and limit to as in § 2.4. The fraction of galaxies infrared counterparts in all four IRAC bands and MIPS is ; these are plotted on infrared color-color diagrams in Figure 3 which also show AGN boundaries derived from Spitzer First Look Survey data of comparable flux-density limits ( and ) and redshifts () (Lacy et al., 2004). Sajina et al. (2005) show the region on the IRAC color-color plot (left) is actually appropriate for AGN of redshifts . It should be noted that not all galaxies in these regions are AGN-dominated at IR wavelengths.
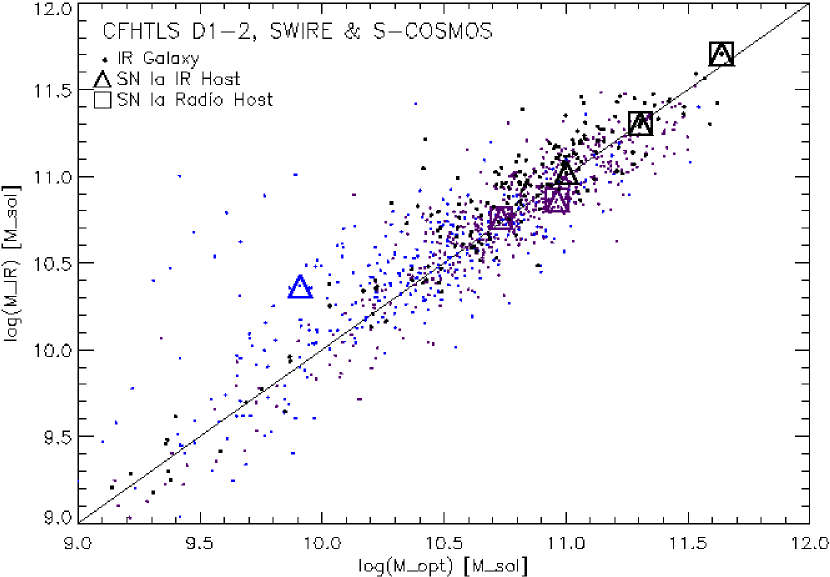
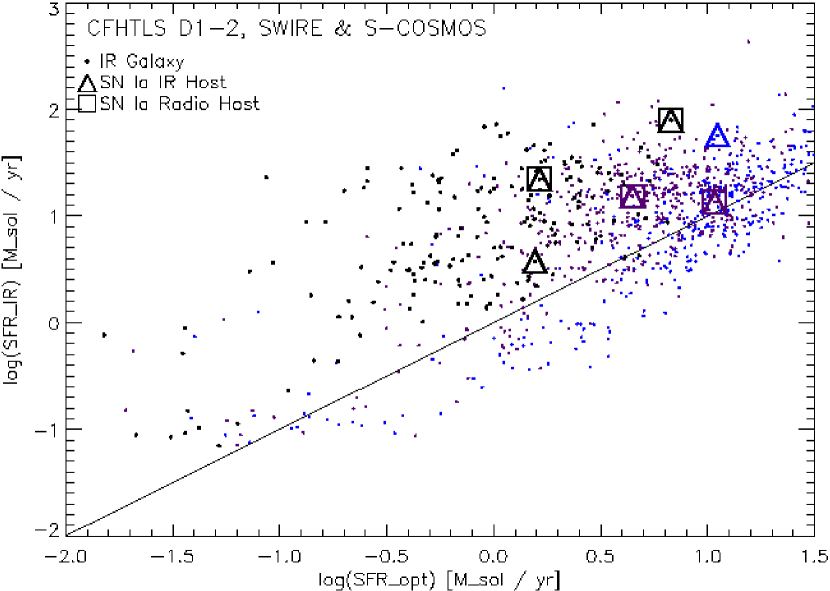
We convert to K-band stellar mass via Balogh et al. (2007), and to bolometric infrared luminosity and infrared star formation rate with publicly available templates and codes777http://david.elbaz3.free.fr/astro_codes/chary_elbaz.html (Chary & Elbaz, 2001). Plots of versus redshift in Figure 2 show our sample of Luminous Infrared Galaxies (LIRG, ) is complete to . The conversion of to is appropriate for starburst-dominated infrared emission, but IR color-color diagrams in Figure 3 show some IR sources may be AGN-dominated; uncertainties introduced by applying this conversion to potentially AGN-dominated sources are discussed in § 4.2. Figure 4 shows the optical and infrared masses agree very well, but is 3–10 times lower than . Having sampled the brightest infrared galaxies which are most likely to have obscured star formation, this factor is and should be higher than the usual (Takeuchi et al., 2005).
2.6. Properties of SNLS SN Ia Host Galaxies
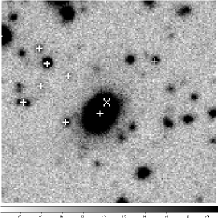
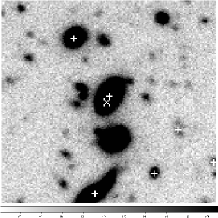
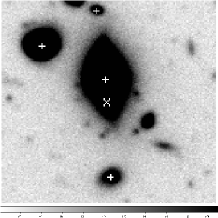
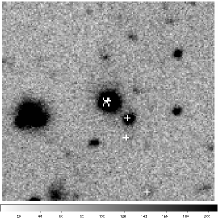
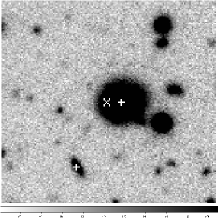
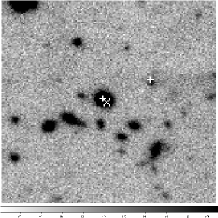
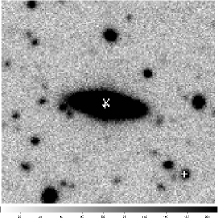
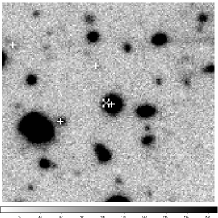
We find eight SNLS SN Ia host galaxies with radio and/or infrared counterparts and , the properties of which are given in Table 1 and plotted in Figures 1 to 4. Image stamps centred on SN Ia coordinates are shown in Figure 5. Beyond the redshift limit of , there are no radio SN Ia hosts, but one with an infrared counterpart: the Sbc type host of SN Ia 04D2ca at is classified as a LIRG. In § 5 we discuss the effects of extending our redshift range to . Of these eight SN Ia hosts, five have SED type E/S0 and will be included in the analysis: four are radio-loud (), three are bright infrared galaxies (BIRG, ), and two are luminous infrared galaxies (LIRG, ).
Galaxies which are bright at mid-infrared wavelengths (MIR, for example ) are described as being starburst or AGN dominated, meaning they contain dust which absorbs high-energy photons from either young stars or AGN, and re-emits them in the MIR. It may seem the two radio-loud SN Ia host galaxies with SED type E/S0 (normally quiescent) and infrared counterparts must be AGN dominated, but there are several reasons why this is not the case. First, the radio-loud E/S0 hosts do not lie along the “AGN plume” of the IRAC color-color plot (although 04D1jg and 05D1hn hosts are in its “AGN zone”), and are outside the “AGN zone” of the IRAC+MIPS color-color plot as shown in Figure 3. Second, AGN-dominated infrared emission originates from a hot dusty torus tens of parsecs across (Tristram et al., 2009) and would be unresolved, but the infrared sources associated with these two galaxies have are flagged as extended. Third, a visual inspection of radio and infrared SN Ia hosts in and GALEX (D2 only) images888http://www.cadc.hia.nrc.gc.ca/community/CFHTLS-SG/docs/cfhtls.html show all but the late-type host of 06D2ff are quite faint to invisible in the ultraviolet, which can be indicative of dust obscured star formation. Fourth, not all starbursts appear morphologically irregular (e.g. Figure 4.68 of Binney & Merrifield (1998), in which a profoundly disturbed galaxy appears as an elliptical in a shallow exposure). We therefore accept the conversion of into for these radio-loud E/S0 SN Ia host galaxies, as discussed in § 2.5.
2.7. Cappellaro et al. (1999) Catalog
The Cappellaro et al. (1999) catalog is a combination of visual and photographic searches from Cappellaro et al. (1993) and Evans et al. (1989), provided to us by E. Cappellaro. SN data includes name, type (classified photometrically), and host name; galaxy catalog includes Hubble type, recession velocity, B-band luminosity and control time. For radio counterparts we use the same methods, matching criteria, flux limits, and radio source catalogs as DV05: the NRAO VLA Sky Survey (Condon et al., 1998), the Parkes-MIT-NRAO survey (Griffith & Wright, 1993), and the GB6 survey (Gregory et al., 1996). We convert radio flux to luminosity as in § 2.4. Table 2 shows we do not recover the same radio luminosities but do classify the same hosts as radio-loud, except for that of SN 1983J which DV05 classify as “borderline” radio-loud and thus add 0.5 SN Ia to the number of radio-loud hosts. We find a lower radio power and would not do this.
Galaxy classifications from the NASA Extragalactic Database999http://nedwww.ipac.caltech.edu (NED) for the early-type SN Ia host sample of DV05 (their Table 2) are reproduced in Table 2, showing some are peculiar (possibly merging) and/or have emission lines. We derive mass and star formation rate from morphology and optical magnitude as in § 2.2, and K-band stellar masses from the 2 Micron All-Sky Survey (Skrutskie et al., 2006) as in § 2.5. We compile infrared data from two Infrared Science Archive 101010http://irsa.ipac.caltech.edu catalogs, the IRAS Faint Source Catalog (Moshir et al., 1992) and the IRAS Cataloged Galaxies and Quasars (Fullmer & Lonsdale, 1989), and convert to infrared luminosity as described by Sanders & Mirabel (1996). We also calculate the expected number of SN Ia for each galaxy from the two-component “A+B” model as described in 2.3, and use the given given galaxy control times (the time during which an exploding SN would be detectable) which also account for SNe detection biases (Cappellaro et al., 1997). Optical properties have an uncertainty of – from conversions between galaxy type conventions, magnitude bands, and mass and SFR models.
The properties of early-type C99 SN Ia hosts presented in Table 2 suggest they may not all be simply quiescent ellipticals, perhaps containing more SN Ia progenitors (of the ‘prompt’ or ‘B’ component variety) than previously expected. For example, NGC 1275 is a LIRG and likely contains dust-obscured star formation and a young stellar component despite being morphologically early-type.
3. SN Ia RATES IN RADIO-LOUD AND INFRARED-BRIGHT GALAXIES
In this section we present SNLS and C99 SN Ia rates in a variety of early-type host galaxy subsets: radio-loud (), radio-loudest (), bright infrared galaxies or BIRG (), and luminous infrared galaxies or LIRG (). The number of SNLS SN Ia observed in D1–2 prior to 2006 Dec 21 for each subset, , is shown in Table 3. Also shown (in brackets) is , where C is the effective control time from Equation 2 and accounts for SNLS detection efficiencies and observing seasons. Thus, is the number of SN Ia which explode per year of SNLS observations. Also quoted are Poisson uncertainties on at the 0.84 () confidence level from Gehrels (1986). The amount of mass in galaxies in each subset is given in Table 4. We calculate the specific SN Ia rate in each galaxy subset, , via:
| (3) |
The in the denominator is a time dilation factor for each galaxy, which converts the units for from observed to rest-frame time. Specific SN Ia rates are given in Table 5 in the commonly used “supernovae unit” SNuM, which is equal to one supernova per century per . Uncertainties are propagated from those in Table 3 but do not include the uncertainty in galaxy masses. Ratios of SN Ia rates in radio and IR subsets over all E/S0 galaxies are given in Table 6. These tables also contain equivalent values for the C99 SN Ia and galaxy catalogs. We use radio luminosities derived in § 2.7 to classify field galaxies, but initially use radio luminosities from DV05 to classify SN Ia hosts in order to make a direct comparison with their results. We revise our results with our own luminosities and discuss in § 3.1 and 4.1.
3.1. Radio-Loud Galaxies
With SNLS data, we find the specific SN Ia rate in radio-loud early-type galaxies to be SNuM, within 1 of the C99 result in Table 5. Whereas DV05 quote a times SN Ia rate enhancement in radio-loud over radio-quiet early-type galaxies, VLA radio catalog incompleteness means we can identify only half of the radio-loud population (§ 2.4) and cannot isolate a radio-quiet set for the SNLS (see Figure 1). In lieu of comparing with a radio-quiet set we consider the ratio between radio-loud and all early-types as a lower limit, and find it consistent with no enhancement at the 1 and 2 levels for the SNLS and C99 catalogs respectively, as shown in Table 6.
Can we correct our radio incompleteness, and does it affect our results? While we could use radio-loud galaxy mass functions to estimate the mass missing from our radio-loud sample, we could not know how many SN Ia this mass hosted, so cannot correct the SN Ia rates for radio incompleteness. Instead, we simply use the limited mass in radio-loud galaxies we do find, and the limited sample of SN Ia hosted by it, as a representative sample. Any SN Ia rate enhancement in radio-loud galaxies would also appear in this limited sample, assuming it is not proportional to (i.e. AGN power). The SN Ia rate is not expected to be proportional to because AGN activity is not suspected of directly influencing the probability of an SN Ia explosion, as discussed in § 1; any evolution in the physical properties of AGN is not expected to influence our results either. Our radio incompleteness is thus unlikely to affect our results - they are a suitable comparison sample to C99.
As an extra test, we present the specific SN Ia rates amongst the “radio-loudest” () early-type galaxies in Table 5, and their ratio over all early-types in Table 6. Unlike the radio-loud, the radio-loudest sample from SNLS catalogs is complete to . While the SNLS SN Ia rate in the radio-loudest early-type galaxies shows no increase over the rate in all early-types, the C99 catalog shows a enhancement which is twice that for the radio-loud sample. However, this is within 3 of a null result, and additional factors may artificially inflate this rate as discussed below.
Although we do not recover precisely the same radio luminosities for C99 early-type hosts as DV05, we have initially used their classifications in order to directly compare with their results. As shown in Table 2, we would place NGC 1316 in the radio-loud subset but not the radio-loudest, and would not classify NGC 3106 as “borderline” radio-loud. Also, SN 1968A in NGC 1275 is listed as type-I, not type-Ia. Although rare, core-collapse supernovae have been observed in early-type galaxies; this is often due to misclassification of late-types as early-type, especially for galaxies with HI and radio emission (Hakobyan et al., 2008; Bazin et al., 2009). NGC 1275 is a known star forming early-type galaxy, has the highest of all C99 early-type hosts (Table 2), and is precisely the sort to potentially host a CC SN. Considering these factors, we have instead 5, 8, and 20 SN Ia hosts in the radio-loudest, radio-loud, and all early-type samples, lowering their rates to , , and SNuM respectively. Ratios for the radio-loudest and radio-loud categories drop to and , bringing the null result within 2 and 1 respectively.
3.2. Bright and Luminous Infrared Galaxies
With SNLS data, we find the specific SN Ia rate in early-type BIRG and LIRG to be and SNuM respectively. As presented in Table 5 the C99 data results agree within 1. Again we consider the ratios between B/LIRG and all early-types as a lower limit on any possible enhancement, as given in Table 6. It appears the SN Ia rate is a factor of 3–5 times higher in B/LIRG, but this is not more significant than 1 (2 for C99 BIRG). While we could have isolated all early-type non-LIRG for a ratio, the LIRG fraction is small enough that this would not be significantly different from the all early-types sample.
As discussed in § 3.1, SN 1968A in early-type LIRG NGC 1275 may not have been a type Ia. Also, SN 1983J and SN 1991Q do not have a definitive classification. The scenario that these three are not type Ia drops the rate in C99 BIRG early-type galaxies to SNuM, consistent with the SN Ia rate in all early-type galaxies. We also note that although one SN Ia host is optically classified as starburst (see § 2.2), it does not have an IR counterpart and cannot be included here.
4. COMPARISON TO THE TWO-COMPONENT “A+B” MODEL
Specific SN Ia rates in subsets of radio and infrared early-type host galaxies are 1–5 times the rate in all early-type galaxies, and all enhancement have low significance (2 at most). In this section we test whether these rates are also consistent with the two-component “A+B” model, and whether the potential enhancements might simply be due to star formation providing additional SN Ia progenitors. To do this, we statistically compare the observed number of SN Ia in radio and infrared early-type galaxies to that predicted by the two-component “A+B” model. For the SNLS catalog, the total number of SN Ia predicted by “A+B” over the survey’s duration is for an individual galaxy, where and are explained in § 2.3. For the C99 catalog, is converted to using given observational control times. Where is the number observed, the Poisson probability of observing given an expected number is expressed by (Bevington & Robinson, 2003):
| (4) |
When , the summed Poisson probability of observing or more is the integral of this from to ; when the probability of observing or less is the integral from to . It assesses whether the observed number of SN Ia is consistent with the “A+B” model in any given galaxy subset, as used for early-type cluster galaxies in Graham et al. (2008). Summed probabilities are considered statistically significant results.
We calculate summed Poisson probabilities for the same SNLS and C99 radio and infrared galaxy subsets described in § 3. Where optical masses and star formation rates are used in the “A+B” model, we refer to the total expected number of SN Ia as and the associated summed probability as . We can also derive and by using infrared SFR if a galaxy has a MIPS counterpart (using optical SFR if not), an account for contributions from dust-obscured star formation to the “prompt” component. When substituting into the “A+B” model in Equation 1, we must alter the “B” value of Sullivan et al. (2006) because it was derived from optical star formation rates, and typically (Takeuchi et al., 2005). Although Figure 4 shows –, this is for the small fraction of brightest infrared galaxies in which this factor is, in most cases, due to dust-obscured star formation. Had been used for all regular galaxies, the derived B value would be .
4.1. Radio-Loud Galaxies
Summed Poisson probabilities for SNLS radio-loud and radio-loudest early-type galaxy samples are as in Table 7, indicating no significant deviation between observations and “A+B” model predictions. As discussed in § 3.1, it is unlikely the SNLS results are affected by our radio incompleteness.
However, results for the C99 samples suggest significant to very significant deviations in the samples of radio-loud and radio-loudest early-type galaxies. These results are unchanged with the consideration of infrared SFR. Could this be due to a variation between derived B values from different surveys (Greggio et al., 2008)? For the C99 radio-loud sample, using B yields and , but B is necessary to raise and for the C99 radio-loudest early-type subset, so a change in B value cannot be the whole story. As discussed in § 3.1, the actual number of SN Ia in the radio-loud and -loudest subsets of C99 may be 8 and 5 respectively. This would increase and to for both subsets, which we do not consider significant.
4.2. Bright and Luminous Infrared Galaxies
Summed Poisson probabilities in Table 7 for SNLS BIRG and LIRG early-type samples hints at a possible excess of SNe Ia over optical “A+B” model predictions, and the inclusion of does raise and , but these results are not statistically significant. The same can be said for C99 BIRG, though as discussed in § 3.1 the number of C99 SN Ia in BIRGs may be just 1, in good agreement with . In general we find the number of SN Ia in BIRG and LIRG is consistent with predictions of the “A+B” model.
We note in § 2.5 that infrared emission of potentially AGN-dominated galaxies has been converted to with a starburst-dominated template, thereby artificially inflating . Identifying galaxies which lay along the “AGN plume” (left plot, plume between ) and in the “AGN Zone” (right plot) of Figure 3 as the most likely to be AGN, we find this population contributes 20–40% of the additional SN Ia predicted when is included, as in 20–40% of ()-().
5. ALTERING THE DATA CONSTRAINTS
To consider whether altering the constraints on SNLS data effects our results we try, in turn: extending our redshift range to , including galaxies with SED type Sbc, and different combination methods for our radio catalogs.
Sixteen SNLS SNe Ia early-type host galaxies have , but due to the flux limits of our radio catalogs, none are associated with a radio or infrared counterpart (only the Sbc type host of SNLS SNe Ia 04D2ca at is detected as a LIRG). We determine the effective control time for D1 and D2 in redshift ranges 0.6–0.8 ( and ) and 0.8–1.0 ( and ) to account for varying SNLS detection efficiencies. The specific SN Ia rate in all early-type galaxies to is SNuM, not significantly different from that for . Extending to adds mass - but not SN Ia - to the radio and infrared early-type subsets, reducing rates and ratios to insignificant levels and increasing summed Poisson probabilities to . No new information is gained from extending to as radio and IR catalogs are not deep enough, and doing so only dilutes our sample.
There are 34 galaxies with SED type E/S0 to Sbc and , 6 radio-loud and 5 BIRG as in Table 1. The specific SN Ia rate amongst all E/S0–Sbc galaxies is SNuM, (higher than for all E/S0); in the radio-loud set it is SNum (similar) and in the BIRG set is SNuM (lower). No statistically significant SN Ia rate enhancement in radio or infrared over all E/S0–Sbc galaxies is observed, and in these sets the summed Poisson probability is . Including Sbc type galaxies adds to our total SN Ia in radio and infrared hosts, but their naturally larger B component makes it harder to tell whether any contribution to the B component is being made from star formation associated with radio and infrared emission.
The deeper flux limit of the VLA-COSMOS in D2 may result in slightly different radio source populations between D1 and D2. To investigate whether this effects our results, we first restrict VLA-COSMOS to the same flux limit as VLA-VIRMOS, . Only 2 SN Ia in radio-loud early-type galaxies are observed, which decreases the specific SN Ia rate to SNuM, increases its ratio over all early-types to , and raises the summed Poisson probability to . Secondly, we limit our analysis to the deeper radio catalog in D2 and are left with one radio-loud E/S0 SN Ia host, which yields a rate of SNuM, a ratio over all E/S0 , and . In general we conclude that any differences in the radio source populations are not major contributors to the results of this experiment.
6. SN Ia PROPERTIES
It is well established that SN Ia light curve shape and peak luminosity are correlated: more slowly-declining light curves reach a brighter peak luminosity. Light curves are parametrized by , the decrease in magnitude over the first 15 days after maximum light (Phillips, 1993), or by stretch, , the amount that a template (average) light curve must be “stretched” to fit the observations where for brighter, slower declining SNe Ia (Perlmutter et al., 1997). SN Ia peak luminosity depends on the mass of 56Ni synthesized during the explosion (Arnett, 1982); whether this mass is influenced more by the metallicity or age of the white dwarf progenitor star is under much debate (Timmes et al., 2003; Röpke & Hillebrandt, 2004; Gallagher et al., 2005, 2008; Howell et al., 2009).
SN Ia properties are also correlated with qualities of the host galaxies, where late-type star-forming galaxies host mostly bright, slowly declining SNe Ia, and early-type elliptical galaxies with little to no star-formation host faint, rapidly declining SNe Ia (Hamuy et al., 1996; Howell et al., 2001). Gallagher et al. (2005) compiled a database of 57 local SNe Ia and found the mean in late-type (Sa to Peculiar) host galaxies was , but in early-type (E/S0) hosts . Sullivan et al. (2006) show the median stretch of SNLS SNe Ia in late-type star-forming galaxies is greater than in early-types. This is supported by Howell et al. (2007) who use light curve fitting routine SiFTO (Conley et al., 2008) to constrain the stretch distribution of “B” (prompt) component SNe Ia (associated with young stellar populations) to be centred at with , and of “A” (delayed) component SNe Ia (associated with old stellar populations) to be centred at with .
If SNe Ia in radio-loud early-type hosts are associated with young stars, their stretch values should be consistent with the “B” component stretch distribution. SiFTO stretch values for SNLS SNe Ia in radio galaxies are given in Table 1. (SN Ia 06D2je was not included in the SNLS third-year results, but preliminary fits show its stretch is similar to 05D1hn). Stretches for SN Ia 04D1jg, 05D1hn, and 06D2ck are consistent with the “B” component distribution of Howell et al. (2007). Individually, 05D1hn and 06D2ck are more consistent with originating from the “A” component at the 1 level, but collectively these three have a mean stretch of with 0.057, which overlaps the 1 uncertainty of the “A” component stretch distribution.
Amongst C99 SNe Ia in radio-loud early-type hosts, five of eight have a given in Table 2 of DV05, . Their mean is with which is consistent with for SNe Ia in early-type hosts (Gallagher et al., 2005). Instead of a numerical comparison, DV05 find that the distribution of decline rates for SNe Ia in radio-loud early-type hosts is intermediate between that found for late-type and early-type hosts. They suggest this supports a continuum of SN Ia and host galaxies properties, from young progenitors in very active galaxies, intermediate age progenitors in active galaxies, and old progenitors in passive galaxies. Stretch values for the three SNLS SNe Ia in radio-loud early-type galaxies also support this.
Two SNLS SNe Ia found in radio-loud late-type hosts, 05D1by and 06D2ff, have stretch values consistent with the “B” and “A” component distributions respectively which is normal since late-types have an underlying old stellar population. Two SNLS SNe Ia in non-radio BIRG hosts, 04D2bt (early-type) and 06D2ca (late-type), have stretch values consistent with the “A” and “B” component distributions which also agree with their host type.
In general we find the properties of radio and infrared SN Ia hosts, and their environments, to resemble dusty starburst galaxies (§ 2.6), and expect their SN Ia light curves to be reddened and extinguished. SNLS analysis finds 05D1by, 05D1hn, 06D2ff, and 04D2bt are particularly red, and the first three have large Hubble residuals, indicating this is an unusually red, faint sample of SNe Ia. It is interesting that 04D1jg and 06D2ca are not particularly red or faint, because these two SN Ia have the brightest infrared hosts. Perhaps they originated on the ’near’ side of the galaxy and escaped dust extinction (neither have large host offsets, 2 and 0.5 arcseconds respectively). Also, the host of 06D2ca is SED type Scd and likely has unobscured star forming regions.
As a final note, SN Ia 05D1by is also spectroscopically peculiar in that the Silicon line is very broad, indicating fast ejecta velocities. It is similar to SN 2001ay (Nugent et al., 2001), which had an atypically slow light curve decline given its unremarkable peak magnitude, a very luminous near-IR magnitude at days post maximum, and an early-type host(Phillips et al., 2003). Such peculiar spectra comprise of all SNe Ia, but in this small sample it is impossible to comment on whether they are more or less common in active galaxies.
7. DISCUSSION
With the C99 and SNLS catalogs we recover the SN Ia rate in radio-loud early-type galaxies of DV05, and for the first time we calculate SN Ia rates in the radio-loudest, BIRG, and LIRG subsets of early-type galaxies. We find these rates are 1–5 times the rate in all early-type galaxies, at that any potential enhancement is . For the first time, we have incorporated infrared star formation rates into the two-component “A+B” model. While it does slightly increase the number of SN Ia predicted, more so in B/LIRG than in radio-loud(est) samples, ultimately all SNLS results are consistent with the two-component “A+B” model. The same cannot initially be said for all C99 results, but the observed number of C99 SNe Ia may be an upper limit due to SN Ia and/or host misclassifications.
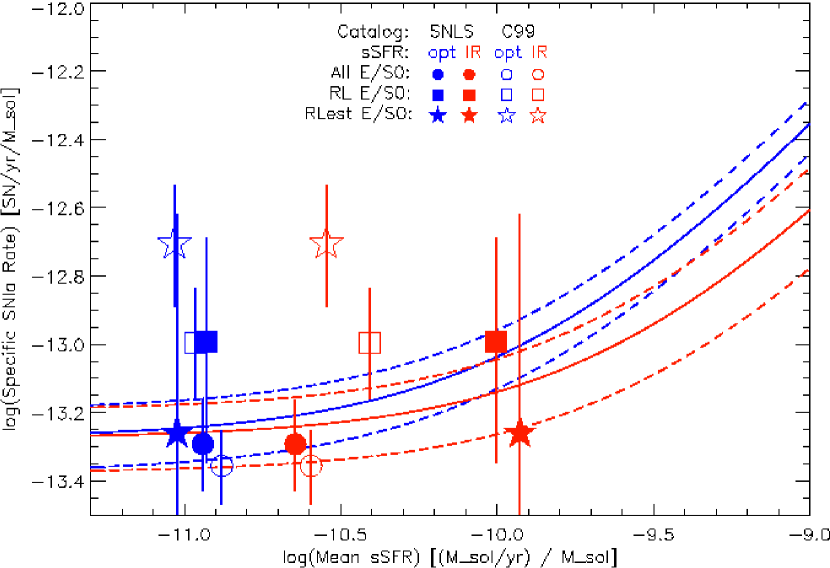
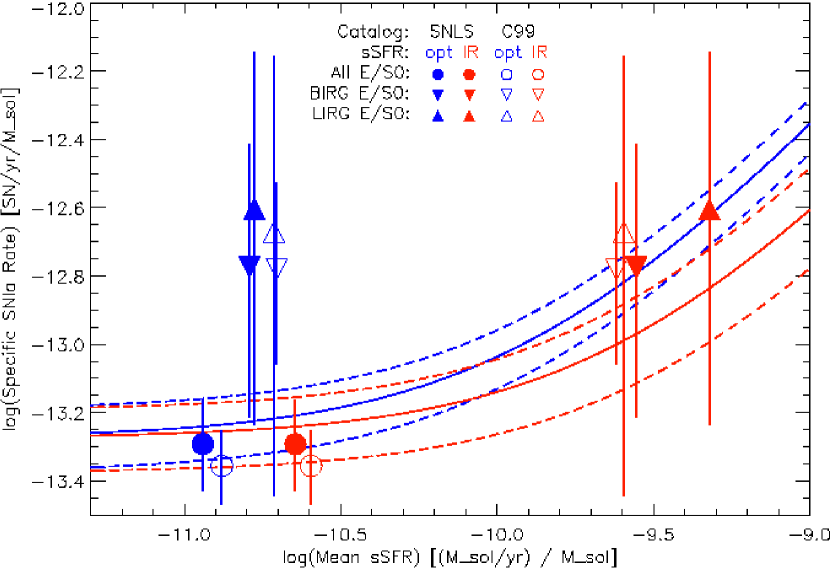
The benefit of considering infrared host galaxy properties to account for possible dust obscured star formation is best shown in Figure 6, which plots the specific SN Ia rate as a function of mean specific star formation rate (sSFR) for each early-type galaxy subset. Blue symbols indicate where sSFR was derived from optical data only, and red symbols where was substituted for all galaxies with counterparts in the Spitzer IR catalogs. Curved lines show the two-component “A+B” model from Sullivan et al. (2006). Although error bars are large and all rates are within of the optical “A+B” model, when plotted with the SNLS SN Ia rates in B/LIRG and radio-loud(est) subsets do align more closely with “A+B”. The same can be said for C99 B/LIRG, and the apparent discrepancy for the C99 radio-loud(est) subset may be due to misclassifications discussed in § 3.1. These results are not significant, but are included to demonstrate the utility of such an analysis for future SN Ia rates.
DV05 suggested the SN Ia rate enhancement in radio-loud early-type galaxies may be due to galaxy mergers triggering radio activity and providing extra SN Ia progenitors by induced star formation. Some aspects of the SNLS data are consistent with this: the evidence for dust-obscured star formation in SN Ia radio hosts, the agreement between observations and “A+B” model predictions in SN Ia radio hosts, and the properties of SN Ia in radio hosts being similar to those associated with intermediate age stellar populations. However, the discrepancy between observations and “A+B” model predictions for C99 radio galaxies remains. In § 3.1 and § 4.1 we discuss possible SN Ia and/or host misclassifications, but might it be the two-component model is simply inappropriate for radio galaxies? It is a linear approximation to a relation that is not necessarily linear, and uses current SFR as a measure of the SFR when the white dwarf progenitor star was born - the parameter actually related to the number of SN Ia progenitors. In regular spiral galaxies where the SFR remains constant for to Gyr this is essentially true, but not necessarily for galaxies experiencing interactions and/or mergers, and perhaps episodic star formation (discussed below), on timescales of years (DV05). This is not a failure of the “A+B” model, merely a limitation of its application to individual galaxies. In large samples this effect should approximately “average out”.
With such a hypothetical episodic SFR, Mannucci et al. (2006) show the radio-loud SN Ia rate enhancement of DV05 is best fit with a bimodal delay-time distribution (DTD) for SN Ia in which of the prompt component explodes in years, and suggest two physically distinct populations of SN Ia progenitors. However, we find the SNLS SN Ia rate in radio galaxies agrees with the “A+B” model, which is consistent with continuous DTD’s (Pritchet et al., 2008), and that the properties of SNe Ia in radio hosts do not constrain them to very young stellar populations (as does DV05).
As a final note, the suggestion by DV05 that galaxy interactions and/or mergers cause both the radio activity and enhanced SN Ia rate is consistent with the well documented correlation between clustered environments and radio galaxies (Magliocchetti et al., 2007). Figure 5 shows image stamps of radio SN Ia host environments; galaxies within (i.e. ) are marked. This figure demonstrates that most radio loud SN Ia hosts have nearby neighbours, as expected for elliptical galaxies. As reported in Graham et al. (2008), the host of 05D1by is located in the outskirts of a galaxy cluster. We also find the galaxy density within of this host shows clustering over the background field galaxy distribution, as determined by a “significance parameter” (Graham et al., 2008); the small-scale environments of 04D1jg and 06D2ff hosts also show clustering, but not more so than the average SN Ia environment. In general we find the properties of radio SN Ia hosts and their environments are consistent with dusty starburst galaxies in non-isolated regions. A full analysis of SN Ia in small groups and pairs using spectroscopic (i.e. higher accuracy) galaxy redshifts will be presented in an upcoming paper.
8. CONCLUSION
Based on the SNLS catalog, SN Ia rates in radio and infrared early-type galaxies are 1–5 times the rate in all early-type galaxies, but any enhancement is . Rates in these subsets are consistent with predictions of the two component “A+B” SN Ia rate model. The infrared properties of SN Ia radio-loud early-type host galaxies suggest the presence of dust obscured star formation, and we have for the first time incorporated in the “A+B” model. In the C99 catalog, radio-loudest SN Ia hosts are consistent with the “A+B” model only if some SNe Ia and/or host galaxies have been misclassified. In general we find the properties of SN Ia in radio and infrared galaxies support a continuum of SN Ia and host galaxies properties, from young progenitors in very active galaxies to old progenitors in passive galaxies, as did DV05. Also these SN Ia are fainter and redder than other SN Ia, consistent with a dusty environment, and one was spectroscopically peculiar.
To continue the investigation of SN Ia rates in different stellar populations, observations in the CFHT Deep fields at near- to far-infrared and sub-millimeter would be very useful. Radio coverage of the remaining two CFHTLS deep fields could double the number of high-redshift SN Ia in radio-loud early-type hosts available for analysis, but requires hours per field to achieve the depth of VLA-VIRMOS (D1) and hours per field for VLA-COSMOS depth (D2). Future work including spectroscopic galaxy redshifts will allow an analysis of the small scale environments of SN Ia hosts, and SN Ia rates and properties in small groups and interacting pairs.
References
- Arnett (1982) Arnett, W. D. 1982, ApJ, 253, 785
- Astier et al. (2006) Astier, P. et al. 2006, A&A, 447, 31
- Bazin et al. (2009) Bazin, G. et al. 2009, A&A, 499, 653
- Bevington & Robinson (2003) Bevington, P. and Robinson, R. Data Reduction and Error Analysis for the Physical Sciences. New York: McGraw-Hill Companies Inc., 2003
- Binney & Merrifield (1998) Binney, J. & Merrifield, M. Galactic Astronomy. Princeton: Princeton University Press, 1998.
- Bondi et al. (2003) Bondi, M. et al. 2003, A&A, 403, 857
- Buzzoni (2005) Buzzoni, A. 2005, MNRAS, 361, 725
- Cappellaro et al. (1993) Cappellaro, E., Turatto, M., Benetti, S., Tsvetkov, D. Yu., Bartunov, O. S., & Makarova, I. N. 1993, A&A, 268, 472
- Cappellaro et al. (1997) Cappellaro, E., Turatto, M., Tsvetkov, D. Yu., Bartunov, O.S., Pollas, C., Evans, R. & Hamuy, M. 1997, A&A, 322, 431
- Cappellaro et al. (1999) Cappellaro, E., Evans, R., & Turatto, M. 1999, A&A, 351, 459
- Chary & Elbaz (2001) Chary, R. & Elbaz, D. 2001, ApJ, 556, 562
- Ciliegi et al. (2005) Ciliegi, P. et al. 2005, A&A, 441, 879
- Coleman et al. (1980) Coleman, G. D., Wu, C. C., & Weedman, D. W. 1980, ApJS, 43, 393
- Condon et al. (1998) Condon, J. J., Cotton, W. D., Greisen, E. W., Yin, Q. F., Perley, R. A., Taylor, G. B., & Broderick, J. J. 1998, AJ, 115, 1693
- Conley et al. (2008) Conley, A. et al. 2008, ApJ, 681, 482
- Della Valle et al. (2005) Della Valle, M., Panagia, N., Padovani, P., Cappellaro, E., Mannucci, F., & Turatto, M. 2005, ApJ, 629, 750
- Evans et al. (1989) Evans, R., van den Bergh, S., & Clure, R. D. 1989, ApJ, 345, 752
- Fullmer & Lonsdale (1989) Fullmer, L. & Lonsdale, C. J. 1989, Cataloged Galaxies and Quasars Observed in the IRAS Survey, Version 2, Jet Propulsion Laboratory (JPL D-1932)
- Gallagher et al. (2005) Gallagher, J. S., Garnavich, P. M., Berlind, P., Challis, P., Jha, S., & Kirshner, R. P. 2005, ApJ, 634,210
- Gallagher et al. (2008) Gallagher, J. S., Garnavich, P. M., Caldwell, N., Kirshner, R. P., Jha, S. W., Li, W., Ganeshalingam, M. and Filippenko, A. V. 2008, ApJ, 685, 752
- Gehrels (1986) Gehrels, N. 1986, ApJ, 303, 336
- Graham et al. (2008) Graham, M. L. et al. 2008, AJ, 135, 1343
- Greggio et al. (2008) Greggio, L., Renzini, A., & Daddi, E. 2008, MNRAS, 388, 829
- Gregory et al. (1996) Gregory, P. C., Scott, W. K., Douglas, K., & Condon, J. J. 1996, ApJS, 103, 427
- Griffith & Wright (1993) Griffith, M. R. & Wright, A. E. 1993, AJ, 105, 1666
- Hakobyan et al. (2008) Hakobyan, A. A., Petrosian, A. R., McLean, B., Kunth, D., Allen, R. J., Turatto, M., & Barbon, R. 2008, A&A, 488, 523
- Hamuy et al. (1996) Hamuy, M., Phillips, M. M., Schommer, R. A., Suntzeff, N. B., Maza, J., & Aviles, R. 1996, AJ, 112, 2391
- Hogg et al. (2002) Hogg, D. W., Baldry, I. K., Blanton M. R., & Eisenstein, D. J. 2002, (arXiv:astro-ph/0210394)
- Howell et al. (2001) Howell, D. A. 2001, ApJ, 554, 193
- Howell et al. (2007) Howell, D. A., Sullivan, M., Conley, A., & Carlberg, R. 2007, ApJ, 667, 37
- Howell et al. (2009) Howell, D. A. et al. 2009, ApJ, 691, 661
- Ilbert et al. (2006) Ilbert, O. et al. 2006, A&A, 457, 841
- Kinney et al. (1996) Kinney, A. L., Calzetti, D., Bohlin, R. C., McQuade, K., Storchi-Bergmann, T., & Schmitt, H.R. 1996, ApJ, 467, 38
- Komatsu et al. (2009) Komatsu, E. et al. 2009, ApJS, 180, 330
- Lacy et al. (2004) Lacy, M., et al. 2004, ApJS, 154, 166
- Ledlow and Owen (1996) Ledlow, M. J. & Owen, F.N. 1996, AJ, 112, 9
- Livio et al. (2002) Livio, M., Riess, A., & Sparks, W. 2002, ApJ, 571, L99
- Lonsdale et al. (2003) Lonsdale, C. J. et al. 2003, PASP, 115, 897
- Madrid et al. (2007) Madrid, J. P., Sparks, W. B., Ferguson, H. C., Livio, M., & Macchetto, D. 2007, ApJ, 654L, 41
- Magliocchetti et al. (2007) Magliocchetti, M., & Brüggen, M., 2007b, MNRAS, 379, 260
- Magliocchetti et al. (2008) Magliocchetti, M., Andreani, P., & Zwaan, M. A. 2008, MNRAS, 383, 479
- Mainieri et al. (2008) Mainieri, V. et al. 2008, ApJS, 179, 95
- Mannucci et al. (2003) Mannucci, F. et al. 2003, å, 401, 519
- Mannucci et al. (2005) Mannucci, F., Della Valle, M., Panagia, N., Cappellaro, E., Cresci, G., Maiolino, R., Petrosian, A., & Turatto, M. 2005, A&A, 433, 807
- Mannucci et al. (2006) Mannucci, F., Della Valle, M., Panagia, N. 2006, MNRAS, 370, 733
- Mannucci et al. (2007) Mannucci, F., Della Valle, M., & Panagia, N. 2007, /mnras, 377, 1229
- Moshir et al. (1992) Moshir, M., Kopman, G. & Conrow, T. A. O. 1992, Explanatory Supplement to the IRAS Faint Source Survey, version 2, JPL D-10015 8/92 (Pasadena: JPL)
- Neill et al. (2006) Neill, J. D. et al. 2006, AJ, 132, 1126
- Nugent et al. (2001) Nugent, P., Aldering, G., Hook, I., Permutter, S. & Wang, L. 2001, IAU Circ. 7612
- Perlmutter et al. (1997) Perlmutter et al. 1997, ApJ, 483, 565
- Perlmutter et al. (1999) Perlmutter, S. et al. 1999, ApJ, 517, 565
- Perrett et al. (2009) Perrett, K. et al. 2009, PASP, in preparation
- Phillips (1993) Phillips, M. M. 1993, ApJ, 413, 105
- Phillips et al. (2003) Phillips, M. M. 2003, (arXiv:astro-ph/0211100)
- Pritchet et al. (2008) Pritchet, C. J., Howell, D. A., & Sullivan, M. 2008, ApJ, 683, 25
- Riess et al. (1998) Riess, A. et al. 1998, AJ, 116, 1009
- Riess et al. (2007) Riess, A. et al. 2007, ApJ, 659, 98
- Röpke & Hillebrandt (2004) Röpke, F. K. & Hillebrandt, W. 2004, å, 420, 1
- Sanders & Mirabel (1996) Sanders, D. B. & Mirabel, I. F. 1996 ARA&A, 34, 749
- Sanders et al. (2007) Sanders, D. B. et al. 2007, ApJS172, 86
- Sajina et al. (2005) Sajina, A., Lacy, M., & Scott, D. 2005, ApJ, 621, 256
- Schinnerer et al. (2006) Schinnerer, E. et al. 2006, (arXiv:astro-ph/0612314)
- Scannapieco and Bildsten (2005) Scannapieco, E. and Bildsten, L. 2005, ApJ, 629, L85
- Skrutskie et al. (2006) Skrutskie, M. F. et al. 2006, AJ, 131, 1163
- (65) Sullivan, M. et al. 2006a, ApJ, 648, 868
- (66) Sullivan, M. et al. 2006b, AJ, 131, 960
- Takeuchi et al. (2005) Takeuchi, T. T., Buat, V., & Burgarella, D. 2005, A&A, 440, L17
- Timmes et al. (2003) Timmes, F. X., Brown, E. F., & Truran, J. W. 2003, ApJ, 590, 83
- Tristram et al. (2009) Tristram, K. R. W. et al. 2009, å, submitted, (arXiv:astro-ph/0903.4892)
- Wood-Vasey et al. (2007) Wood-Vasey, M. et al. 2007, ApJ, 666, 694
- Zamfir et al. (2008) Zamfir, S., Sulentic, J. W., & Marziani, P. 2008, MNRAS, 387, 856
| SN Ia | SN Ia | SN Ia | SN Ia | Host | Host | Host | Host | Host Radio | Host IR | Host IR |
| SNLS ID | Color | Stretch | SED | Mass | sSFR | Luminosity | Luminosity | sSFR | ||
| [] | [] | [] | [] | [] | ||||||
| 04D1jg | 0.584 | -0.092 | E/S0 | -22.99 | 43.5 | 0.15 | 14.5 | 46.47 | 1.56 | |
| 05D1by | 0.299 | 0.736 | Sbc | -21.17 | 5.43 | 0.82 | 2.85 | 8.972 | 2.66 | |
| 05D1hn | 0.149 | 0.334 | E/S0 | -22.08 | 20.2 | 0.08 | 2.82 | 12.95 | 1.09 | |
| 06D2ck | 0.552 | -0.020 | E/S0 | -22.50 | 32.1 | 0.03 | 5.30 | |||
| 06D2ff | 0.345 | 0.299 | Sbc | -21.94 | 9.19 | 1.17 | 4.16 | 7.871 | 1.84 | |
| 06D2je | 0.418 | E/S0 | -19.79 | 2.16 | 0.25 | 1.73 | ||||
| 04D2bt | 0.220 | 0.222 | E/S0 | -21.40 | 10.1 | 0.08 | 0.00 | 2.193 | 0.35 | |
| 06D2ca | 0.531 | 0.047 | Scd | -21.03 | 0.81 | 6.83 | 0.00 | 33.56 | 24.6 |
| SN Ia Name | Galaxy | Hubble | Radio | NED | Optical | Infrared | Infrared |
| (and Type)aaFrom DV05, except radio powers in brackets from this paper. | NameaaFrom DV05, except radio powers in brackets from this paper. | TypeaaFrom DV05, except radio powers in brackets from this paper. | LuminosityaaFrom DV05, except radio powers in brackets from this paper. | Galaxy TypebbGalaxy types (column 5) from the NASA Extragalactic Database (NED) where E: elliptical; cD: supergiant in cluster; I: irregular; LINER: low-ionization nuclear emission-line region; NLRG: narrow line radio galaxy; pec: peculiar; S: lenticular, A (unbarred), B (barred); Sbrst: starburst; Sy: Seyfert. | sSFR | Luminosity | sSFR |
| [] | [] | [] | [] | ||||
| 1961H (Ia) | NGC 4564 | -4.9 | 0.008 (0.010) | E6 | 0.00 | ||
| 1968A (I) | NGC 1275 | -1.6 | 720.0 (1462) | cD; pec; NLRG | 0.26 | 17.5 | 0.63 |
| 1970J (Ia) | NGC 7619 | -5.0 | 0.540 (0.590) | E | 0.00 | ||
| 1972J (I) | NGC 7634 | -2.0 | 0.040 (0.050) | SB0 | 0.27 | ||
| 1980I (Ia) | NGC 4374 | -4.7 | 20.00 (31.18) | E1; LINER; Sy2 | 0.00 | 0.2 | 0.02 |
| 1980N (Ia) | NGC 1316 | -1.9 | 1000. (1.752) | SAB; LINER | 0.25 | 0.7 | 0.03 |
| 1981D (Ia) | NGC 1316 | -1.9 | 1000. (1.752) | SAB; LINER | 0.25 | 0.7 | 0.03 |
| 1981G (Ia) | NGC 4874 | -4.0 | 24.00 (27.98) | cD | 0.03 | ||
| 1983G (Ia) | NGC 4753 | -2.2 | 0.530 (0.015) | I0 | 0.26 | 0.6 | 0.08 |
| 1983J (?) | NGC 3106 | -1.9 | 0.920 (0.692) | S0 | 0.26 | 1.7 | 0.13 |
| 1986G (Ia) | NGC 5128 | -2.2 | 18.00 (52.39) | S0; pec; Sy2 | 0.25 | 1.6 | 0.20 |
| 1990M (Ia) | NGC 5493 | -2.1 | 0.040 (0.051) | S0; pec | 0.25 | ||
| 1991Q (?) | NGC 4926A | -1.6 | 0.310 (0.325) | S0; pec?; Sbrst | 0.24 | 6.2 | 2.86 |
| 1991bg (Ia) | NGC 4374 | -4.7 | 20.00 (31.18) | E1; LINER; Sy2 | 0.00 | 0.2 | 0.02 |
| 1991bi (Ia) | NGC 5127 | -4.9 | 8.700 (9.843) | E; pec | 0.00 | ||
| 1992A (Ia) | NGC 1380 | -1.9 | 0.020 (0.018) | SA0 | 0.25 | 0.4 | 0.06 |
| 1992bo (Ia) | E352-G57 | -1.5 | 0.160 (0.175) | SB; pec | 0.27 | ||
| 1993C (Ia) | NGC 2954 | -4.9 | 0.080 (0.105) | E | 0.00 | ||
| 1993ah (Ia) | E471-G27 | -2.0 | 41.00 (44.77) | SBb | 0.26 | ||
| 1994D (Ia) | NGC 4526 | -2.0 | 0.042 (0.047) | SAB | 0.26 | 0.7 | 0.15 |
| 1996X (Ia) | NGC 5061 | -5.0 | 0.030 (0.033) | E0 | 0.00 | ||
| Sample | SNLSbbBrackets contain number of SN Ia corrected for SNLS detection efficiencies to be the number which exploded per year of SNLS observations, as in § 2.3. | C99 |
|---|---|---|
| All | ||
| Radio-loud | ||
| Radio-loudest | ||
| BIRG | ||
| LIRG | ||
| Sample | SNLS | C99 |
|---|---|---|
| All | 38440.4 (4337) | 23315.0 (2079) |
| Radio-loud | 3879.3 (165) | 7724.5 (314) |
| Radio-loudest | 1638.8 (46) | 2825.5 (92) |
| BIRG | 1650.3 (179) | 1805.7 (166) |
| LIRG | 747.0 (73) | 469.2 (22) |
| Sample | SNLS | C99 |
|---|---|---|
| [SNuMbb[SNuM] = ] | [SNuMbb[SNuM] = ] | |
| All | ||
| Radio-loud | ||
| Radio-loudest | ||
| BIRG | ||
| LIRG | ||
| Sample | SNLS | C99 |
|---|---|---|
| Radio-loud | ||
| Radio-loudest | ||
| BIRG | ||
| LIRG | ||
| Sample | ||||||
|---|---|---|---|---|---|---|
| Radio-loud | SNLS | 4 | 2.16 | 0.17 | 2.38 | 0.22 |
| C99 | 9.5 | 4.84 | 0.04 | 5.10 | 0.05 | |
| Radio-loudest | SNLS | 1 | 0.90 | 0.59 | 1.00 | 0.73 |
| C99 | 8 | 2.35 | 0.003bbFurther considerations raise in § 4.1. | 2.39 | 0.003bbFurther considerations raise in § 4.1. | |
| BIRG | SNLS | 3 | 1.03 | 0.09 | 1.52 | 0.20 |
| C99 | 4 | 1.39 | 0.05 | 1.77 | 0.10 | |
| LIRG | SNLS | 2 | 0.44 | 0.07 | 0.83 | 0.20 |
| C99 | 1.0 | 0.26 | 0.23 | 0.43 | 0.35 | |