Lyman break galaxy close and interacting pairs at
Abstract
Investigations of interacting and merging galaxies at high redshift are vital to our understanding of their formation and evolution. To date, the identification of interactions at and above has relied on rest-frame ultraviolet morphological parameters. Here, we present five serendipitous spectroscopic Lyman break galaxy (LBG) pairs with projected proper separations kpc in our survey of nine separate deep Keck fields. The data consist of of our highest signal-to-noise ratio LBG spectra and of our most confident colour-selected LBGs. We show that the pairs are composed of two distinct close and/or interacting LBGs from a detailed analysis of the rest-frame ultraviolet 1-D and 2-D spectra and the deep broadband images. In addition, we show that the number and separation distribution of the pairs is expected from (1) the two-point angular correlation function when applied to the LBG pair separation distribution in our survey and colour-selected LBGs from the literature and (2) an analysis of a carefully matched high-resolution hybrid numerical and analytical cosmological simulation. Because the spectroscopic slitlets have random orientations with respect to the close pairs on the sky, the serendipitous pairs provide an unbiased sampling of the underlying close pair fraction. Finally, we discover two Ly emitters (LAEs) in our slitlets and find that they reside within projected kpc of the spectroscopic LBGs. In this work, we uncover a strong relationship between Ly emission and pair separation. All confirmed and all candidate LBG pairs with separations of projected kpc exhibit Ly in emission and we find an indication of an overabundance of Ly emission in pairs with projected kpc separations. This relationship suggests a picture in which a measurable fraction of the Ly emission of LBGs, and potentially LAEs, is generated via interaction mechanisms such as triggered star formation and the dispersal of obscuring gas and dust. As a result, serendipitous spectroscopic close pairs provide a unique means to help identify and study high-redshift galaxy interactions using ground-based optical data.
keywords:
methods: observational – galaxies: evolution – galaxies: formation – galaxies: high-redshift – galaxies: interactions1 INTRODUCTION
A fundamental prediction of LCDM models of structure formation is the hierarchical build up of galaxies via mergers with a rate that declines over time (e.g., Cole et al., 2000, and references therein). Observations of this process at low and high redshift are necessary to test these predictions, assess the effects of interactions, and to help clarify our current understanding of galaxy assembly. Close interactions and mergers act to trigger star formation and contribute to the accretion of matter and the morphological transformation of galaxies over time (e.g., Larson & Tinsley, 1978; Keel et al., 1985; Mihos & Hernquist, 1996; Barton et al., 2000, 2003; Steinmetz & Navarro, 2002; Scannapieco & Tissera, 2003, and many others).
In practice, however, identifying and studying mergers and interactions is difficult, largely because definitions vary, tidal features and interaction indicators can be faint, and morphologies are difficult to quantify. At higher redshifts (), this is more challenging as galaxies become fainter and less resolved. Although nonparametric methods have been developed to characterise the morphology of high-redshift systems (Conselice et al., 2003; Lotz et al., 2006; Law et al., 2007), such analyses are best done using the superior efficiency and resolution of optical data but, as a result, contribute an additional complication of linking the observed clumpy and chaotic rest-frame ultraviolet (UV) to the better understood rest-frame optical morphology.
The Lyman break galaxies (LBGs) detected by the Lyman break colour-selection technique (Steidel et al., 1996) are a well-studied population of galaxies at high-redshift. Deep Hubble Space Telescope (HST) images of LBGs in surveys such as GOODS, COSMOS, and the UDF show a wide range of rest-frame UV morphologies – from single compact or diffuse systems to multiple compact star forming components with, or without, diffuse emission (e.g, Law et al., 2007; Rafelski et al., 2009). The latter morphology has been interpreted as either star forming regions within a single coalescing galaxy and/or the result of interactions or mergers.
Because of the faint nature of LBGs ( corresponds to m), low-resolution spectroscopy can only achieve a signal-to-noise ratio (S/N) of a few with 8m-class telescopes for galaxies with m using reasonable integration times. This limitation prohibits detailed investigations of individual LBGs. Except for the very brightest cases, detailed studies require composite spectra and/or rare gravitationally lensed systems. Composite spectral analysis (e.g., Shapley et al., 2003) has provided great insight into the average properties of LBGs but dilutes the features and relationships particular to individual systems. Gravitationally lensed LBG systems provide magnified flux that boosts the S/N of individual systems, but the total number of these systems is small, their reconstruction analyses are subject to model constraints, and their chance discoveries do not allow a study at desired redshifts.
Recently, infrared integral field observations using adaptive optics have been very informative on the kinematics of a sample of LBGs (e.g., Förster Schreiber et al., 2006; Law et al., 2007; Shapiro et al., 2008; Wright et al., 2009) from prominent rest-frame optical features. Although this approach has been effective on relatively luminous LBGs, it would be prohibitively time consuming to compile a statistical sample of typical (including faint) systems using existing instruments. Moreover, this method becomes increasingly difficult for higher redshift populations as key features are shifted out of the range of wavelength sensitivity. As a result of the above limitations, a clear and consistent interpretation of the morphological and spectroscopic effect of mergers and interactions of typical LBGs at via conventional approaches lay beyond the sensitivity thresholds and capabilities of current ground-based AO-assisted or space-based observations.
A standard method to identify a large number of merger and interacting galaxy candidates at low- to intermediate redshift and to avoid many of the difficulties in morphological classification and interpretation is to measure the galaxy close pair fraction (e.g., Patton et al., 2000, 2002; Lin et al., 2004; Berrier et al., 2006; Lin et al., 2007; Kartaltepe et al., 2007). Galaxy pairs with observed separations of kpc and velocity offsets of km s-1 are likely to interact and/or merge and can be more easily and consistently observed and quantified. Moreover, galaxies found in close pairs at high redshift have a higher likelihood of an imminent merger than at low redshift based in part on the fact that there are fewer galaxy clusters (e.g., Berrier et al., 2006). As a result, close pairs at high redshift provide a means to identify galaxies that are interacting or are destined to interact on a short timescale and a strong constraint on the merger rate. Finally, the detailed behaviour of close pairs can be tracked in matched high resolution cosmological simulations to glean information beyond that of the observations.
Although the expected number of LBGs in close pairs can be inferred photometrically from the observed angular correlation function, spectroscopy is necessary to help differentiate actual close pairs from false pairs that have small projected separations on the sky. In order to gather a large number of LBG spectra, nearly all surveys to date have utilised optical low-resolution multi-object spectroscopy (MOS). This method uses slitmasks to place slitlets at the locations of selected targets but cannot acquire spectroscopy for objects with very small projected separations on the sky or that conflict in the dispersion direction. While MOS is efficient in acquiring a statistical sample of typical LBGs, this shortcoming makes it difficult or impossible for a single slitmask to acquire information for many of the galaxies closely spaced on the sky. A programme employing a number of overlapping slitmask observations of the same area of the sky could, in principle, resolve this issue. However, we show below that not all close galaxy pairs at are easily identifiable from their imaging alone and would introduce systematics in such a time expensive endeavour.
A different technique, which we introduce here, allows existing MOS datasets to be used to study close and interacting pairs at high redshift. The density and clustering behaviour of LBGs predict that a small fraction of close pairs are expected to fall serendipitously into the area probed by the MOS slitlets. Moreover, because the slitlets in conventional LBG surveys have random orientations with respect to the serendipitous close pairs on the sky, they produce samples unbiased by selection. In this manner, the serendipitous pairs reflect the underlying close and interacting LBG pair behaviour and effectively circumvent the MOS mechanical constraints.
We analyse a conventionally acquired nine-field deep Keck imaging and spectroscopic survey for LBGs and find five serendipitous spectroscopic close pairs. We use 509 colour-selected and 140 spectroscopically confirmed LBGs, the large photometric LBG dataset of Steidel et al. (2003), and a high-resolution cosmological simulation to investigate the distribution of close pair separations and the expectation of the serendipitous pairs. We present several lines of evidence from a detailed analysis of the imaging and spectroscopic data that support the close pair/interacting nature of the serendipitous detections. We show that the properties of this unique sample, in turn, provide insight into the rest-frame UV properties of the LBG population that are otherwise inaccessible and a means to help identify high-redshift interactions in ground-based data.
This paper is organised as follows: We describe relevant information regarding the data and data acquisition in §2. We present the serendipitous spectroscopic interacting pairs, investigate their rest-frame UV behaviour, and compare the results to precedence in the literature in §3. Close pair observations and measurements are discussed in §4 and the results from the simulation analysis in §5. The two Ly emitters discovered in our sample are presented in §6 and we address the observed relationship between Ly in emission and close pair separation in §7. Finally in §8 we provide a summary. All magnitudes are in the AB (Fukugita et al., 1996) magnitude system unless otherwise noted. We assume an cosmology throughout and list close pair separations in physical (proper) units.
2 OBSERVATIONS
We use the LBG survey of Cooke et al. (2005, hereafter C05) for the observational analysis in this paper. The survey consists of deep imaging and spectroscopy of nine widely-separated fields covering arcmin2. Seven fields were imaged using the Low Resolution Imaging Spectrometer (LRIS; Oke et al., 1995; McCarthy et al., 1998) on the 10-m Keck I telescope with two fields imaged using the Carnegie Observatories Spectrograph and Multi-Object Imaging Camera (COSMIC; Kells et al., 1998) mounted on the 5-m Hale telescope at the Palomar Observatory. We obtained follow-up spectroscopy of all nine fields using LRIS. The multiple fields suppress the effects of cosmic variance and provide colour-selected and spectroscopically identified LBGs for statistical analysis. Details of the observations, data reduction, and LBG analysis can be found in C05 and Cooke et al. (2006). Below, we briefly discuss a few relevant specifics of the data.
The LBG candidates in our survey are selected by their BVRI colours. Although the deep images can select LBGs to fainter magnitudes, we restrict our analysis in this paper to LBGs with m in order to define a sample that has (1) photometry accurate to mag uncertainty in all filters that probe the rest-frame UV continua, (2) follow-up spectroscopy, (3) defined photometric selection functions, and (4) a measured spatial correlation function.
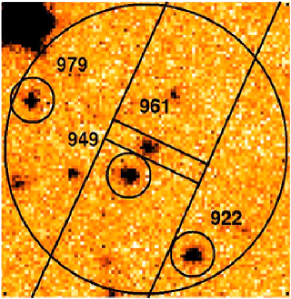
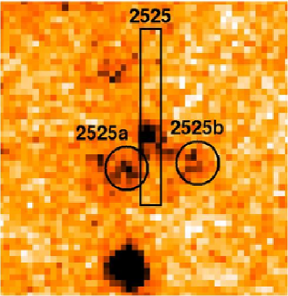
The spectroscopic component of our survey follows a conventional approach to gather a large number of LBG spectra using MOS slitmasks. The survey was not originally designed to study interacting LBGs or to measure close spectroscopic pairs. The physical constraints of MOS slitmasks can prevent acquisition of galaxies that are closely spaced on the sky or those that fall in the dispersion direction of the targeted observations. This situation is illustrated in Figure 1 for two spectroscopically confirmed LBGs and associated colour-selected close pair candidates from our survey. However, because each MOS slitlet covers a non-negligible area of the sky ( arcsec2 on average), occasionally a close pair will have a small enough separation or coincidental near alignment to be detected in a slitlet that was originally intended for a single photometrically identified colour-selected LBG candidate.
The MOS slitlets in our survey were centred on the LBG candidates with position angles near the parallactic angle of the observations to minimise wavelength-dependent flux loss caused by atmospheric dispersion. As a result, this is an unbiased spectroscopic survey for the purposes discussed here because the data were acquired randomly with respect to the orientation of close pairs on the sky. Any detected close pairs in the slitlets are indeed serendipitous and directly reflect the true underlying distribution of close pairs on the scales probed by the dimensions of our slitlets.

The seeing in the images used for colour selection of the LBG sample ranged from arcsec FWHM, with those having FWHM used for pair analysis. In addition, all spectroscopy was acquired under good conditions ( arcsec seeing FWHM). The slitlets were milled to have widths, with minimum and average lengths. With knowledge that LBGs are near-point sources in ground-based observations, we designed the widths of our MOS slitlets larger than the expected seeing FWHM to gather the maximum flux and to compensate for astrometric errors across the focal plane. As a result, the spectral resolution for a given LBG was typically determined by the seeing and is km s-1 FWHM for most observations.
3 SERENDIPITOUS SPECTROSCOPIC CLOSE PAIRS
In the full spectroscopic dataset, we discover LBGs that exhibit unexpected double Ly emission in the 2-D spectra with double or overlapping continua. These data form distinct double Ly emission peaks in the merged 1-D spectra. In addition, we find that these objects show double morphology (two measurably separated flux peaks) in the broadband images. Furthermore, we find that the Ly emission and continua in the 2-D spectra have a one-to-one correspondence in the spatial direction when compared to the separations of the flux peaks in the images. We term these objects “serendipitous spectroscopic close pairs” (SSCpairs).
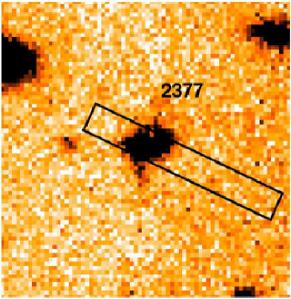
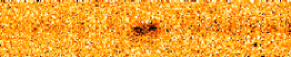
A systematic analysis the images, 2-D spectra, and 1-D spectra of 140 of our highest signal-to-noise ratio (S/N) spectroscopically confirmed LBGs finds five such systems that show compelling evidence for more than one identified major component. We discuss the observed properties of the five SSCpairs in the following sections. Because the separations for some of the SSCpairs cause them to be unresolved by the source extraction routine SExtractor (Bertin & Arnouts, 1996) in the ground-based images, we adopt a naming convention that uses the R.A. of the targeted field and the identification number assigned by SExtractor for the originally targeted LBG. For the SSCpairs that were detected as two distinct LBGs by SExtractor, we label the pair using the R.A. of the field and the identification number of the targeted LBG only. Figure 2 displays the ground-based LRIS R-band images and 2-D spectra of these systems. Object 1643-2377 received follow-up higher S/N, higher resolution longslit spectroscopy using LRIS (Cooke et al., 2008). These data provide valuable insight into LBG close pair properties and are used below to help confirm our analysis methods of the low-resolution, low S/N SSCpair spectra. For the results presented here, including those from the simulation and close pair analysis, we use the parameters of the low-resolution data of 1643-2377 for consistency.
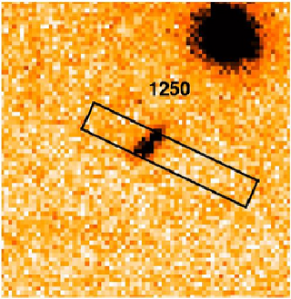
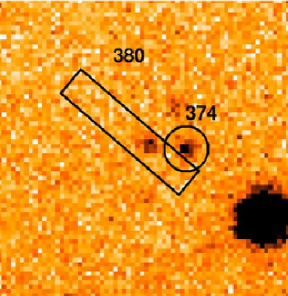
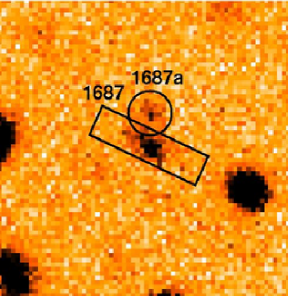
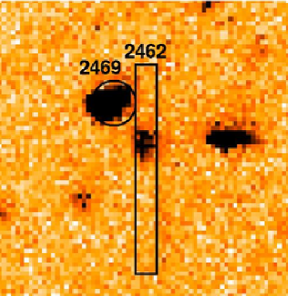
In addition to the five SSCpairs, we find six LBG close pair candidates with separations kpc. These were not included as SSCpairs by definition because the bulk of the emission of the secondary galaxy did not fall into the dimensions of the slitlet. Four of the six SSCpair candidates are shown in Figure 3, with the remaining two shown in Figure 1. Future spectroscopy will determine whether the six candidates are indeed associated.


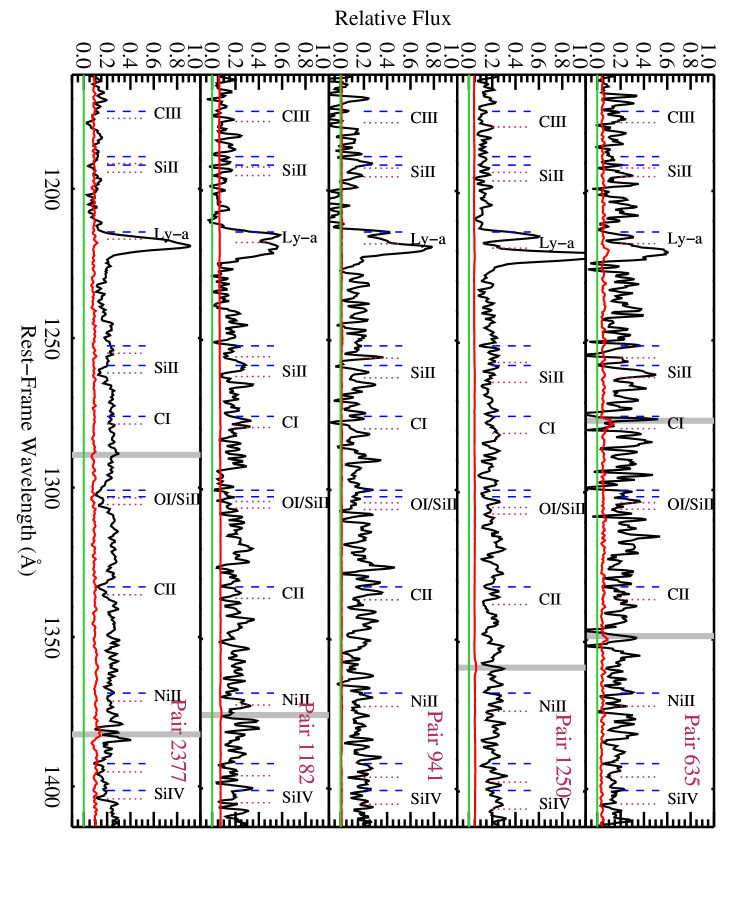
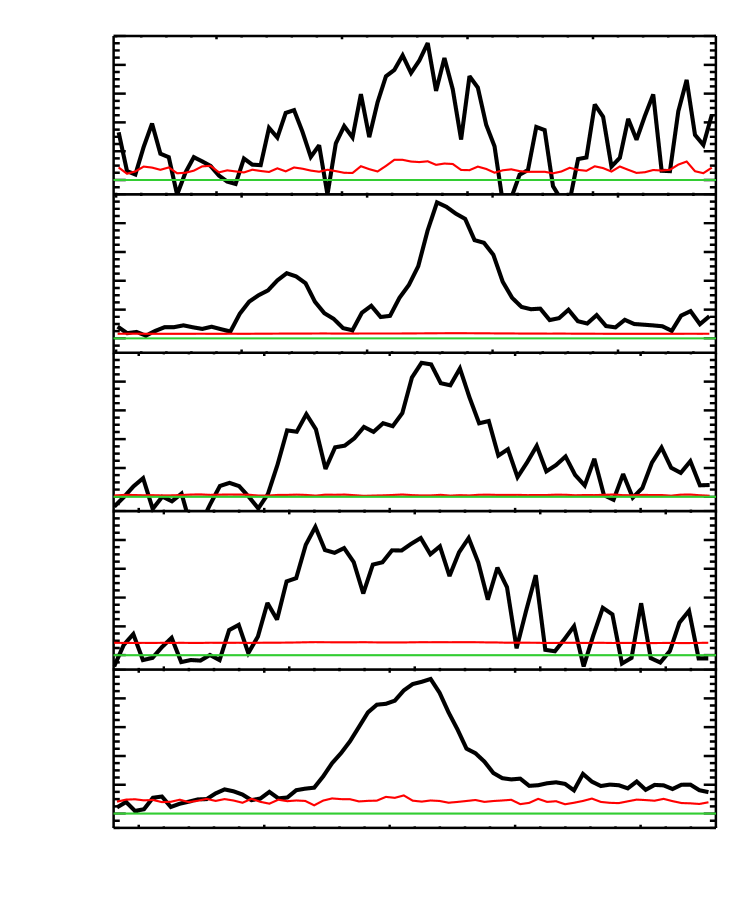
The small separations and overlap of the faint SSCpair spectra make the clean extraction of individual components difficult. As a result, we present the merged spectra111Pair 0957-0941 has the largest separation of the SSCpairs. We made efforts to extract the individual components of the low S/N spectra using conventional routines, but found each spectrum was contaminated with a non-negligible amount of flux from the other galaxy. We present the merged spectra for this pair in Figure 4 for consistency. in Figure 4, along with spectral segments focusing on the Ly features. Presented in this way, the two components of each system can be directly compared, but have blended noise, continua, and features that include absorption effects from the Ly forest blueward of Ly emission. Each component of the SSCpairs shows Ly in emission and we show in §3.2 that this is not a selection bias. The presence of Ly emission from each component results in double-peak Ly emission profiles for all five merged SSCpair spectra.
We remark that the double-peak Ly emission features result from merging the spectra and differ from the double-peak Ly feature predicted for a static or expanding shell of gas arising from a single LBG (e.g., Tenorio-Tagle et al., 1999; Mas-Hesse et al., 2003; Verhamme et al., 2006, 2008). We describe below that the Ly emission features of the SSCpairs do not result from single galactic-scale expanding shells as is evidenced by the two spatially offset Ly emission peaks and continua in each SSCpair 2-D spectrum, double morphology, and the direct correspondence between the spatial offsets of the 2-D Ly features and continua and the flux peaks in the images. We note that an accurate measurement of the small Ly emission velocity offset in the 1-D spectra of SSCpair 1643-2377 is difficult. In that case, we used the high-S/N, higher resolution spectroscopic data (Figure 5) to cleanly measure the Ly peak offset and find that the measurement agrees with our low-resolution value within the uncertainty.
Table 1 lists the relevant information of the five SSCpairs. All reported velocity differences between the two components are corrected for offsets in wavelength resulting from their spatial separation as determined by the associated flux peaks in the images (§ 3.2). We see that the two components have projected physical separations of kpc in the images and 2-D spectra. We remark that because these are projected separations, they represent the minimum actual separations.
O and B stars are largely responsible for the rest-frame UV flux over the wavelengths probed by the optical broadband filters used in this survey. As a result, we interpret the continua and emission lines from the each SSCpair component as a major young star forming region or a distinct LBG. In the following sections, we discuss whether the results favour an interpretation that the SSCpairs are coalescing single massive galaxies with two violent starbursts or an interpretation that the SSCpairs are two separate close and/or interacting galaxies. The lines of evidence presented below argue that these are separate components that are inconsistent with the single galaxy interpretation. We use morphological and spectroscopic information obtained from the SSCpairs, space-based investigations of local LBG analogues, and LBG ground- and space-based observations and relationships found in the literature to help interpret the SSCpairs and to help shed light on the rest-frame UV behaviour of LBGs.
| Pair | R.A.a | DEC.a | mR | b | b | c | c | Slitd | e | Seeingf |
|---|---|---|---|---|---|---|---|---|---|---|
| 0056-0635 | 00:59:27.722 | +01:41:37.37 | 25.0, 25.2 | 3.367,3.386 | 3.363,3.374 | 870 | 350 | 1.5 | 9.5 | 0.8; 1.4 |
| 0336-1250 | 03:39:17.199 | –01:31:29.10 | 23.4g | 2.824,2.845 | 2.819,2.835 | 960 | 575 | 1.5 | 8.2 | 0.9-1.1; 0.6 |
| 0957-0941 | 09:57:48.414 | +33:11:28.43 | 24.8, 25.0 | 2.680,2.688 | 2.678,2.685 | 480 | 400 | 1.5 | 13.3 | 0.9; 1.0 |
| 1013-1182 | 10:15:57.234 | +00:21:55.06 | 24.6g | 2.779,2.792 | 2.775,2.786 | 730 | 555 | 1.3 | 2.6 | 0.9; 0.9 |
| 1643-2377h | 16:44:48.314 | +46:27:08.23 | 22.2g | 3.036,3.044 | 3.029,3.036 | 430 | 360 | 1.5 | 4.7 | 0.8; 0.7 |
| a Coordinates of the LBG flux centroid used to mill the multi-object spectroscopic slitlet. |
| b Assigned redshifts for the respective features of the two identified components |
| c Velocity offset in km s-1 between the respective features, corrected for angular separation |
| d Width of multi-object spectroscopic slitlet in arcsec |
| e Projected angular component separation in the images in physical kpc |
| f Spectroscopic FWHM in arcsec derived from night sky emission lines; R-band seeing FWHM in arcsec |
| g Integrated magnitude of both sources |
| h Values are from the low-resolution data for consistency |
3.1 Morphology
Space-based images of LBGs (e.g., Law et al., 2007) show a wide range of morphologies, such as concentrated single nucleated sources, multiple nucleated sources, and diffuse structures. Although complex, typical LBGs have half-light radii of (Gardner et al., 2000; Ferguson et al., 2004), or kpc, and appear as near-point sources in ground-based images. We inspect the flux contours of the SSCpairs in the LRIS ground-based BVRI images222LBGs at are colour-selected as -band “drop-outs” because the decrement in their continua shortward of the Lyman limit (Å, rest-frame) is redshifted into the -band. Therefore LBGs are extremely faint (R ) or not detected in this bandpass. Inspection of the -band images reinforces the non-detection of both components detected in the longer-wavelength bands and helps to eliminate low-redshift line-of-sight interlopers. for departures from an unresolved source in the form of significant extended features, elongations, or objects with more than one discernible flux peak.
The VRI broadband filters probe the star forming rest-frame continuum of the LBG sample longward of Ly. We find that the centroids of the flux peaks in the ground-based VRI images are accurate to (approximately the seeing half-width half maximum) aided by the near point-source profiles of LBGs. Each LBG that meets the 2-D and 1-D criteria discussed below exhibits two measurably separated flux peaks in the VRI images and have projected centroid separations of kpc. The separations for SSCpairs 1013-1182 and 1643-2377 are at or near the resolution limit. The double nature of 1013-1182 relies largely on other measurements presented in this work such as the two spatially offset Ly emission peaks in the 2-D spectra. For 1643-2377, the high S/N from the intrinsic luminosity of this system allows a secure centroid measurement. Finally, we note that the broadband continuum luminosity and Ly emission from each SSCpair component falls in the range of typical m LBGs at . Consequently, each SSCpair component has LBG-equivalent estimated star formation rates ( yr-1, Papovich et al., 2001; Shapley et al., 2001, 2003).
At low to intermediate redshifts, the UV and optical studies of compact UV-luminous galaxies (UVLGs; e.g., Heckman et al., 2005; Grimes et al., 2007; Overzier et al., 2008, hereafter O08) have made great strides in our understanding the observed LBG UV morphology at high redshift. UVLGs are in every practical way local analogues to LBGs having similar mass, gas content, half-light radii, UV colours, metallicity, and star formation rates. O08 find that although the objects in their sample do not show convincing evidence for mergers or interactions from the HST rest-frame UV imaging alone, every UVLG in their sample shows evidence of interaction in the rest-frame optical images. They conclude that mergers are the main mechanism for the observed star formation in these systems and find that the bulk of the star formation arises in several compact ( pc) regions.
O08 deconvolve the pixel scale and dim the surface brightness of their UVLG sample to match the depth and resolution of LBG observations in the GOODS, COSMOS, and UDF fields. The multiple bright star forming regions of the UVLGs blend into bright clumps with separations of when redshifted to and accurately reproduce the space-based morphology of LBGs. For the ground-based image resolution in our survey, these clumps would appear as a single near-point source for all but the most separated cases, which would be detected as SSCpairs depending on component properties. Perhaps the most convincing evidence of this is the case of SDSS J080844.26+394852.4 (hereafter UVLG 0808) in the O08 sample.
We find that all UVLGs in the O08 sample, except for UVLG 0808, have compact rest-frame UV morphologies and, if placed at , would be detected as single near-point sources333Object SDSS J092600.41+442736.1 shows rest-frame H emission with a separation that is at the limit of what is discernible as two objects in our ground-based survey. It did not receive HST rest-frame UV imaging, so it is unknown at this point whether it has two-component UV flux that would be detectable as a close pair at . Strong detection in the rest-frame UV is unlikely because one component is a much redder galaxy that shows an old, or dusty, population in the SDSS spectrum. in our survey. UVLG 0808 has a fainter companion to the SE that exhibits star formation flux in the UV image. An equivalent separation at would be discernible in ground-based images. In addition, the companion has a compact strong detection in the rest-frame H image and is the only UVLG in the sample that is detected as two separate galaxies by the Sloan Digital Sky Survey (SDSS).
We search the SDSS spectra of the O08 sample for evidence of double-peak emission in the optical nebular lines. These lines are not subject to outflows as are Ly emission lines (§3.2.1) and should closely trace the systemic velocities. The multiple star forming regions of seven of the eight systems are located within and the component relative velocities are near or below the spectral resolution of SDSS, thus these UVLGs show single-peak emission. However, UVLG 0808 shows evidence of a double-peak feature as witnessed in the Balmer lines. Because the two components of UVLG 0808 have an separation, a portion of rest-frame optical flux from the companion galaxy is expected to fall into the SDSS fibre and result in the weaker offset emission line peaks ( km s-1). UVLG 0808 is the only object in the sample that (1) has a well-separated companion, (2) appears as two star forming point source galaxies in the rest-frame UV, and (3) shows evidence of double-peak emission in the 1-D spectroscopy. Observed at , a system with similar properties would appear by our definition as an SSCpair.
Projected component separations of kpc are necessary for individual identification of UVLGs in the O08 sample and LBGs in our survey at the resolution of SDSS and LRIS, respectively. The remarkable similarities between the properties of UVLGs at low to intermediate redshift and LBGs at high redshift, and the evidence that interactions provide the bulk of the star formation in UVLGs, leads us to conclude that the separations and emission profiles observed in our SSCpairs likely result from two interacting LBGs. We investigate this further in the following sections and discuss the spectroscopic and morphological properties of LBGs found in the literature.
3.2 Spectroscopy
The 2-D spectra are individually examined for signs of multiple spectra beyond the usual pipeline reduction of the targeted objects and distinct serendipitous objects. We search for evidence of closely spaced or overlapping spectra, and/or multiple Ly emission or absorption features. Alongside the image and 2-D analysis, we inspect the 1-D spectra for evidence of more then one system from redshift fits to expected interstellar features. The actual number of features fit for a given LBG depends on the redshift and wavelength range probed by the MOS slitlet and does not include lines that fall near bright night sky emission features which can be difficult to extract cleanly from the faint spectra. The spectra in our sample have continua with relatively low S/N () and are typical of LBG observations at .
Ly is the most prominent rest-frame UV feature in LBGs and, in contrast, can be detected at a high significance. The LBG spectra compiled to date show roughly 50% of all LBGs dominated by Ly in emission, with the remaining dominated by Ly in absorption (Shapley et al., 2003, and this sample). Net EW values range from strong emission, Å EW, to damped absorption (column densities of N(Hi) atoms cm-2). Here we term LBGs that are dominated by Ly emission in their spectra, eLBGs, and those dominated by Ly in absorption, aLBGs. After a thorough search for SSCpairs of all types, we observe that each SSCpair component, with no exception, displays Ly in emission. Thus, in our nomenclature, all SSCpair components are eLBGs.
The Ly emission features and continua in the 2-D spectra for every SSCpair have the same separations in the spatial direction as the image centroid separation along that same calculated direction. The one-to-one correspondence helps to confirm the distinct two-component nature of the SSCpairs and enables Ly emission and star-forming continua assignment to each peak in the images. We use the image centroids when correcting the Ly and ISM absorption-line velocity offsets for their angular separation. The separations in the dispersion direction are complicated by the fact that Ly emission has a large range of velocity offsets with respect to the systemic redshift (see § 3.2.1). Nevertheless, in the cases where the flux peaks in the images have small separations in the spatial direction, large differences between the offsets of the two Ly features can provide additional evidence for two major star-forming components.

In practice, detecting double Ly emission can prove to be easier than double Ly absorption when component velocity offsets and angular separations are small. Thus, it is possible, that even after a thorough search, we are missing a fraction of LBG spectroscopic close pairs that only exhibit Ly in absorption because of the low S/N of the spectra and broad nature of the Ly absorption features. However, LBGs displaying Ly in absorption typically have stronger ISM transitions that can facilitate the detection of a velocity offset between two overlapping spectra (Shapley et al., 2003, C05). We find no aLBGs at larger radii where both the angular separation and velocity offsets would resolve the Ly features of the two systems and no clear evidence for double sets of ISM absorption transitions redward of Ly in aLBG spectra. In addition, we do not find SSCpairs having one component in emission and one in absorption in either the 1-D or 2-D spectra. Finally, all spectroscopic components of the SSCpair candidates (Figure 1 & 3) show dominant Ly emission, with none exhibiting dominant Ly absorption. These findings are discussed further in §7. As a result, the observation that all SSCpairs are eLBGs is not primarily a selection effect.
3.2.1 Ly offsets
We measure corrected Ly velocity offsets for the SSCpairs of km s-1. To expand on the difficulties in rest-frame UV continuum interpretation mentioned earlier, Ly emission in LBGs is observed to be redshifted by km s-1 with respect to the systemic redshift (C05 Adelberger et al., 2003; Shapley et al., 2003). The velocity offsets likely result from galactic-scale outflows caused by stellar and supernova-driven winds (e.g., Heckman, 2002; Adelberger et al., 2003). Ly photons are absorbed by the approaching outflow while Ly photons scattered off-resonance from the receding shell can escape. This geometry results in Ly emission peak velocity offsets that are redshifted with respect to the systemic redshifts and dependent on the host galaxy properties. Consequently, the observed difference between the peaks of the Ly features cannot be used directly as a measure of the systemic velocity offsets of the SSCpair components.
However, under the following assumption, we can investigate the nature of the component Ly offsets using the Ly offset distribution of the LBG population. Because of the one-to-one correspondence between the kpc projected separations of the flux peaks in the images and the Ly peaks in the 2-D spectra, we attribute the double-peak Ly features to two distinct galactic-scale outflows. Admittedly, this is a simplified picture but the relatively coarse resolution of our ground-based observations blends the velocities of any localised regions and can only probe net global outflows.
Adelberger et al. (2003) find a velocity offset distribution between Ly emission and the ISM absorption lines () of km s-1. Because LBG ISM absorption lines are blueshifted on average with respect to the systemic redshift by km s-1 (Adelberger et al., 2003; Shapley et al., 2003, and this survey), this results in the above-mentioned km s-1 Ly velocity offset distribution. In addition, Shapley et al. (2003) find that LBGs with dominant Ly emission (Group 3 and Group 4 in that sample, or eLBGs in our nomenclature) show smaller values of and therefore evidence of weaker outflows. If we assume that eLBGs have a similar velocity offset distribution in behaviour and form to that of the full LBG population, the eLBG-only distribution becomes km s-1, with eLBG Ly offsets from the systemic redshift of km s-1.
If the Ly emission in the SSCpairs reflects outflow from two star forming regions in single coalescing systems, we would expect the velocity difference between the two Ly features, , to randomly sample either of the above Ly velocity offset distributions. A random sampling of two values using the distribution of the eLBGs and full LBG population results in expected differences of km s-1 and km s-1, respectively. However, we find a much larger km s-1 for the SSCpairs. If we add a line-of-sight velocity component originating from two regions in a bound, massive LBG system by pulling from a km s-1 distribution of relative velocities (e.g., Erb et al., 2003, 2006; Genzel et al., 2008; Law et al., 2009), we find an expected net two-component velocity offset distribution of km s-1 (or km s-1 for the full LBG population), which falls short of describing our data.
The correspondence between the 2-D Ly emission and continua and the two flux peaks in the images forces us to conclude that the Ly emission features of the SSCpairs arise from either (1) single galaxies, but do not randomly sample the behaviour observed in the full or subset LBG population and that larger than typical values are correlated with star forming regions having substantial line-of-sight velocity contributions or (2) star forming regions with velocity offsets too large to be single systems and are truly pairs of LBGs. In either scenario, the double-peak Ly emission of the SSCpairs lends insight into the behaviour of systems.
3.2.2 ISM absorption
Spectra showing two distinct sets of ISM absorption lines having large velocity offsets together with separate 2-D spatial offsets provide strong evidence for two independent systems. We cross-correlate and visually inspect the SSCpairs for 20 strong ISM UV transitions that include Ly-, Ly-, and strong ISM features such as Siii, Oi/Siii, Cii, Siiv, Siii, and Civ Å. We find evidence for two systemic redshifts from both the low- and high-ion transitions in the merged 1-D spectra. The ISM velocity offsets for the SSCpairs are listed in Table 1. We caution that the low S/N () of the continua and the potentially complex nature of the rest-frame UV behaviour of the ISM, make these the least confident measurements in terms of significance when compared to the other analyses presented here. However, the ISM measurements of the higher S/N low-resolution spectra of 0336-1250 () and 1643-2377 () are more secure.
Our data provide tests of the validity of these low S/N measurements. Object 0336-1250 was observed with three separate slitmasks for a total integration time of 11700s and the luminous 1643-2377 was observed with three exposures of 1500s each. In an effort to mimic the lower S/N of the other SSCpair total observations, we performed fits to each of the three 0336-1250 slitmask observations and the individual exposures of 1643-2377 separately. We found agreement to between the fit to the individual exposures to their respective combined spectrum.
The SSCpairs show a corrected velocity difference between the two identified sets of ISM lines of km s-1. As mentioned above, ISM lines exhibit an km s-1 range in blueshift from systemic. If we assume that the two sets of ISM lines randomly sample this distribution, we would expect km s-1. If we assume the SSCpairs were single systems with the bulk of the ISM absorption seen in the sightlines to two well-separated star forming regions with bound relative velocities km s-1, we would expect the combined effect to result in km s-1, which is much smaller than the observed value. As a result, the evidence in the ISM lines argue for the SSCpairs to be separate systems.
3.2.3 Ly- - ISM velocity difference
A comparison of the difference between the SSCpair Ly and ISM features with the relationships found for LBGs is a further test of the viability of the 1-D spectral features to help confirm the double-galaxy nature of the SSCpairs. As discussed above, Shapley et al. (2003) determined km s-1 for all LBGs and km s-1 for eLBGs that are similar to the SSCpairs. Because we see two Ly emission peaks and evidence for two sets of ISM absorption lines, we treat the SSCpair components as individual systems and measure the for each component separately using no angular separation correction. This results in a km s-1 when assigning the highest redshift Ly feature to the highest redshift set of ISM features and the lowest redshift Ly feature to the lowest redshift ISM features. A reassignment of the Ly and ISM features results in the same central value but a larger scatter. The distribution found for the SSCpairs agrees with that of the LBG population. Moreover, the distribution follows the trend found in Shapley et al. (2003) for LBGs displaying dominant Ly emission.
In treating the SSCpairs as close pairs throughout this section, we would expect the 1-D spectral features of each galaxy to reflect the relationships and trends of the LBG population. We find that the , , and are in good agreement with this picture and are at odds with an interpretation that the SSCpairs represent starforming regions in single systems.
3.3 Comparison to previous related work
We look for observational precedent in the literature to help interpret the SSCpairs by first exploring the LBG sample of Shapley et al. (2006). This sample consists of deep spectroscopy of 14 LBGs at gathered for the purpose of measuring the fraction of escaping continuum flux shortward of the Lyman limit. The observations are valuable for an assessment here because they were selected in the same manner, lay within the same redshift path, and have spectroscopy obtained using the same instrument (LRIS). Moreover, the observations are beneficial here because they have a slightly higher resolution over the bulk of the more relevant wavelengths (Å rest-frame) and have longer exposure times for S/N of . In addition, the associated imaging data were obtained with similar or, for the subset of space-based data, superior depth and resolution.
Of the 14 LBGs in that sample, nine are eLBGs. The Ly EW distribution of the sample is very similar to that of our full spectroscopic LBG sample (K-S test, ). One object, D3, is considered a single system by Shapley et al. (2006) but consists of two galaxies (and separate spectra) with an angular separation of ( kpc ). Three of the nine eLBGs are reported to show double-peak Ly emission. Because both components of D3 show Ly emission, merging the two spectra would create a double-peak spectrum, making it a fourth double-peak system (similar to 0957-0941 in our sample). Relevant to later discussion, of the two LBGs shown by Shapley et al. (2006) to exhibit measurable Lyman continuum flux, one is the double-peak Ly emission system C49 and the other is the pair D3. Narrow-band imaging of D3 shows that it is detected as a Ly “blob” in the sample of Matsuda et al. (2004) with Ly emission extending over arcsec2.
We now analyse the double-peak systems of Shapley et al. (2003) as we did for the SSCpairs using the published information. Looking at the velocity offsets of the Ly feature of the four double-peak systems, we find km s-1, cf. km s-1 for our sample. Shapley and coworkers measure one ISM absorption redshift for each of the three Ly double-peak systems (pair D3 has separate values). If we assign the reported ISM absorption redshifts to the highest redshift Ly peak, we find km s-1. This places these systems at the high-end tail of the distribution for the full LBG population, with one system having the highest ( km s-1) velocity difference of the entire LBG spectroscopic sample. Assigning the features in this manner implies that it is highly improbable that the double-peak systems are single LBGs.
Instead, if we assign the ISM absorption redshifts to the lowest redshift Ly peaks we find km s-1. While the central value matches the expectations of eLBGs and is in good agreement with LBGs in general, the large scatter of the three systems is unrepresentative of the km s-1 scatter that we find for three-galaxy random samples taken from the LBG and eLBG data. In addition, we see similar relative offset and scatter behaviour when we assign the higher redshift ISM features to the lower redshift Ly emission (and vice-versa) in our SSCpair sample (section 3.2.3). When inspecting the double-peak system C32, we find that the lowest redshift Ly peak is blueshifted with respect to the ISM absorption lines by km s-1. If we assign only this system to the higher Ly peak, then the three systems exhibit km s-1 and the scatter is reduced to the level of the expectations. When including the identified pair D3 ( km s-1) in the Ly double-peak sample, we find km s-1, which is more consistent with the distribution and scatter of the eLBG and LBG population. Although matching ISM features to one of the Ly emission peaks can make the double-peak systems fall in line with typical LBGs, what should we make of the second Ly feature?
The above analysis shows that it is more likely that the three Ly double-peak LBGs are close pairs similar to D3 and the SSCpair sample as opposed to single systems. Such an interpretation produces a distribution in better agreement with the expectations of the LBG population and significantly reduces the scatter. It is possible that the presence of a second set of ISM absorption lines in the Shapley et al. (2006) sample may have been unexpected and ignored, identified and interpreted as strong ISM mixing, or identified and considered of too low significance as a result of blending. Although the S/N of the Shapley et al. (2003) LBG sample is higher than what is typical for LBG spectra, it does remain relatively low in that ISM absorption lines remain difficult to study with great confidence. Future investigation of the data (for example, by probing nebular lines in the IR) could resolve this matter.
We remark that Shapley et al. (2003) find % (% depending on slit orientation for D3) of the eLBGs in their sample, and % (%) of the entire sample, to be double-peak systems that meet our SSCpair criteria. The data imply that higher S/N and/or higher resolution should reveal a larger fraction of SSCpairs than that seen serendipitously in our low-S/N, low-resolution survey, with the true fraction potentially even higher.
Next, we examine the study of Law et al. (2007) that consists of space-based imaging of 216 LBGs and ground-based spectroscopy using LRIS with a similar configuration as our survey. In that work, the morphology of LBGs is quantified using a non-parametric analysis within radius ( kpc) which directly reflects the regime of the SSCpairs. In addition, this is the regime where systems are most sensitive to interaction that can visibly change their morphology and star formation properties. Law and coworkers investigate the rest-frame UV morphology of their LBG sample by quantifying the Gini parameter, colour dispersion, multiplicity, and size. The Gini parameter is a measure of the nebulosity or nucleated nature of the system, the colour dispersion is measured using V broadband colours and corresponds to rest-frame Å at , and the multiplicity parameter quantifies the multiple component nature of the sources.
Law et al. (2007) investigate the relationships between the morphological parameters and the spectroscopic features Ly EW, low- and high-ionisation ISM EW, and . As noted in that work, only Ly EW shows a significant and consistent trend at with all four morphological parameters. The Ly relationships indicate greater Ly emission EW with decreasing system size, decreasing nebulosity (increasing Gini parameter), decreasing number of nuclei (multiplicity) or nuclei separation, and bluer colours. In addition, and in reference to low-redshift UVLGs, a visual inspection of the space-based images shows that systems with bright nuclei typically have one or two components whereas systems with faint nuclei typically have three or more components and are found in more diffuse systems.
Ly EW is seen to be strongest for large values of the Gini parameter indicating that nucleated sources are more likely to be eLBGs and diffuse sources are more likely to be aLBGs. The Ly EW increases monotonically over the multiplicity range with values that indicate two strong double nucleated sources (multiplicity parameter value ) down to a single nucleated source (multiplicity parameter value ). Finally, the Ly EW increases as the size of the systems decrease and the colour becomes bluer. Law et al. (2007) show that each of these trends at has a significance of %. Taken together, these data can be interpreted to show that double nucleated LBGs exhibit Ly emission and that the Ly emission EW increases as the components become bluer and as the separation between the two components decreases, or in other words, as the overall object size becomes progressively smaller for a given multiplicity.
The SSCpair observations are consistent with this behaviour and the interpretation that the SSCpairs are interacting bright double nuclei, or two single nuclei LBGs. The double nucleated sources with larger separations are those discernible as SSCpairs in ground-based data, as also indicated by the work of O08. Diffuse systems, and diffuse systems with multiple fainter clumps, would be observed as single LBGs in ground-based data. Moreover, such systems are LBGs with dominant Ly absorption from the Law et al. relationships. Strong Ly EW and blue continua can be evidence for recent star formation and/or decrease in dust and gas obscuration. The Ly EW of the SSCpairs in order of decreasing projected separation is and Å. Although the SSCpairs sample is too small to determine a trend, the SSCpairs have similar separations as the double nuclei LBGs in the Law et al. (2007) sample, have blue colours, and exhibit Ly emission with EWs that are in the upper quartile of the full LBG sample.
We comment that the work of Law et al. (2007) does not investigate the behaviour of LBGs with separations larger than kpc. We probe this regime in §4 and address statistics applicable to this discussion in §7. In the next section, we test the expectations of finding the SSCpairs by measuring the distribution of LBG close pair separations in our full survey and a larger survey from the literature and by testing LCDM predictions using a high-resolution cosmological simulation. We show that the number of SSCpairs are indeed expected and, as a result, the investigation of this and other similar samples offers a unique window into the behaviour and properties of close/interacting high redshift galaxies.
4 SERENDIPITOUS PAIR EXPECTATIONS FROM CLOSE PAIR SEPARATIONS
To investigate the distribution of LBGs on small scales ( kpc), we measure the number of LBG pairs versus separation from observation. To help test the universality of the results and to improve the statistics, we augment an investigation of our survey with the photometric and spatial information from the larger survey of Steidel et al. (2003), hereafter S03, consisting of colour-selected and spectroscopically identified LBGs in 17 separate fields.
4.1 Pair definition
For the C05 survey, we consider only LBGs that are identified in our images by SExtractor with m. The LBGs were selected using BVRI colour criteria
| (1) |
| (2) |
| (3) |
| (4) |
| (5) |
| (6) |
In order to provide more reliable photometric statistics, we use only colour-selected LBGs that meet the full criteria in the seven of the nine fields that have high-quality five filter imaging and LBGs that meet four-filter criteria in the remaining two fields (see C05 for details regarding the BVRI selection criteria and the specifics of the color criteria for each of the nine fields). For the S03 survey, we use all LBGs that meet the used in that work. These color-selection criteria are tested using and spectra in the respective samples.
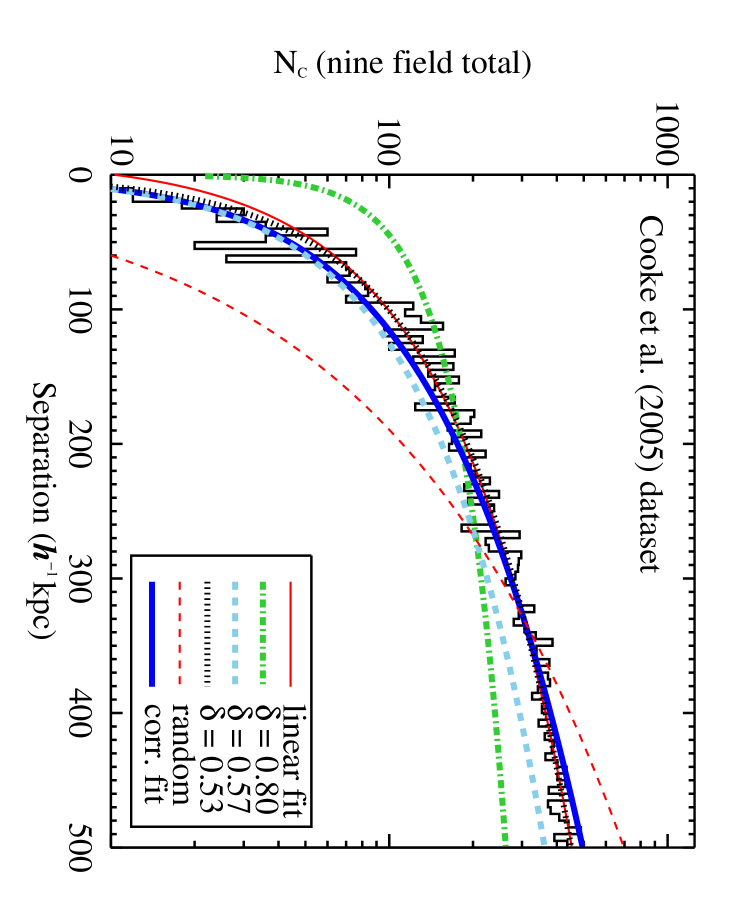
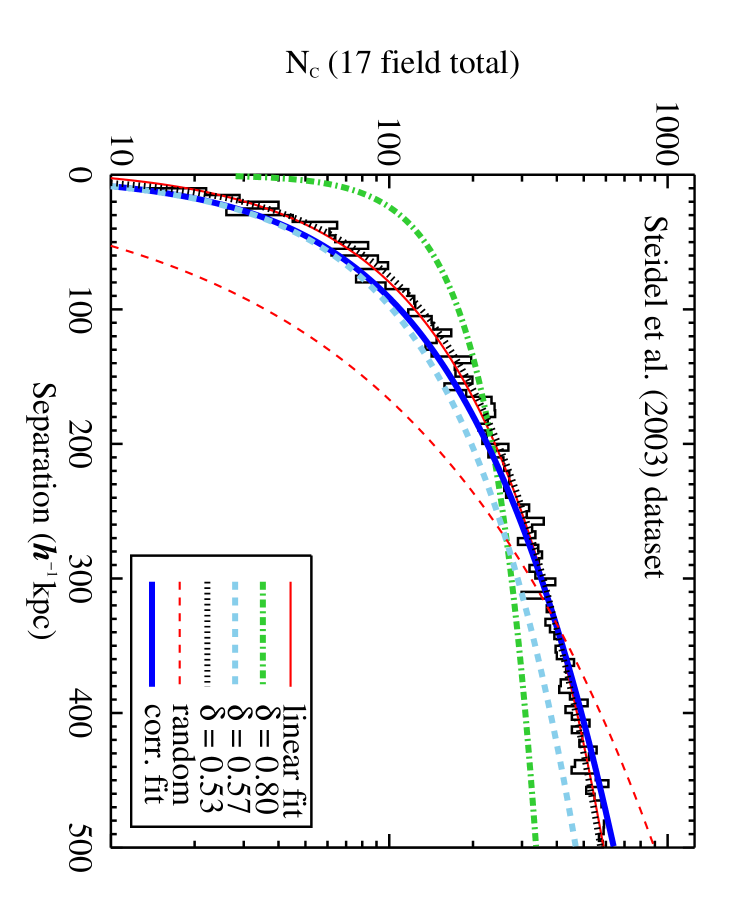
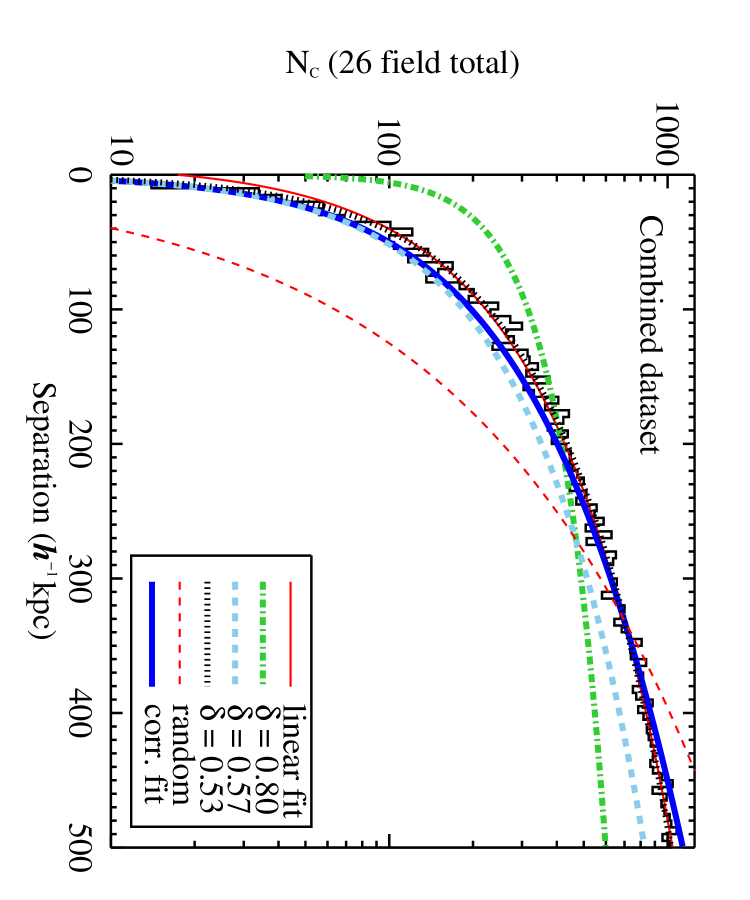
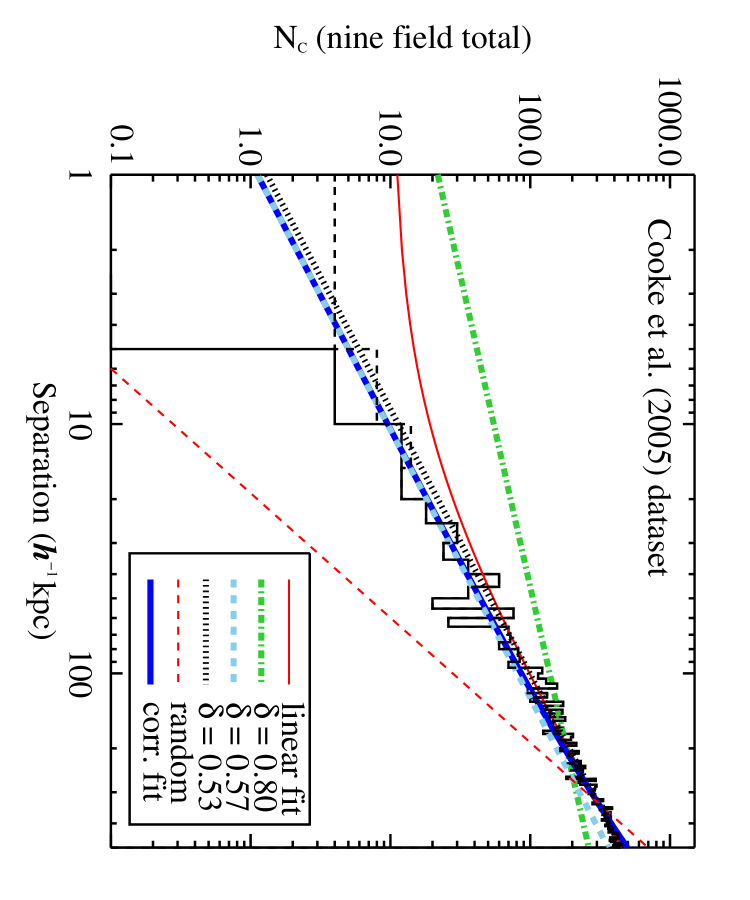
LBG colour selection at is very efficient in filtering out objects not in the redshift path of interest (interlopers). As determined from the two spectroscopic samples, the fraction of interlopers in each survey is similar () when considering the particular treatment of the unidentified low S/N spectra. Differences in the photometric selection functions and selection efficiencies between the two surveys are small and are quantified and corrected for using the information from the spectroscopic samples. Figures 6 & 7 present the close pairs versus separation for this survey, the survey of S03, and the combined dataset. The two figures emphasise large and small scales, respectively. The fall-off in the number of pairs at radii kpc (best seen in Figure 7) results from the resolution of the images and the ability for SExtractor to discern close galaxies as separate.
4.2 Pair separations
Overlaid on Figures 6 & 7 are the pair separation expectations from a linear (solid thin red line) and power-law (dotted black line) fit to the raw data. We find that a power law slope of provides a best fit for all three samples. As illustrated in the two figures, both forms fit well over all separations, with the linear fit showing a departure from the data near, and below, kpc. Continuations of both fits argue for the existence of LBG pairs with separations smaller than the imaging resolution.
As mentioned above, interlopers comprise a non-negligible fraction of colour-selected LBGs. To estimate the form of the contribution to the pair separations from random interloper line-of-sight projections and to estimate the likelihood that the SSCpairs are random projections, we construct mock catalogues having the physical dimensions of the images. We insert galaxies with random locations in the plane of the sky following the number densities found for each field and the redshift distributions for each survey.
Using catalogues of this design is effective at the small separations studied here because the likelihood of random pairs is low as a result of the relative low surface density of colour-selected galaxies ( arcmin-1). In addition, the enhancement of the number of random projected close pairs as a result of the spatial clustering of LBGs is negligible as compared to random line-of-sight projections. The colour-selection techniques used here probe Mpc. The spatial correlation length of LBGs is Mpc (Adelberger et al., 2003, 2005; Cooke et al., 2005) with an average of LBGs over random integrated over that volume. Beyond that distance, the clustering effects of LBGs diminishes and the effects of random projections become dominant. Because the projected separations of the SSCpairs are kpc , the increase in likelihood that the SSCpairs are random projections enhanced by the spatial clustering of LBGs is vanishingly small.

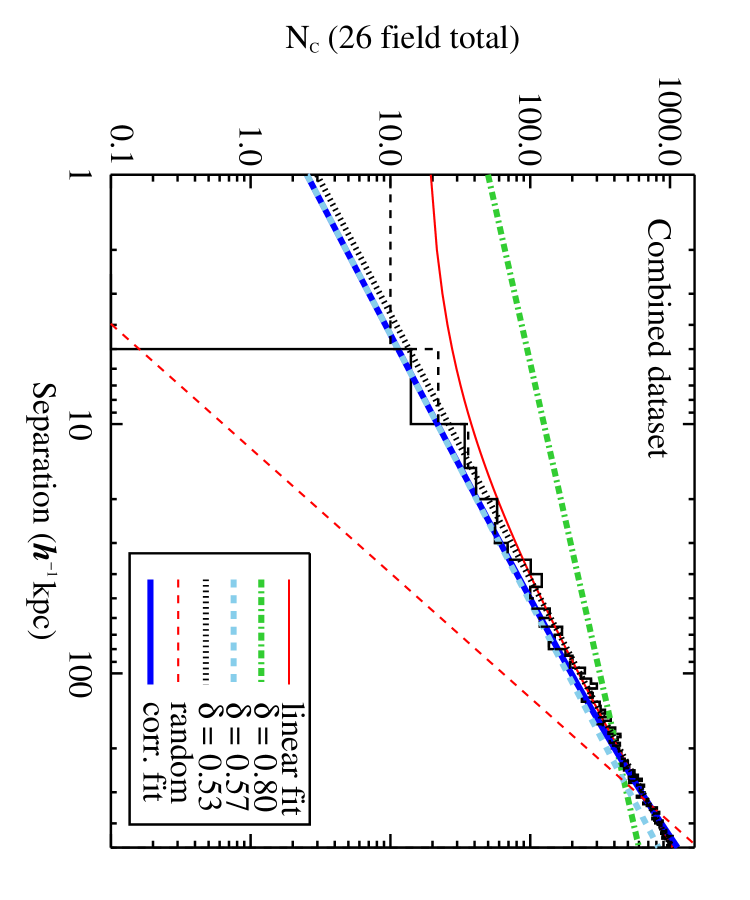
We measure the interloper contribution for each field separately and combine the results from 1000 runs of the mock catalogues. The form of the contamination is shown on Figures 6 and 7 (dashed thin red line) normalised to the total number of separations. From the mock catalogues, we find that the fraction of random projected pairs with separations kpc averaged over the 26 fields is . As a result, the SSCpairs are not random projections.
To estimate the interloper contribution to the pair separations, we minimised a fit of a two component distribution that includes the random catalogue results and the angular clustering of LBGs. For LBG angular clustering, we used the conventional form of the angular correlation function, . We first test the fit by fixing the slope of the angular correlation function to as found by Adelberger et al. (2005) and varying the fraction of interlopers, . We find the best fit when using an interloper fraction of and for the C05 and S03 samples, respectively. The contribution by the LBG angular correlation function is shown in Figures 6 and 7 as the thick dashed (light blue) lines with the combined two-component LBG/random contribution (corrected angular correlation function) shown by the thick solid (blue) lines. To help illustrate the effect the slope of the angular correlation function has on the results, we also show the LBG contribution when using a slope of (dashed green line).
We re-fit the data letting both parameters vary freely and found best fits in and within % of the above values. Because this type of test has a small dependence on choice of bin size, we use the fixed (Adelberger et al., 2005) result in our assessment of SSCpairs expectations. The consistency in pair distributions and parameter fits for both surveys illustrates the utility of using pair separations to describe the behaviour of LBGs on small scales.
The number of LBG close pairs predicted by the corrected angular correlation function provides a good match to the observed pairs on all scales down to the resolution of the images and becomes indistinguishable from the uncorrected LBG angular correlation function expectations at separations smaller than kpc. This agreement reiterates the negligible contribution of random projected pairs on small scales.
The widths of our spectroscopic slitlets are kpc. Inspecting Figure 7 at separations of kpc shows that the expectation from every functional fit to the data predicts that we should find close pairs serendipitously in our slitlets. From the fit of the corrected (and uncorrected) LBG angular correlation function, we find that both the expected number of SSCpairs and the expected distribution of SSCpair separations agree well with that of the observations (shown as the dashed histogram in Figure 7).
5 SERENDIPITOUS PAIR EXPECTATIONS FROM SIMULATION
We test the identification of the SSCpairs against the predictions of LCDM by analysing a high-resolution hybrid numerical/analytical cosmological simulation (Berrier et al., 2006). The full description of the simulation and the close pair analysis is presented in a companion paper, Berrier et al. (2009). Below we describe a few of the relevant specifics and results.
For large-scale structure, the simulation uses an adaptive refinement tree N-body code (Kravtsov et al., 1997) that follows the evolution of particles in a comoving box Mpc on a side. Numerical overmerging on small scales is overcome by incorporating the analytic method of Zentner et al. (2005) to trace the substructure. We sample the simulation at the time-step and use dark matter halos in the simulation that match the spatial correlation function of the form measured for the m LBG samples. We adopt the spatial correlation length (Cooke et al., 2006) using a fixed slope 444In Cooke et al. (2006) we use several methods to measure and test the correlation function parameters because of the inherent uncertainties in analysing LBGs. We choose the value we find most reliable for the 140 LBGs used here that is obtained from a maximum likelihood analysis holding fixed. for the C05 survey and and (Adelberger et al., 2005) for the S03 survey. We find that halos with km s-1 in the simulation yield a correlation length of and slope of . These halos correspond to a number density of Mpc-3, comoving, and halo mass () which are in very good agreement with the corrected volumetric density from the photometric sample and the mass inferred from clustering statistics (, Adelberger et al., 2003, 2005; Cooke et al., 2006).
The simulation is then analysed in a manner identical to the observations using (1) the constraints from the seeing FWHM and centroid accuracy from the images, (2) the MOS spectroscopic slitlet dimensions of our survey, (3) the spectral resolution, and (4) the uncertainties in determining the systemic LBG spectroscopic redshifts. We compute the number of pairs that fall in mock slitlets with random orientations that are resolvable in the images and that have velocity offsets that would be detectable in LRIS spectroscopy. We find an expected fraction of , or an average of LBGs ( pairs) that is to be compared to the fraction found from the analysis of this survey. This close agreement helps reinforce the interpretation that the SSCpairs are indeed close LBG pairs as a similar number are expected from LCDM to be found serendipitously in our survey. We find that the expected fraction of SSCpairs from the simulation is rather insensitive (changes by a few percent) to a variation of the LBG correlation parameters within the range of their uncertainties.
6 SERENDIPITOUS LY- EMITTERS
Ly emitters (LAEs) are defined here as objects displaying detectable Ly emission but have continua fainter than and therefore are not candidates for inclusion in the LBG spectroscopic sample. We discovered two serendipitous LAEs in the MOS slitlets of the full C05 LBG sample. This is approximately the number we would expect to fall serendipitously into our slitlets, when we consider (1) the depth of our spectroscopy, (2) the arcmin2 solid angle subtended by our slitlets, and (3) the LAE densities reported by Gawiser et al. (2007) and Grove et al. (2009) when assumed to be constant over the redshift path probed. The detected objects are LAE-228 at in field PC1643+4631A and LAE-475 at in the field BRI1013+0035. Figure 8 presents their 1-D and 2-D spectra. Both redshifts are measured from their Ly emission peaks and exhibit Ly EW of 48Å and 140Å, respectively.
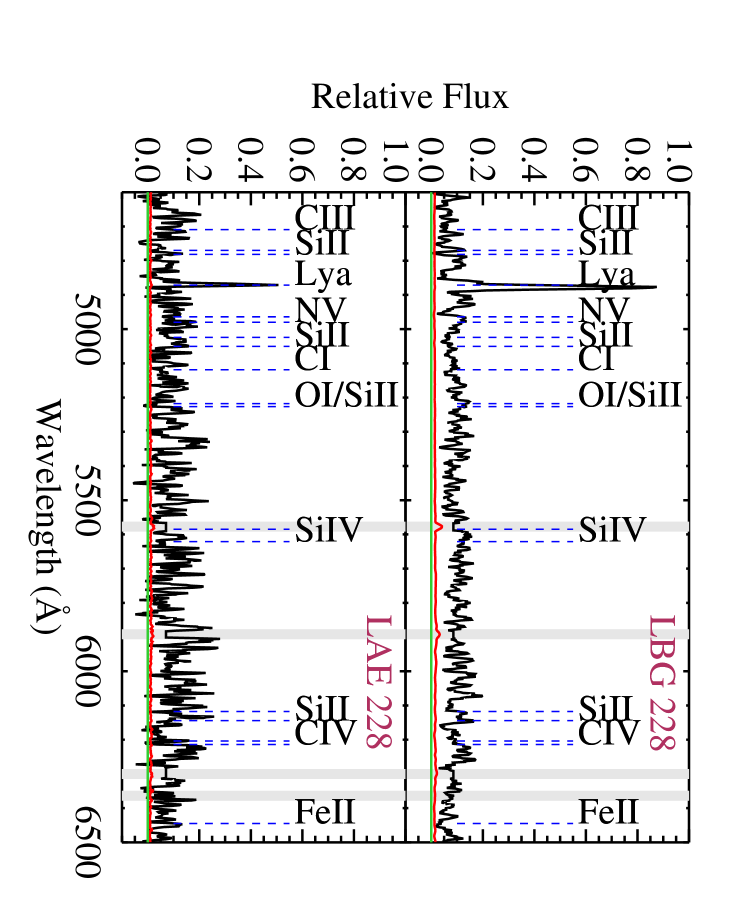
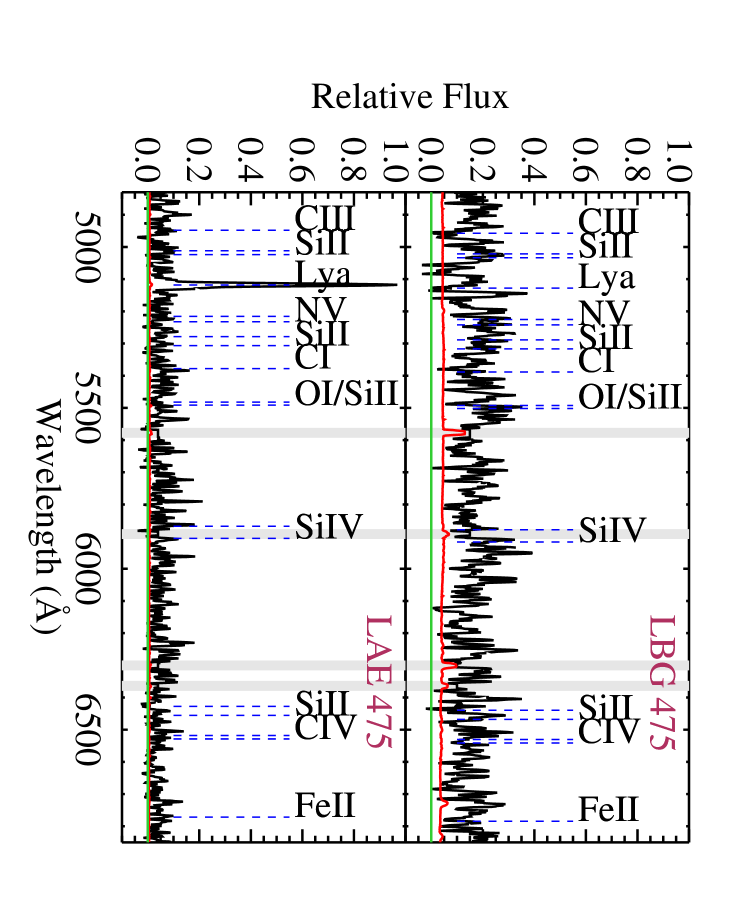


Interestingly, LAE-228 was found as a spectroscopic close pair to the spectroscopically confirmed LBG-228 with . The projected separation between the two systems is kpc and they exhibit a km s-1. In addition, LAE-475 was found near LBG-475 with having a projected separation of kpc and a Ly velocity offset of km s-1. Although both systems could be considered close pairs, neither is included in the analysis in this paper because the LAEs do not meet the m criterion and because LBG-475 is considered a “probable” LBG (category 4 in Cooke et al., 2006) from the lower S/N and quality of the spectral-line fit.
LAEs are believed to be systems with lower mass and lower star formation rates than that of the LBG population ( and yr-1; e.g., Gawiser et al., 2007) that are undergoing a recent star forming episode. The fact that the two LAEs detected are close pairs to one, and likely both, LBGs suggests that a fraction of the Ly emission, and therefore the detectability of LAEs, may result from interactions.
7 Ly emission and close pairs
In our analysis, we see dominant Ly in emission from all galaxies of the SSCpairs and a prevalence for dominant Ly emission for LBGs having close photometric companions (SSCpair candidates; see Figures 1 & 3). We consider the frequency of the appearance of Ly in emission for the SSCpairs and the SSCpair candidates. The fraction of eLBGs in our spectroscopic sample of 140 LBGs is . This fraction includes LBGs exhibiting purely emission with undetectable absorption, to those with a complex profile that show Ly absorption but have strong enough emission to result in net Ly emission EW. By our definition, the larger spectroscopic sample of S03 finds a comparable eLBG fraction of . We remark that the low S/N, low-resolution LBG continua and complex Ly features near zero net EW, where the peak of the EW distribution is located, may produce minor differences between the Shapley et al. (2003) analysis of the S03 data and ours. These differences may contribute toward the small discrepancy in the two eLBG/aLBG ratios, however, do not affect the results below for LBGs with kpc separations as none of these exhibit such Ly profiles. In the probability calculations below, we use the eLBG fraction from our survey exclusively. The eLBG fraction found by Shapley et al. (2003) analysis of the S03 data would result in lower probabilities.
The binomial probability of observing all 10 SSCpair galaxies with dominant Ly emission and zero galaxies with dominant Ly in absorption by chance is . The six spectroscopic LBG components of the SSCpair candidates all show dominant Ly in emission but were not included in the SSCpairs analysis because the bulk of the secondary component did not enter the slitlet (Figure 1 and Figure 3). Combined, the binomial probability that all 16 galaxies are eLBGs and zero are aLBGs is . If the emission of these systems was a result of star forming clumps or single LBGs, we would expect to observe an approximately equal fraction (or % for this survey) of regions that are dominated by Ly absorption and we observe none. As a reminder, systems exhibiting Ly absorption (aLBGs) were searched for thoroughly in the data (§3.2).
When examining the Ly features of spectroscopic LBGs having photometric companions that meet our colour criteria and have projected separations between kpc, with the caveat that some of these may not be physical pairs, we find eLBGs and aLBGs (). In addition, if we include all spectroscopically confirmed LBGs with photometric close pairs that have relaxed colour criteria (see C05) and that have projected separations between kpc (those with kpc are included in the SSCpair candidates), we find a total of eLBGs and aLBGs (). These two measurements suggest an overabundance of eLBGs and, combined with the abundance of Ly emission in the SSCpairs and SSCpair candidates, indicate an overabundance that diminishes with increasing radius. Figure 9 plots the number of eLBGs and aLBGs with photometric companions with separation. Finally, LBG-228 with close pair LAE-228 ( kpc) exhibits Ly in emission. The tentative LBG-475 with close pair LAE-475 ( kpc) shows weak evidence of complex Ly absorption and emission in the low S/N spectrum, but a proper EW analysis is not possible at this time.
We posit that the overabundance of eLBGs at small separations ( kpc) is caused, in part, by induced star formation and the dispersal of gas and dust related interactions. Object D3 in the sample of Shapley et al. (2003) provides further support in that both galaxies in the identified close pair ( kpc separation) exhibit dominant Ly emission. The extended Ly emission of D3, Ly blob nature, and potential fraction of escaping Lyman continuum photons reinforces this scenario. Finally, the trends of Ly emission with morphological parameters are consistent with a picture where a non-negligible fraction of LBGs produce double-peak Ly emission when merging their ground-based 1-D spectra as a result of triggered or more revealed Ly emission.
The statistics presented here can be quickly improved from the analysis of other similar existing and future datasets. Nevertheless, the Ly behaviour of the SSCpairs appears real. Such behaviour would suggest that although star formation is ubiquitous at high redshift, caused in part by the high gas fraction in most systems, and generates Ly emission, close pairs have additional Ly emission and UV flux as a result of an interaction. The enhanced Ly emission from interactions modifies the ratio of eLBGs and increases the fraction of detectable eLBGs for a given criteria whereas without an interaction they would remain either too faint or too red. Such behaviour would bias any colour-selection technique. Similarly, interactions may make LAEs detectable whereas without an interaction they would remain too faint to be detected from their continuum alone.

We find % of the galaxies in our spectroscopic sample identified as interacting pairs. If the higher fraction of Ly double-peak systems in the higher S/N, higher resolution sample of Shapley et al. (2006) prove to be interacting pairs, because both samples are serendipitous detections, the true fraction of interacting LBGs at may be %. If borne out, the double Ly emission/double morphology observable in ground-based data may provide a simple means to identify a significant fraction of interacting galaxies and help to constrain the merger rate at high redshift. The relationship between Ly emission and pair separation will be fully explored in a future paper. The evidence is presented here to establish a link between the presence of Ly in emission and the identification of interacting pairs.
In conclusion, the above picture and the observations of merged 1-D double Ly emission profiles in ground-based data as markers of this process are supported by: (1) the detection of Ly in emission from every component of the SSCpairs and the spectroscopic components of all six SSCpair candidates, (2) an indication of an overabundance of eLBGs in spectro-photometric kpc close pairs, (3) the trends of Ly emission EW with nucleation, colour, and separation (size/multiplicity) of Law et al. (2007), (4) the plausibility from Ly and ISM feature analysis that the double peak systems in the work of Shapley et al. (2006) are close and/or interacting pairs, (5) the fact that both galaxies in the identified close pair D3 exhibit Ly in emission and the identification of this system as an extended Ly blob, (6) the potential Lyman continuum escaping photons from D3 and double-peak Ly emission system C49, and (7) the detection of one, and potentially two, LAEs within kpc of spectroscopic LBGs in this survey.
8 SUMMARY
A systematic search of deep Keck imaging and spectroscopy of 140 LBGs in nine separate fields has uncovered five serendipitous
spectroscopic close pairs (SSCpairs) with separations of
kpc. Below, we summarise our findings and the implications of the
imaging and spectroscopic data from this survey, the photometric data
from the survey of S03, and the results from an analysis of a
carefully matched high-resolution cosmological hybrid simulation.
(1) We find evidence in the imaging and spectroscopic observations that the SSCpairs are two distinct and likely interacting systems.
-
1.
The SSCpairs exhibit two flux peaks with kpc projected separations in the broadband images. The VRI filters probe the continua of O and B stars at and the SSCpair components exhibit luminosities that are typical of LBGs. In addition, morphology of the SSCpairs is consistent with the expectations of low to intermediate redshift UVLGs projected to . UVLGs are in every way analogues to LBGs having similar mass, gas content, UV colours, metallicity, half-light radii, and star formation rates. Mergers/interactions are determined to be the main star-forming mechanism for UVLGs in the sample of O08.
-
2.
Each component of the SSCpairs exhibits detectable Ly emission and a corresponding 2-D continuum. The continua of the SSCpairs are closely spaced or overlapping. When merging the 1D spectra, each SSCpair shows a double-peak Ly emission profile which is therefore different in nature than those modeled for a static or expanding shell of gas driven by galactic-scale outflows. The Ly emission peaks and continua in the 2D spectra are spatially offset and exhibit a one-to-one spatial correspondence with continuum flux peaks in the images.
-
3.
The velocity offsets between the two Ly emission peaks of the SSCpairs (before and after angular separation corrections) are not representative of a random sampling of Ly offsets pulled from the LBG population if the two features are generated by two sources within single systems. Instead, the Ly offsets are in agreement with single Ly emission from two separate systems.
-
4.
We see evidence for two sets of ISM absorption lines (at a lower confidence level) in each merged SSCpairs spectrum having relative velocities inconsistent with the expectations of the general LBG population but consistent with two separate systems. In addition, the velocity differences between the Ly and ISM features assigned to each component of the SSCpairs, under the assumption that they are distinct systems, is consistent with typical LBG values.
-
5.
The high-S/N, higher-resolution LBG spectroscopic sample of Shapley et al. (2006) report that four of the nine eLBGs in their sample of 14 systems display double-peak Ly emission. Analysis of the reported values finds the data for the three double-peak systems and one identified double system to be consistent with the SSCpairs observations. Both samples show Ly and potential ISM offsets and Ly -ISM velocity differences that are less consistent with a single system and more consistent with typical values for two interacting galaxies.
-
6.
The morphology and Ly features of the SSCpairs are consistent with the reported relationships of Law et al. (2007) between space-based morphological parameters (Gini, multiplicity, size, and colour) and Ly emission EW of LBGs. An interpretation of the these relationships points to a picture where single and double-nuclei LBGs are Ly emitting LBGs, with a significant fraction being interacting systems.
(2) We examine the distribution of all close pairs in the data to determine the expectation of serendipitous pairs in our spectroscopic slitlets. We find that an angular correlation function of the form with slope provides an excellent fit to close pair counts for both surveys tested. The fit incorporates contamination by random interlopers determined from mock catalogues matched to the volume and behaviour of the data. The slope of the fit to the close pair counts is identical to, or in very close agreement with, the LBG values in the literature derived from angular and spatial clustering statistics. Extrapolation of the fit to below the resolution limit of the photometric data ( kpc) predicts the existence of SSCpairs with a similar number and separation distribution to that observed.
(3) We analyse a high-resolution cosmological hybrid numerical and analytical simulation to assess the expectation of the SSCpairs from the predictions of LCDM. We carefully matched the simulation to the number density, spatial correlation function, spectral and imaging resolutions of the data, and the dimensions of the slitlets. The analysis finds a prediction of pairs to fall serendipitously in the multi-object slitlets of our survey, in good agreement with the observations.
(4) We present two LAEs discovered serendipitously in the MOS spectroscopic slitlets which are expected from LAE densities at and the solid angle subtended by our slitlets. However, both LAEs are kpc close projected pairs to LBGs. We confirm one of the LAEs to lay at the redshift of a nearby LBG and is a bona-fide close pair ( kpc), whereas the second is only a probable close pair because of the low S/N of the LBG spectrum. In addition, the LBG in the bona-fide close pair exhibits Ly in emission.
(5) We uncover a relationship between Ly emission and pair separation. We find an overabundance of LBGs with separations of kpc exhibiting Ly in emission as compared to the full sample. Moreover, without exception, all galaxies in the SSCpairs and all SSCpair candidates ( kpc ) have dominant Ly emission.
The presence of Ly in all SSCpairs and SSCpairs candidates supports the interpretation that the SSCpairs are interacting LBGs under the assumption that interaction may disperse gas and dust and trigger observable star formation. Because of the close proximity of the galaxies in the data to each other, the double Ly emission/double morphology of the SSCpairs provides a useful and consistent diagnostic to help detect interacting close pairs from in similarly obtained existing and future optical ground-based data.
Acknowledgments
The authors are supported by the Center for Cosmology at the University of California, Irvine. J. C. gratefully acknowledges generous support by Gary McCue. The authors wish to recognise and acknowledge the very significant cultural role and reverence that the summit of Mauna Kea has always had within the indigenous Hawaiian community. We are most fortunate to have the opportunity to conduct observations from this mountain.
References
- Adelberger et al. (2003) Adelberger, K. L., Steidel, C. C., Shapley, A. E., & Pettini, M. 2003, ApJ, 584, 45
- Adelberger et al. (2005) Adelberger, K. L., Steidel, C. C., Pettini, M., Shapley, A. E., Reddy, N. A., & Erb, D. K. 2005, ApJ, 619, 697
- Barton et al. (2000) Barton, E. J., Geller, M. J., & Kenyon, S. J. 2000, ApJ, 530, 660
- Barton et al. (2003) Barton, E. J., Geller, M. J., & Kenyon, S. J. 2003, ApJ, 582, 668
- Berrier et al. (2006) Berrier, J. C., Bullock, J. S., Zentner, A. R., Guenther, H. D., Barton, E. J., Kravtsov, A. V., & Wechsler, R. H. 2006, ApJ, 652, 56
- Berrier et al. (2009) Berrier, J. C., Cooke, J., Bullock, J. S., Zentner, A. R., Guenther, H., Barton, E. J., 2009 ApJ, submitted
- Bertin & Arnouts (1996) Bertin, E. & Arnouts, S. 1996, A&AS, 117, 393
- Cooke et al. (2005) Cooke, J., Wolfe, A. M., Gawiser, E., & Prochaska, J. X. 2005, ApJ, 621, 596
- Cole et al. (2000) Cole, S., Lacey, C. G., Baugh, C. M., & Frenk, C. S. 2000, MNRAS, 319, 168
- Conselice et al. (2003) Conselice, C. J., Bershady, M. A., Dickinson, M., & Papovich, C. 2003, AJ, 126, 1183
- Cooke et al. (2006) Cooke, J., Wolfe, A. M., Prochaska, J. X., & Gawiser, E. 2006 ApJ, 652, 994
- Cooke et al. (2008) Cooke, J., Barton, E. J., Bullock, J. S., Stewart, K. R., & Wolfe, A. M. 2008, ApJL, 681, L57
- Erb et al. (2003) Erb, D. K., Shapley, A. E., Steidel, C. C., Pettini, M., Adelberger, K. L., Hunt, M. P., Moorwood, A. F. M., & Cuby, J.-G. 2003, ApJ, 591, 101
- Erb et al. (2006) Erb, D. K., Steidel, C. C., Shapley, A. E., Pettini, M., Reddy, N. A., & Adelberger, K. L. 2006, ApJ, 646, 107
- Ferguson et al. (2004) Ferguson, H. C., et al. 2004, ApJL, 600, L107
- Förster Schreiber et al. (2006) Förster Schreiber, N. M., et al. 2006, ApJ, 645, 1062
- Fukugita et al. (1996) Fukugita, M., Ichikawa, T., Gunn, J. E., Doi, M., Shimasaku, K., & Schneider, D. P. 1996, AJ, 111, 1748
- Gardner et al. (2000) Gardner, J. P., Brown, T. M., & Ferguson, H. C. 2000, ApJ, 542L, 79
- Gawiser et al. (2007) Gawiser, E., et al. 2007, ApJ, 671, 278
- Genzel et al. (2008) Genzel, R., et al. 2008, ApJ, 687, 59
- Grazian et al. (2007) Grazian, A., et al. 2007, A&A, 465, 393
- Grimes et al. (2007) Grimes, J. P., et al. 2007, ApJ, 668, 891
- Grove et al. (2009) Grove, L. F., Fynbo, J. P. U., Ledoux, C., Limousin, M., Møller, P., Nilsson, K. K., & Thomsen, B. 2009, A&A, 497, 689
- Heckman (2002) Heckman, T. M. 2002, Extragalactic Gas at Low Redshift, 254, 292
- Heckman et al. (2005) Heckman, T. M., et al. 2005, ApJL, 619, L35
- Kartaltepe et al. (2007) Kartaltepe, J. S., et al. 2007, ApJS, 172, 320
- Keel et al. (1985) Keel, W. C., Kennicutt, R. C., Jr., Hummel, E., & van der Hulst, J. M. 1985, AJ, 90, 708
- Kells et al. (1998) Kells, W., Dressler, A., Sivaramakrishnan, A., Carr, D., Koch, E., Epps, H., Hilyard, D., & Pardeilhan, G. 1998, PASP, 110, 1487
- Kravtsov et al. (1997) Kravtsov, A. V., Klypin, A. A., & Khokhlov, A. M. 1997, ApJS, 111, 73
- Lambdas et al. (2003) Lambas, D. G., Tissera, P. B., Sol Alonso, M., & Coldwell, G. 2003, MNRAS, 346, 1189
- Larson & Tinsley (1978) Larson, R. B., & Tinsley, B. M. 1978, ApJ, 219, 46
- Law et al. (2007) Law, D. R., Steidel, C. C., Erb, D. K., Pettini, M., Reddy, N. A., Shapley, A. E., Adelberger, K. L., & Simenc, D. J. 2007, ApJ, 656, 1
- Law et al. (2009) Law, D. R., Steidel, C. C., Erb, D. K., Larkin, J. E., Pettini, M., Shapley, A. E., & Wright, S. A. 2009, ApJ, 697, 2057
- Lin et al. (2004) Lin, L., et al. 2004, ApJL, 617, L9
- Lin et al. (2007) Lin, L., et al. 2007, ApJL, 660, L51
- Lin et al. (2008) Lin, L., et al. 2008, ApJ, 681, 232
- Lotz et al. (2006) Lotz, J., Madau, P., Giavalisco, M., Primack, J., & Ferguson, H. 2006, ApJ, 636, 592
- Marchesini et al. (2007) Marchesini, D., et al. 2007, ApJ, 656, 42
- Mas-Hesse et al. (2003) Mas-Hesse, J. M., Kunth, D., Tenorio-Tagle, G., Leitherer, C., Terlevich, R. J., & Terlevich, E. 2003, ApJ, 598, 858
- Matsuda et al. (2004) Matsuda, Y., et al. 2004, AJ, 128, 569
- Mihos & Hernquist (1996) Mihos, J. C., & Hernquist, L. 1996, ApJ, 464, 641
- McCarthy et al. (1998) McCarthy, J. K., et al. 1998, SPIE, 3355, 81
- Nikolic et al. (2004) Nikolic, B., Cullen, H., & Alexander, P. 2004, MNRAS, 355, 874
- Oke et al. (1995) Oke, J. B., Cohen, J. G., Carr, M., Cromer, J., Dingizian, A., Harris, F. H., Labrecque, S., Lucinio, R., Schaal, W., Epps, H., & Miller, J. 1995, PASP, 107, 375
- Overzier et al. (2008) Overzier, R. A., et al. 2008, ApJ, 677, 37
- Papovich et al. (2001) Papovich, C., Dickinson, M., & Ferguson, H. C. 2001, ApJ, 559, 620
- Patton et al. (2000) Patton, D. R., Carlberg, R. G., Marzke, R. O., Pritchet, C. J., da Costa, L. N., & Pellegrini, P. S. 2000, ApJ, 536, 153
- Patton et al. (2002) Patton, D. R., et al. 2002, ApJ, 565, 208
- Rafelski et al. (2009) Rafelski, M., Wolfe, A. M., Cooke, J., Chen, H.-W., Armandroff, T. E., Wirth, G. D. 2009, in preparation
- Reddy et al. (2005) Reddy, N. A., Erb, D. K., Steidel, C. C., Shapley, A. E., Adelberger, K. L., & Pettini, M. 2005, ApJ, 633, 748
- Scannapieco & Tissera (2003) Scannapieco, C., & Tissera, P. B. 2003, MNRAS, 338, 880
- Shapiro et al. (2008) Shapiro, K. L., et al. 2008, ApJ, 682, 231
- Shapley et al. (2001) Shapley, A. E., Steidel, C. C., Adelberger, K. L., Dickinson, M., Giavalisco, M., & Pettini, M. 2001, ApJ, 562, 95
- Shapley et al. (2003) Shapley, A. E., Steidel, C. C., Adelberger, K. L., & Pettini, M. 2003, ApJ, 588, 65
- Shapley et al. (2006) Shapley, A. E., Steidel, C. C., Pettini, M., Adelberger, K. L., & Erb, D. K. 2006, ApJ, 651, 688
- Steidel et al. (1996) Steidel, C. C., Giavalisco, M., Pettini, M., Dickinson, M., & Adelberger, K. L. 1996, ApJL, 462, L17
- Steidel et al. (2003) Steidel, C. C., Adelberger, K. L., Shapley, A. E., Pettini, M., Dickinson, M., & Giavalisco, M. 2003, ApJ, 592, 728
- Steinmetz & Navarro (2002) Steinmetz, M., & Navarro, J. F. 2002, New Astronomy, 7, 155
- Tenorio-Tagle et al. (1999) , Tenorio-Tagle, G., Silich, S. A., Kunth, D., et al. 1999, MNRAS, 309, 332
- Vanzella et al. (2008) Vanzella, E., et al. 2008, A&A, 487, 83
- Verhamme et al. (2006) Verhamme, A., Schaerer, D., & Maselli, A. 2006, A&A, 460, 397
- Verhamme et al. (2008) Verhamme, A., Schaerer, D., Atek, H., & Tapken, C. 2008, A&A, 491, 89
- Wright et al. (2009) Wright, S. A., Larkin, J. E., Law, D. R., Steidel, C. C., Shapley, A. E., & Erb, D. K. 2009, ApJ, 699, 421
- Zentner et al. (2005) Zentner, A. R., Berlind, A. A., Bullock, J. S., Kravtsov, A. V., & Weschler, R. H. 2005, ApJ, 624, 505