Structure and magnetic, thermal, and electronic transport properties of single crystal EuPd2Sb2
Abstract
Single crystals of EuPd2Sb2 have been grown from PdSb self-flux. The properties of the single crystals have been investigated by x-ray diffraction, magnetic susceptibility , magnetization , electrical resistivity , Hall coefficient , and heat capacity measurements versus temperature and magnetic field . Single crystal x-ray diffraction studies confirmed that EuPd2Sb2 crystallizes in the CaBe2Ge2-type structure. The measurements suggest antiferromagnetic ordering at 6.0 K with the easy axis or plane in the crystallographic plane. An additional transition occurs at 4.5 K that may be a spin reorientation transition. The data also show the two transitions at 6.1 K and 4.4 K, respectively, indicating the bulk nature of the transitions. The 4.4 K transition is suppressed below 1.8 K while the 6.1 K transition moves down to 3.3 K in T. The data show metallic behavior down to 1.8 K along with an anomaly at 5.5 K in zero field. The anomaly is suppressed to 2.7 K in an 8 T field. The measurements indicated that the dominant charge carriers are electrons. The isotherms show three field-induced transitions at 2.75 T, 3.90 T, and 4.2 T magnetic fields parallel to the plane at 1.8 K. No transitions are observed in for fields parallel to the axis.
I Introduction
The recent discovery of high-temperature superconductivity in FeAsO1-xFx ( = La, Ce, Pr, Nd, Sm, Gd, Tb, and Dy)kamihara ; chennature ; chen ; ren ; yang ; bos compounds with superconducting transition temperatures as high as 55 K has sparked a lot of interest in the search for new superconductors. These materials crystallize in the tetragonal ZrCuSiAs-type structure with space group .quebe The structure consists of alternating FeAs and O layers stacked along the crystallographic axis. The parent compounds FeAsO exhibit spin density wave (SDW) transitions at temperatures K.chen ; dong ; klauss Upon doping with F, the SDW is suppressed and superconductivity appears.chennature ; chen ; ren ; yang ; bos ; dong ; giovannetti
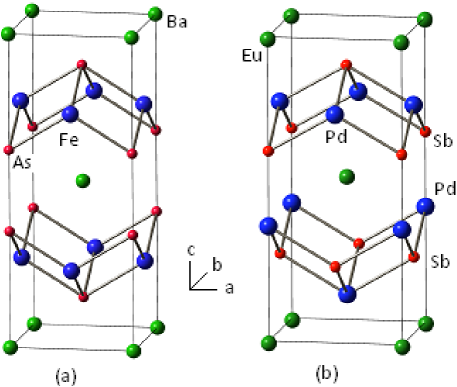
Another group of structurally related parent compounds with the chemical formula Fe2As2 ( = Ca, Sr, Ba, and Eu) was soon discovered to show superconductivity upon doping or application of pressure. These compounds crystallize in the tetragonal ThCr2Si2-type structure with space group (No. 139). The structure consists of alternating FeAs and layers stacked along the axis as shown in Fig. 1(a). In the FeAs layers, the Fe atoms form a square planar lattice. The Fe2As2 compounds also show SDW and structural transitions at high temperaturesrotter ; krellner ; ni ; yan ; ni2 ; ronning ; goldman ; tegel ; renprb ; jeevan which are suppressed by doping with K, Na, and Cs at the site and accompanied by the onset of superconductivity.rotterprl ; chen2 ; jeevan2 ; sasmal
In both classes of FeAsO1-xFx and Fe2As2 compounds described above, FeAs layers that are stacked along the axis are evidently a key building block yielding superconductors with relatively high . This gives a strong motivation to investigate similarly structured compounds in a search for additional high- superconductors.
The compound EuPd2Sb2 crystallizes in the CaBe2Ge2-type structure with space group (No. 129),hofmann as shown in Fig. 1(b). The structure is closely related to the Fe2As2 structure. Alternating PdSb and Eu layers are stacked along the axis, similar to the Fe2As2 structure. However, there is a distinct difference between the two structures. In half of the PdSb layers in the EuPd2Sb2 structure, the Pd atoms are arranged in a planar square lattice with two Sb layers on either side of each Pd layer, resulting in a tetrahedral coordination of Pd by Sb as in the FeAs-type layers. However, alternating with these layers are layers in which the Pd and Sb positions are switched, as shown in Fig. 1(b).
There have been reports of structural instabilities and antiferromagnetic ordering in some compounds forming in the CaBe2Ge2-type structure. UCu1.5Sn2 orders antiferromagnetically at 110 ∘C which is very high among uranium intermetallics.purwanto1996 CePd2Ga2 undergoes a tetragonal to monoclinic second order structural transition at 125 K and orders antiferromagnetically at 2.3 K.kitagawa1999 LaPd2Ga2 is superconducting below 1.9 K. kitagawa1999 Eu was reported to be in a mixed valent state between Eu+2 (spin ) and Eu+3 (spin ) in polycrystalline samples of EuPd2Sb2.hofmann In this paper, we report the synthesis and structure of single crystals of EuPd2Sb2 and their physical properties including magnetic susceptibility, magnetization, specific heat, and electronic transport measurements.
II Experimental Details
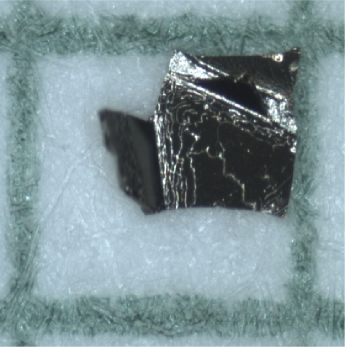
Single crystals of EuPd2Sb2 were grown using PdSb self-flux which melts at 805 ∘C. The Eu (99.999% pure) was obtained from the Ames Laboratory Materials Preparation Center. The Pd (99.95% pure) and Sb (99.999% pure) were obtained from Alfa-Aesar. Pd and Sb powders were thoroughly mixed inside a helium-filled glove box, and then poured on top of a chunk of Eu ( 0.1 g) that was placed at the bottom of a 2 mL alumina crucible. The elements were in the atomic ratio Eu:Pd:Sb = 1:5:5. The top of the crucible was packed with quartz wool. The crucible was then sealed in a quartz tube under vacuum and was placed vertically in a box furnace and heated to 1000 ∘C at a rate of 76 ∘C/h and held there for 6 h. The tube was then cooled to 850 ∘C at the rate of 1.5 ∘C/h and at this temperature the tube was removed from the oven and centrifuged to partially separate the flux from the crystals. A single conglomerated chunk (about 0.4 g) was found in the crucible after removing the quartz wool. Plate-like gold-colored crystals were isolated mechanically. The largest crystals had dimensions 220.1 mm3. The crystals are brittle and are easily broken into smaller pieces. Figure 2 shows an as-grown crystal on a mm grid.
Single crystal x-ray diffraction measurements were done using a Bruker CCD-1000 diffractometer with Mo Kα ( = 0.71073 Å) radiation. Magnetic measurements on the crystals were carried out using a Quantum Design superconducting quantum interference device (SQUID) magnetometer in the temperature range 1.8–350 K and magnetic field range 0–5.5 T. Heat capacity, electrical resistivity, and Hall coefficient measurements were done using a Quantum Design physical property measurement system (PPMS). For the heat capacity measurements, Apiezon N grease was used for thermal coupling between a sample and the sample platform. The heat capacity was measured in the temperature range 1.8–300 K in = 0, 2, 5, 7, and 9 T. For electrical resistivity and Hall coefficient measurements, platinum leads were attached to the crystals using silver epoxy. Electrical resistivity measurements were carried out using the standard AC four probe method with 10 mA excitation current in the temperature range 1.8–300 K and magnetic field range 0–8 T. Hall coefficient measurements were carried out using the five-wire configuration supported by the PPMS ACTppms option with 100 mA excitation current in the temperature range 1.8–310 K and magnetic field range 0–8 T. The Hall voltage was computed at each temperature from the odd part of the measured transverse voltage upon reversing the sign of the applied magnetic field. The even part was much smaller than the odd part at each measured temperature.
III Results
III.1 Structure and chemical composition determination
| Crystal system/Space group | Tetragonal, |
|---|---|
| Unit cell parameters | = 4.653(2) Å |
| = 10.627(4) Å | |
| Unit cell volume | 230.1(3) Å3 |
| (formula units/unit cell) | 2 |
| Density (Calculated) | 8.779 Mg/m3 |
| Absorption coefficient | 32.47 mm-1 |
| (000) | 514 |
| Goodness-of-fit on 2 | 1.235 |
| Final indices [ 2()] | R1 = 0.0737 |
| wR2 = 0.02506 | |
| Extinction coefficient | 0.033(9) mm-1 |
| (eq) | ||||
|---|---|---|---|---|
| Eu | 2500 | 2500 | 2425(1) | 13(1) |
| Pd(1) | 7500 | 2500 | 0 | 16(1) |
| Pd(2) | 2500 | 2500 | 6292(2) | 17(1) |
| Sb(1) | 7500 | 2500 | 5000 | 13(1) |
| Sb(2) | 2500 | 2500 | 8738(1) | 14(1) |
A well-shaped crystal with dimensions was selected for single crystal x-ray diffraction at 173 K. X-ray structure determination and refinement were performed using the SHELXTL software package.shelxtl The refined unit cell parameters, the isotropic thermal parameters, and the atomic positions are listed in Tables 1 and 2. Our results confirm that EuPd2Sb2 crystallizes in the CaBe2Ge2 structure.hofmann The unit cell dimensions and the atomic positions are similar to those found from single crystal x-ray diffraction measurements at room temperature in Ref. hofmann, , which were = 4.629(1) Å, = 10.568(2) Å, Eu: = 0.2424(1); Pd(2): = 0.6284(2); Sb(2): = 0.8745(1). The significant difference between the lattice parameters in Ref. hofmann, and lattice parameters obtained by us suggests a difference in crystal stoichiometry between the samples in Ref. hofmann, and ours, although both studies indicate nearly stoichiometric compositions. The temperature difference between the two studies cannot be responsible, since the lattice parameter differences are opposite to expectation in that case.
The stoichiometry of a representative crystal was checked by semiquantitative energy-dispersive x-ray (EDX) microanalysis. The results gave the following composition: Eu, 24.9 1.1 wt; Pd, 35.5 0.8 wt; Sb, 39.7 1.0 wt. These values are consistent with the values calculated for the composition EuPd2Sb2: Eu, 24.98 wt; Pd, 34.98 wt; Sb, 40.03 wt.
III.2 Magnetic measurements
III.2.1 Magnetic susceptibility measurements
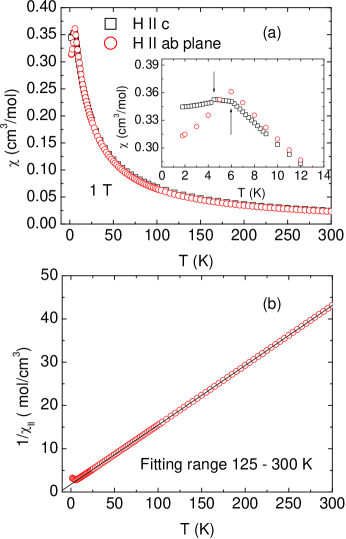
Figure 3(a) shows the magnetic susceptibility of EuPd2Sb2 versus temperature with the magnetic field parallel to the crystallographic axis () and to the plane (), respectively. At high-, the shows nearly isotropic paramagnetic behavior. Figure 3(b) shows the inverse susceptibility for versus . An excellent fit to the data in the range 125 – 300 K was obtained using the Curie-Weiss behavior
| (1) |
where is the -independent susceptibility, is the Curie constant, and is the Weiss temperature. The values of the parameters obtained from the fit are cm3 K/mol, K, and cm3/mol. Keeping fixed to zero, the Curie-Weiss fits to the 1/ data in the different temperature ranges between 25–300 K and 200–300 K yielded = 7.23(3) cm3 K/mol and K. The obtained Curie constants are significantly lower than the value cm3 K/mol expected for Eu+2 (spin ) with -factor . This indicates that Eu is in an intermediate valent state Eu+2.07 as previously suggested in Ref. hofmann, . The negative Weiss temperature indicates dominant antiferromagnetic interactions between the nearest-neighbor Eu spins.
At low temperatures, becomes almost -independent below 6.0 K with a cusp at K as shown in the inset of Fig. 3(a). shows a peak at 6.0 K and decreases monotonically at lower . The data suggest antiferromagnetic ordering of the Eu spins at 6.0 K with the easy axis or plane within the plane, with a possible spin reorientation transition at 4.5 K.
III.2.2 Magnetization versus applied magnetic field isotherm measurements

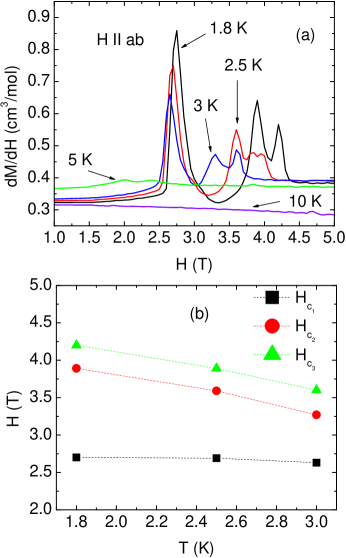
Figure 4 shows the magnetization of EuPd2Sb2 versus magnetic field with parallel to the crystallographic axis (right-hand panels) and to the plane (left-hand panels), respectively. For , anomalies in are clearly visible for K. Above 10 K, is proportional to . To illustrate the anomalies more clearly, Fig. 5(a) shows the derivative versus with . The data for show three peaks at T, T, and T, respectively, at 1.8 K. The temperature dependences of the fields at which these field-induced transitions occur are shown in Fig. 5(b). The transition fields are seen to decrease with increasing , and disappear between 5 and 10 K. At 1.8 K in = 5.5 T, the value of in Fig. 4 is 3.8 /f.u. This value is much less than the expected Eu+2 saturation moment of 7 . This difference suggests that the metamagnetic transitions take place between different antiferromagnetic states. In contrast, is proportional to at all . Qualitatively similar observations were previously reported for single crystals of EuRh2As2.singh2009
III.3 Heat capacity measurements
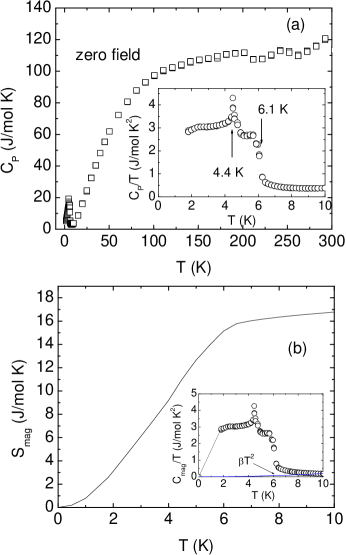

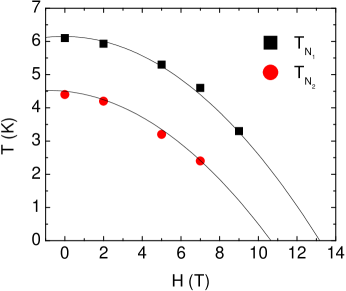
Figure 6(a) shows the heat capacity of a 2.619 mg EuPd2Sb2 crystal versus temperature in zero magnetic field. The inset of Fig. 6(a) shows versus for K. Two anomalies are observed at 6.1 K and 4.4 K, respectively, indicating that the transitions observed in in the inset of Fig. 3(a) at similar temperatures are bulk long-range magnetic ordering transitions. The data at high K approach the Dulong-Petit classical lattice heat capacity value of 15 J/mol K, where is the molar gas constant.
Figure 6(b) shows the calculated magnetic entropy versus at low temperatures K, where is the magnetic contribution and is the lattice contribution to the specific heat. We assumed = for K with mJ/mol K4 obtained for BaRh2As2 from Ref. singh2008, . A linear extrapolation to zero of , as shown by the dotted straight line in the inset of Fig. 6(b), was assumed in order to approximate the missing data between 0 K and 1.8 K. The magnetic entropy J/mol K at 10 K is close to the expected entropy = 17.3 J/mol K due to ordering of one spin per formula unit.
Figures 7(a)–(e) show in different magnetic fields parallel to the crystallographic axis. For T, shows a jump at K and then a cusp at K. The shapes of the anomalies at the two transitions are thus distinctly different. As is increased, decreases below 1.8 K at 9 T, while the goes down to 3.2 K in 9 T. The transition at remains sharp while the transition at broadens for T. Figure 8 shows plots of and versus .
III.4 Electronic transport measurements
III.4.1 Electrical resistivity measurements
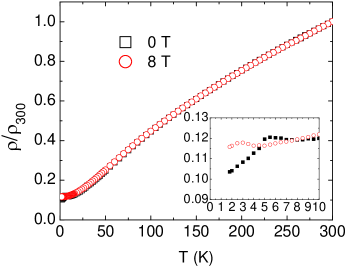
Figure 9 shows the electrical resistance ratio / of EuPd2Sb2 for current parallel to the -plane versus temperature in 0 and 8 T magnetic fields parallel to the axis, where is the resistance at temperature and cm is the resistance at 300 K. The large fractional uncertainty in arises due to the uncertainty in the geometric factor for the irregularly-shaped crystal. The inset shows the low- region below 10 K. The resistance data exhibit metallic behavior down to the lowest temperature. The residual resistance ratio . This value is comparable to the values found in the -plane resistivity for single crystals of other layered pnictides.rotter ; krellner ; renprb ; ni2 From the inset of Fig. 9, in zero magnetic field shows an anomaly at 5.4 K which gets suppressed to 2.9 K in T. The anomaly is evidently due to the antiferromagnetic ordering at K as observed from the and measurements.
III.4.2 Hall coefficient measurements
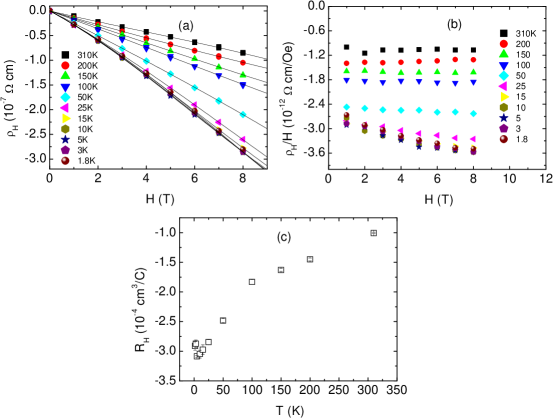
Figure 10(a) shows the Hall resistivity versus where is the measured Hall voltage, is the cross sectional area of the sample, is the separation of the transverse voltage leads, and is the longitudinal current. In Fig. 10(a), versus magnetic field is seen to deviate from a proportional behavior below 100 K. This behavior is more clearly seen in the plot of / versus in Fig. 10(b). The measured data were fitted by the function , as shown by the solid curves in Fig. 10(a), and (the coefficient of the linear term) is the Hall coefficient . versus is shown in Fig. 10(c), where becomes more negative by a factor of 3 on cooling from 310 K to 2 K. The temperature dependence is very similar to of BaRh2As2 (Ref. singh2008, ) which crystallizes in the tetragonal ThCr2Si2-type structure. The consistently negative indicates that the dominant charge carriers are electrons. If one uses a single band model, one obtains a conduction electron concentration and 3 (f.u.)-1 at 310 K and 2 K, respectively.
IV Summary and discussion
We have synthesized single crystals of EuPd2Sb2 and characterized them using single crystal x-ray diffraction, anisotropic magnetic susceptibility and magnetization, specific heat, electrical resistivity, and Hall coefficient measurements. The magnetic susceptibility indicates antiferromagnetic ordering at 6.0 K with an easy axis or plane within the crystallographic plane followed by another transition at 4.5 K. The transitions are also observed in heat capacity measurements indicating their bulk nature. The transition at 4.5 K is suppressed below 1.8 K in a magnetic field of 8 T as observed from the heat capacity and electrical resistivity measurements. The transition at 6 K is pushed down to 3.5 K in a field of 8 T. isotherms show three field-induced transitions at 2.75 T, 3.90 T, and 4.2 T for magnetic fields parallel to the plane at 1.8 K. No transitions are observed for fields parallel to the axis. The Hall coefficient is consistently negative from 1.8 to 310 K indicating electrons as the dominant charge carriers.
| Compound | Structure-type | (Å) | (Å) | (K) | (/f.u.) | Ref. |
|---|---|---|---|---|---|---|
| EuFe2As2 | ThCr2Si2 | 3.9104 | 12.1362 | 20 | 7.79 | renprb, |
| EuRh2As2 | ThCr2Si2 | 4.075 | 11.295 | 47 | singh2009, | |
| EuNi2As2 | ThCr2Si2 | 4.0964 | 10.029 | 14 | bauer2008, | |
| EuPd2Sb2 | CaBe2Ge2 | 4.653 | 10.627 | 6.1 | 7.65 | This work |
A comparison of structural and magnetic parameters of EuPd2Sb2 with those of some Eu compounds which form in the related ThCr2Si2-type structure is given in Table 3. Of the compounds listed in Table 3, only EuFe2As2 shows superconducting behavior under pressureterashima2009 as well as under doping at the Eu site.jeevan2 for EuPd2Sb2 with Å and a ratio of 2.28 is 6.1 K compared to 20 K for EuFe2As2 which has a smaller Å and a much larger = 3.10. Thus the significant difference in values is probably due at least in part to these structural differences. In Eu0.5K0.5Fe2As2 which is superconducting below 32 K, however, AF ordering of the Eu spins still takes place below 10 K. The calculated effective moment of the Eu spins in EuPd2Sb2 is close to that of Eu spins in EuFe2As2. The Hall coefficient of EuPd2Sb2 remains negative between 1.8 – 300 K like that in the superconducting Ba(Fe1-xCox)2As2 and Ba(Fe1-xCux)2As2.mun2009 However, in EuFe2As2, the Hall coefficient changes sign from negative to positive at K. At 300 K, in EuFe2As2,renprb which suggests that the charge carriers comprise both electrons and holes. Probably, the magnetic nature of the FeAs layers in EuFe2As2 is an important factor behind the superconducting behavior at high pressures and low temperatures. It will be very interesting to grow single crystals of EuPd2-xFexSb2 and study their physical properties. The Fe-doping at the Pd site will eventually make the Pd(Fe)-Sb layers structurally similar to the FeAs layers in EuFe2As2.
Acknowledgements.
Work at the Ames Laboratory was supported by the Department of Energy-Basic Energy Sciences under Contract No. DE-AC02-07CH11358.References
- (1) Y. Kamihara, T. Watanabe, M. Hirano, and H. Hosono, J. Am. Chem. Soc. 130, 3296 (2008).
- (2) X. H. Chen, T. Wu, G. Wu, R. H. Liu, H. Chen, and D. F. Fang, Nature (London) 453, 761 (2008).
- (3) G. F. Chen, Z. Li, D. Wu, G. Li, W. Z. Hu, J. Dong, P. Zheng, J. L. Luo, and N. L. Wang, Phys. Rev. Lett. 100, 247002 (2008).
- (4) Z.-A. Ren, J. Yang, W. Lu, W. Yi, X.-L. Shen, Z.-C. Li, G.-C. Che, X.-L. Dong, L.-L. Sun, F. Zhou, and Z.-X. Zhao, Europhys. Lett. 82, 57002 (2008).
- (5) J. Yang, Z.-C. Li, W. Lu, W. Yi, X.-L. Shen, Z.-A. Ren, G.-C. Che, X.-L. Dong, L.-L. Sun, F. Zhou, and X. Zhao, Supercond. Sci. Technol. 21, 082001 (2008).
- (6) J.-W. G. Bos, G. B. S. Penny, J. A. Rodgers, D. A. Sokolov, A. D. Huxley, and J. P. Attfield, Chem. Commun., 3634 (2008).
- (7) P. Quebe, L. J. Terbuchte, and W. Jeitschko, J. Alloys Compd. 302, 70 (2000).
- (8) J. Dong, H. J. Zhang, G. Xu, Z. Li, G. Li, W. Z. Hu, D. Wu, G. F. Chen, X. Dai, J. L. Luo, Z. Fang, and N. L. Wang, Europhys. Lett. 83, 27006 (2008).
- (9) H.-H. Klauss, H. Luetkens, R. Klingeler, C. Hess, F. J. Litterst, M. Kraken, M. M. Korshunov, I. Eremin, S.-L. Drechsler, R. Khasanov, A. Amato, J. Hamann-Borrero, N. Leps, A. Kondrat, G. Behr, J. Werner, and B. Büchner, Phys. Rev. Lett. 101, 077005 (2008).
- (10) G. Giovannetti, S. Kumar, and J. van den Brink, Physica B 403, 3653 (2008).
- (11) M. Rotter, M. Tegel, D. Johrendt, I. Schellenberg, W. Hermes, and R. Pöttgen, Phys. Rev. B 78, 020503(R) (2008).
- (12) C. Krellner, N. Caroca-Canales, A. Jesche, H. Rosner, A. Ormeci, and C. Geibel, Phys. Rev. B 78, 100504(R) (2008).
- (13) N. Ni, S. L. Bud’ko, A. Kreyssig, S. Nandi, G. E. Rustan, A. I. Goldman, S. Gupta, J. D. Corbett, A. Kracher, and P. C. Canfield, Phys. Rev. B 78, 014507 (2008).
- (14) J.-Q. Yan, A. Kreyssig, S. Nandi, N. Ni, S. L. Bud’ko, A. Kracher, R. J. McQueeney, R. W. McCallum, T. A. Lograsso, A. I. Goldman, and P. C. Canfield, Phys. Rev. B 78, 024516 (2008).
- (15) N. Ni, S. Nandi, A. Kreyssig, A. I. Goldman, E. D. Mun, S. L. Bud’ko, and P. C. Canfield, Phys. Rev. B 78, 014523 (2008).
- (16) F. Ronning, T. Klimczuk, E. D. Bauer, H. Volz, and J. D. Thompson, J. Phys.: Condens. Matter 20, 322201 (2008).
- (17) A. I. Goldman, D. N. Argyriou, B. Ouladdiaf, T. Chatterji, A. Kreyssig, S. Nandi, N. Ni, S. L. Bud’ko, P. C. Canfield, and R. J. McQueeney, Phys. Rev. B 78, 100506(R) (2008).
- (18) M. Tegel, M. Rotter, V. Weiss, F. M. Schappacher, R. Pöttgen, and D. Johrendt, arXiv:0806.4782 unpublished.
- (19) Z. Ren, Z. Zhu, S. Jiang, X. Xu, Q. Tao, C. Wang, C. Feng, G. Cao, and Z. Xu, Phys. Rev. B 78, 052501 (2008).
- (20) H. S. Jeevan, Z. Hossain, D. Kasinathan, H. Rosner, C. Geibel, and P. Gegenwart, Phys. Rev. B 78, 052502 (2008).
- (21) M. Rotter, M. Tegel, and D. Johrendt, Phys. Rev. Lett. 101, 107006 (2008).
- (22) G. F. Chen, Z. Li, G. Li, W. Z. Hu, J. Dong, X. D. Zhang, P. Zheng, N. L. Wang, and J. L. Luo, Chin. Phys. Lett. 25, 3403 (2008).
- (23) H. S. Jeevan, Z. Hossain, D. Kasinathan, H. Rosner, C. Geibel, and P. Gegenwart, Phys. Rev. B 78, 092406 (2008).
- (24) K. Sasmal, B. Lv, B. Lorenz, A. M. Guloy, F. Chen, Y. Y. Xue, and C. W. Chu, Phys. Rev. Lett. 101, 107007 (2008).
- (25) W. K. Hofmann and W. Jeitschko, Monatsh. Chem. 116, 569 (1985).
- (26) A. Puwanto, R. A. Robinson, and H. Nakotte, J. Appl. Phys. 79, 6411 (1996).
- (27) J. Kitagawa and M. Ishikawa, J. Phys. Soc. Jpn. 68, 2380 (1999).
- (28) Quantum Design Physical Property Measurement System Manual.
- (29) All software and sources of the scattering factors are contained in the SHELXTL (version 5.1) program library (G. Sheldrick, Bruker Analytical X-Ray Systems, Madison, WI).
- (30) Y. Singh, Y. Lee, B. N. Harmon, and D. C. Johnston, Phys. Rev. B 79, 220401(R) (2009).
- (31) Y. Singh, Y. Lee, S. Nandi, A. Kreyssig, A. Ellern, S. Das, R. Nath, B. N. Harmon, A. I. Goldman, and D. C. Johnston, Phys. Rev. B 78, 104512 (2008).
- (32) T. Terashima, M. Kimata, H. Satsukawa, A. Harada, K. Hazama, S. Uji, H. S. Suzuki, T. Matsumoto, and K. Murata, J. Phys. Soc. Jpn. 78, 083701 (2008).
- (33) E. D. Mun, S. L. Bud’ko, Ni Ni, A. N. Thaler, and P. C. Canfield, Phys. Rev. B 80, 054517 (2009).
- (34) E. D. Bauer, F. Ronning, B. L. Scott, and J. D. Thompson, Phys. Rev B 78, 172504 (2008).