Spectroscopy of 1.55 m PbS Quantum Dots on Si Photonic Crystal Cavities with a Fiber Taper Waveguide
Abstract
We use an optical fiber taper waveguide to probe PbS quantum dots (QDs) dried on Si photonic crystal cavities near 1.55 m. We demonstrate that a low density (m-2) of QDs does not significantly degrade cavity quality factors as high as 3. We also show that the tapered fiber can be used to excite the QDs and collect the subsequent cavity-filtered photoluminescence, and present measurements of reversible photodarkening and QD saturation. This method represents an important step towards spectroscopy of single colloidal QDs in the telecommunications band.
pacs:
78.67.Hc, 42.70.Qs, 42.60.DaThe combination of low optical absorption and mature device processing has resulted in the development of low loss silicon photonic devices such as high quality factor () photonic crystal cavities (PCCs) operating in the technologically relevant 1.55 m wavelength range Akahane et al. (2003); Srinivasan et al. (2004); Song et al. (2005). Silicon’s indirect bandgap represents a challenge in making light-emitting devices and as a result there has been considerable interest in developing hybrid systems integrating a light-emitting material Polman (1997); Park et al. (2005). Lead salt colloidal quantum dots Wise (2000); Talapin and Murray (2005) (QDs) represent one such approach. In addition, their atomic-like properties suggest the potential for Si-based quantum information processing in the single QD limit. In this work, we use colloidal PbS QDs as the active material to interact with Si PCCs with resonances near 1.55 m. Due to the long radiative lifetime ( ns Sargent (2004); Rakher et al. (2009)) and small radiative efficiency of these dried QDs ( Steckel et al. (2003); Sargent (2004)), as well as challenges associated with measuring low light levels with InGaAs detectors Ribordy et al. (2004), it is of the utmost importance to collect as many emitted photons as possible. Previous studies of PbS/PbSe QDs coupled to Si microcavities Fushman et al. (2005); Bose et al. (2007); Wu et al. (2007); Pattantyus-Abraham et al. (2009) have relied on free-space micro-photoluminescence methods to pump and collect the emission from moderately high- cavities (), and have generally operated at relatively high QD densities, or else have sacrificed spectral resolution to achieve the count rates needed to operate at a lower QD density Bose et al. (2009). In this work, we use an optical fiber taper waveguide Spillane et al. (2003); Srinivasan et al. (2004); Hwang et al. (2005) to couple to the modes of high- PCCs (), thereby allowing for an efficient out-coupling mechanism for PbS QD emission. We measure photoluminescence from a low density (m-2) of spun QDs and show that the does not degrade due to QD absorption up to . We also measure photodarkening and saturation of the QD emission into the cavity mode. This approach may enable the future interrogation of cavity quantum electrodynamics (cQED) in the PbS/Si system, in much the same way as has been demonstrated for epitaxial III-V QDs Srinivasan and Painter (2007).
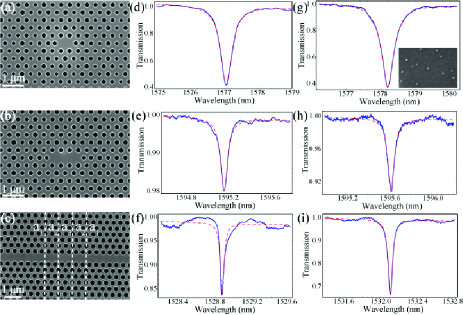
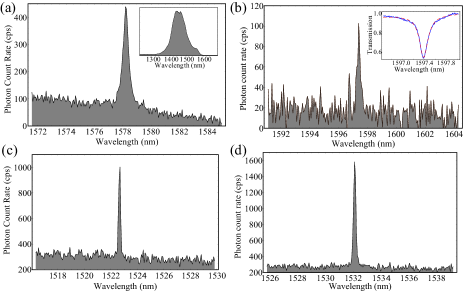
The PbS QDs Srinivasan and Painter (2007) are chemically synthesized Hines and Scholes (2003) and suspended in chloroform. As shown in the inset of Fig. 2(a), the emission is centered near 1460 nm with a width of 100 nm due to a combination of size inhomogeneities and a large homogeneous linewidth at room temperature. The solution is further diluted with chloroform in a 1:200 mixture. Approximately 20 L is spin-coated directly onto the substrate containing PCCs, yielding an areal density of m-2 (inset Fig. 1(g)) as measured by a scanning electron microscope (SEM). The PCCs measured (Fig. 1(a)-(c)) are the well-developed H1 Painter et al. (1999), L3 Akahane et al. (2003), and multi-heterostructure (MH) cavities Song et al. (2005), and have been fabricated in a 250 nm thick Si device layer using standard silicon-on-insulator fabrication methods. The devices are probed using an optical fiber taper waveguide, which can be used to measure the spectral response of the devices in transmission as well to collect photoluminescence (PL).
Transmission measurements follow the approach of Ref. Srinivasan et al., 2004, where light from a swept wavelength external cavity diode laser (1520 nm to 1630 nm) is sent through a variable optical attenuator and polarization controller before it is directed through the tapered optical fiber to an InGaAs photodiode. The taper and sample separation is controlled via and stepper stages with 50 nm resolution, and the system is imaged under a 50X microscope objective. The measurement setup rests in a -rich environment at room temperature to prevent irreversible photoxidation of the QDs Peterson and Krauss (2006) and taper degradation.
This technique enables resonant spectroscopy of the cavity with and without the active material. In this way, we measured the cavity , before and after addition of the PbS QDs. Figure 1(d)-(f) shows a cavity resonance of the H1, L3, and MH in transmission without QDs. The estimated (with waveguide coupling loss removedBarclay et al. (2005); Spillane et al. (2003)) values are 4900, 19 800, and 30 100 respectively. Figure 1(g)-(i) shows the cavity’s response in transmission with QDs with corresponding 4500, 23 200, and 29 500. For these low QD densities, the variation in the extracted s due to differences in taper position is greater than the loss induced by QD absorption, at least up to . The ability to maintain high- in the presence of the QDs is promising for a number of potential applications, such as single QD cQED and low-threshold microcavity lasers.
For PL measurements, a 980 nm diode laser is coupled through a variable optical attenuator into the fiber taper, which is brought into contact with the devices. The transmitted signal is then directed through a long pass 1064 nm filter and into a grating spectrometer coupled with a liquid cooled InGaAs array. Spectra are recorded with a 180 s integration time under a typical excitation power of 100 W. PL spectra from each cavity are shown in Fig. 2, including another mode in the MH cavity that did not appear in transmission (Fig. 2(c)). The factors observed in PL are consistent with those seen in transmission measurements, though our spectral resolution is limited to 0.09 nm. We note that the cavity modes operate on the long wavelength tail-end of the QD distribution, as seen in the reference PL spectrum shown in the inset of Fig. 2(a) for an ensemble of QDs not in a cavity. This suggests the number of QDs interacting with the cavity modes may be significantly reduced with respect to the number that physically reside in the cavity, though a measurement of the QD homogeneous linewidth is needed to confirm this.
Using the transmission measurements in Fig. 1, we can estimate the efficiency with which a cavity photon out-couples into the fiber taper. A QD’s out-coupling efficiency would then be the product of with the fraction of QD radiation into the cavity mode. is estimated Barclay et al. (2005); Spillane et al. (2003) from the on-resonance transmission level as when the system is in the under-coupled regime and represents collection in transmission. For the H1 cavity in Fig. 1(g), so that . A similar efficiency (, ) has been measured when the taper is in contact with the L3 cavity (inset of Fig. 2(b)), while coupling to the MH cavity as shown in Fig. 1(i) yields a somewhat smaller value (, ); fluctuations in the detected signal result in uncertainties in of . These results generally compare favorably to calculated free-space collection efficiencies of using high numerical aperture objectivesTran et al. (2009), with the added advantage of direct collection into a single mode optical fiber.
Our experimental configuration also enabled measurement of photodarkening behavior previously observed in PbS QDs Peterson and Krauss (2006). In this case, PL from the MH cavity is directed through long pass filters at 1064 nm and 1400 nm and detected at an InGaAs single photon counting module (SPCM)Ribordy et al. (2004) with 2.5 ns gate width, 20 detection efficency, and 5 s dead time. As shown in Fig. 3(a), the PL is monitored continuously with a 0.6 s integration time while the 980 nm excitation source is turned on (WW) and off. The PL clearly decays with time and requires an off time of at least 150 s to completely recover. This kind of photodarkening has been attributed to an average of single particle blinking where the overall ensemble PL decreases with time due to increasing numbers of emitters transitioning to a long-lived dark state Chung and Bawendi (2004); Pelton et al. (2004); Tang and Marcus (2005). Fig. 3(b) shows a normalized photodarkening trace taken under the same excitation conditions as (a). The data has been fit with a stretched exponential Tang and Marcus (2005), , yielding fit parameters with 95 confidence intervals , , and . While the fit parameters and are consistent with literature Tang and Marcus (2005), the actual physical parameters associated with QD blinking can only be determined with further single QD measurements beyond the scope of this work. However, is directly related to the ratio of average time spent in the dark state to the bright state, which for our QDs computes to a value of . Short-timescale photodarkening and the difficulties associated with detection at 1.55 m make low density QD measurements that much more challenging.
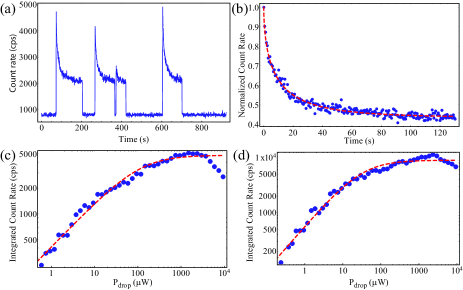
The final experiment we performed was a saturation spectroscopy measurement of the two modes of the MH cavity. In this measurement, a PL spectrum was recorded (60 s integration) as the dropped excitation power was increased over more than four decades. To avoid photodarkening effects, the excitation was blocked for 30 s after each measurement and the spectrum was taken only after the excitation had been on for 30 s. Two lorentzians were fit to each spectrum and the integrated count rate under each peak is plotted as a function of dropped power in Fig. 3(c),(d). Each of these curves was fit to a two-level saturation with an adjustable power dependence, . Interestingly, the saturation curves display a clear sub-linear dependence on the dropped power below saturation. The mode at 1522.7 nm (1532.1 nm) fits to a value of (). This sub-linear dependence could be symptomatic of the trapped states associated with blinking Babentsov et al. (2005). The saturation curves are truncated due to heating in the tapered fiber and in the Si at excitation powers near 2 mW as evidenced by few nm redshifts of the cavity modes. Nonetheless, the saturation power can still be extracted from the data, albeit with a large uncertainty. We fit to WW (WW) for the mode at 1522.7 nm (1532.1 nm). For a single PbS QD with absorption cross-section Cademartiri et al. (2006) cm2 and room-temperature excited state lifetime of ns Rakher et al. (2009), the expected saturation excitation power for our tapered fiber setup is W. Because the cross-section is so low, a non-diminished pump approximation is valid and the single particle saturation power should be accurate for small QD densities. Given the uncertainties in the fits as well as in the values for the cross-section and lifetime, the extracted saturation powers seem quite reasonable.
In conclusion, we have performed spectroscopy of m PbS QDs dried on Si photonic crystal cavities using a fiber taper waveguide. Future experiments will build towards single QD spectroscopy by lowering the QD density and improving the radiative efficiency by working in cryogenic conditionsRakher et al. (2009) and/or using brighter and more stable colloidal QDsPietryga et al. (2008). A combination of these strategies will lead to the development of novel and useful active nanophotonic devices in the telecommunications band.
The authors acknowledge fabrication support from D. L. Kwong and M. Yu at the Institute of Microelectronics in Singapore, partial funding support from NSF ECCS 0747787 and the New York State Foundation for Science, Technology, and Innovation, and useful discussion with Marcelo Davanço at NIST.
References
- Akahane et al. (2003) Y. Akahane, T. Asano, B.-S. Song, and S. Noda, Nature 425, 944 (2003).
- Srinivasan et al. (2004) K. Srinivasan, P. E. Barclay, M. Borselli, and O. Painter, Phys. Rev. B 70, 081306R (2004).
- Song et al. (2005) B.-S. Song, S. Noda, T. Asano, and Y. Akahane, Nature Materials 4, 207 (2005).
- Polman (1997) A. Polman, J. Appl. Phys. 82, 1 (1997).
- Park et al. (2005) H. Park, A. Fang, S. Kodama, and J. Bowers, Opt. Express 13, 9460 (2005).
- Wise (2000) F. Wise, Acc. Chem. Res. 33, 773 (2000).
- Talapin and Murray (2005) D. V. Talapin and C. B. Murray, Science 310, 86 (2005).
- Sargent (2004) E. H. Sargent, Advanced Materials (Weinheim, Ger.) 17, 515 (2004).
- Rakher et al. (2009) M. T. Rakher, C. W. Wong, and K. Srinivasan, in preparation (2009).
- Steckel et al. (2003) J. S. Steckel, S. Coe-Sullivan, V. Bulović, and M. G. Bawendi, Advanced Materials (Weinheim, Ger.) 15, 1862 (2003).
- Ribordy et al. (2004) G. Ribordy, N. Gisin, O. Guinnard, D. Stucki, M. Wegmuller, and H. Zbinden, Journal of Modern Optics 51, 1381 (2004).
- Fushman et al. (2005) I. Fushman, D. Englund, and J. Vuckovic, Appl. Phys. Lett. 87 (2005).
- Bose et al. (2007) R. Bose, X. Yang, R. Chatterjee, J. Gao, and C. W. Wong, Applied Physics Letters 90, 111117 (2007).
- Wu et al. (2007) Z. Wu, Z. Mi, P. Bhattacharya, T. Zhu, and J. Xu, Applied Physics Letters 90, 171105 (2007).
- Pattantyus-Abraham et al. (2009) A. G. Pattantyus-Abraham, H. Qiao, J. Shan, K. A. Abel, T.-S. Wang, F. C. J. M. van Veggel, and J. F. Young, Nano Letters 9, 2849 (2009).
- Bose et al. (2009) R. Bose, J. F. McMillan, J. Gao, and C. W. Wong, Applied Physics Letters 95, 131112 (2009).
- Spillane et al. (2003) S. M. Spillane, T. J. Kippenberg, O. J. Painter, and K. J. Vahala, Phys. Rev. Lett. 91, 043902 (2003).
- Hwang et al. (2005) I.-K. Hwang, S.-K. Kim, J.-K. Yang, S.-H. Kim, S. H. Lee, and Y.-H. Lee, Appl. Phys. Lett. 87, 131107 (2005).
- Srinivasan and Painter (2007) K. Srinivasan and O. Painter, Nature (London) 450, 862 (2007).
- Srinivasan and Painter (2007) Purchased from Evident Technologies and identified in this paper to foster understanding, without implying recommendation or endorsement by NIST.
- Hines and Scholes (2003) M. A. Hines and G. D. Scholes, Adv. Mater. (Weinheim, Ger.) 15, 1844 (2003).
- Painter et al. (1999) O. Painter, R. K. Lee, A. Yariv, A. Scherer, J. D. O’Brien, P. D. Dapkus, and I. Kim, Science 284, 1819 (1999).
- Peterson and Krauss (2006) J. J. Peterson and T. D. Krauss, Phys. Chem. Chem. Phys. 8, 3851 (2006).
- Barclay et al. (2005) P. Barclay, K. Srinivasan, and O. Painter, Opt. Express 13, 801 (2005).
- Tran et al. (2009) N.-V.-Q. Tran, S. Combrié, and A. D. Rossi, Phys. Rev. B 79, 041101 (2009).
- Chung and Bawendi (2004) I. Chung and M. G. Bawendi, Phys. Rev. B 70, 165304 (2004).
- Pelton et al. (2004) M. Pelton, D. G. Grier, and P. Guyot-Sionnest, Applied Physics Letters 85, 819 (2004).
- Tang and Marcus (2005) J. Tang and R. A. Marcus, The Journal of Chemical Physics 123, 204511 (2005).
- Babentsov et al. (2005) V. Babentsov, J. Riegler, J. Schneider, M. Fiederle, and T. Nann, J. Phys. Chem. B 109, 15349 (2005).
- Cademartiri et al. (2006) L. Cademartiri, E. Montanari, G. Calestani, A. Migliori, A. Guagliardi, and G. A. Ozin, Journal of the American Chemical Society 128, 10337 (2006).
- Pietryga et al. (2008) J. M. Pietryga, D. J. Werder, D. J. Williams, J. L. Casson, R. D. Schaller, V. I. Klimov, and J. A. Hollingsworth, J. Am. Chem. Soc. 130, 4879 (2008).