Eruptions from solar ephemeral regions as an extension of the size distribution of coronal mass ejections
Abstract
Observations of the quiet solar corona in the 171 Å ( MK) passband of the Transition Region and Coronal Explorer (TRACE) often show disruptions of the coronal part of small-scale ephemeral bipolar regions that resemble the phenomena associated with coronal mass ejections on much larger scales: ephemeral regions exhibit flare-like brightenings, rapidly rising filaments carrying absorbing material at chromospheric temperatures, or the temporary dimming of the surrounding corona. I analyze all available TRACE observing sequences between 1998/04/01 and 2009/09/30 with full-resolution 171 Å image sequences spanning a day or more within 500 arcsec of disk center, observing essentially quiet Sun with good exposures and relatively low background. Ten such data sets are identified between 2000 and 2008, spanning 570 h of observing with a total of 17133 exposures. Eighty small-scale coronal eruptions are identified. Their size distribution forms a smooth extension of the distribution of angular widths of coronal mass ejections, suggesting that the eruption frequency for bipolar magnetic regions is essentially scale free over at least two orders of magnitude, from eruptions near the arcsecond resolution limit of TRACE to the largest coronal mass ejections observed in the inner heliosphere. This scale range may be associated with the properties of the nested set of ranges of connectivity in the magnetic field, in which increasingly large and energetic events can reach higher and higher into the corona until the heliosphere is reached.
1 Introduction
Eruptive and explosive events in the solar corona exhibit a tendency for self-similar behavior that expresses itself in power-law distributions of frequency versus, e.g., size, total energy, or peak brightness (e.g., Drake, 1971; Crosby et al., 1993; Aschwanden et al., 2000, and references therein). In the case of solar flares, there is a remarkable scaling from small flares observed in the EUV to large flares seen in hard X-rays, with essentially the same power-law index describing quiet-Sun ’nanoflares’, active-region transient brightenings, and hard X-ray flares over eight orders of magnitude in estimated flare energy (Aschwanden and Parnell, 2002). A similar power-law behavior, albeit observable over a much smaller range in total energies, has been reported on for the energy distribution of large stellar flares (Audard et al., 2000). A power law is also a good approximation to, for example, the distribution of area or flux in recently emerged active regions (Harvey and Zwaan, 1993), extending relatively smoothly into the domain of ephemeral regions (Hagenaar et al., 2003) over almost five orders of magnitude in absolute magnetic flux.
In a study of SOHO/LASCO coronagraphic observations of the inner heliosphere, Robbrecht et al. (2009) present evidence that the angular width of coronal mass ejections (CMEs) exhibits a scale-free power-law distribution that extends from about 20∘ up to 120∘, i.e. over a range of a factor of about six in opening angle. This result is based on the use of an automated feature detection method, CACTus, applied to LASCO observations from September 1997 through January 2007. Earlier visual inspection of the LASCO data had suggested that the CME distribution peaks at an angular width of about 30∘, but the CACTus software also identifies many smaller structures. On visual inspection by Robbrecht et al. (2009) these are seen to fall into several categories, including visually-identified events that are broken up by the CACTus algorithm, trailing outflows, wavelike phenomena, slowly rising loop-like structures, opening field, and some ’false detections.’ It is unclear whether most of these features should be classified as true CMEs, but the present study puts these results in a perspective that suggests that perhaps these relatively narrow events identified by CACTus (or at least many of them) may well be part of a scale-free continuous distribution of eruptive events.
The apparently scale-free CME frequency distribution function over a factor of about 6 in angular width as found by the CACTus software begs the question as to what happens on even smaller scales. Here, not only the spatio-temporal resolution of the available telescopes comes into play, but also the very real possibility that small-scale, and generally less-energetic, eruptive events may not be able to escape through the overlying coronal field, and thus never develop into a proper CME while possibly having comparable properties for their associated field eruptions lower down (but see, e.g., Mandrini et al. (2005) for an example of a very small eruption that they argue did make it into the heliosphere, and Wang and Sheeley (2002) for a discussion of narrow SOHO/LASCO jets in or near coronal holes).
In order to investigate the statistics of small-scale coronal eruptions that are characteristically, but not uniquely, associated with ephemeral bipolar regions in the solar photosphere, I investige a sample of ten data sets obtained by the TRACE telescope between 2000 and 2008, and compare the results to the CME statistics as derived by Robbrecht et al. (2009).
Ephemeral regions are small bipolar magnetic regions that contain no sunspots or pores. Their unsigned magnetic fluxes range up to about Mx, above which bipolar regions are generally called active regions. At the small end of their flux spectrum, they extend into the intranetwork mixed-polarity field; a rather vaguely defined lower limit to their unsigned magnetic flux of order Mx is sometimes used, but no flux range has been formally defined for ephemeral regions. These regions behave like small active regions on initial emergence, with the two polarities fragmented into a set of smaller flux clusters that quickly separate on emergence, often showing complex meandering motions suggesting a tangled emerging field. Shortly after emergence, they are subjected to the supergranular flow, and the polarities drift into the network lanes, subject to canceling collisions or mergings with other network elements that are already there. They emerge almost uniformly across the solar surface, show little dependence on the solar cycle, and have an essentially random orientation altough the larger ones seem to have a slight preference for the dipole-axis orientation proper for the dominant magnetic cycle, and their emergence frequency decreases with increasing flux imbalance within the surrounding photosphere as seen in unipolar regions formed by decaying active regions. The distribution of their emergence frequency as a function of unsigned flux appears to be a smooth extension of the near-power-law distribution found for active regions, suggesting that ephemeral regions are a transition population between the large cycle-related active regions and the apparently ubiquitous mixed-polarity background of the internetwork field (see, e.g., Harvey and Zwaan, 1993; Schrijver and Zwaan, 2000; Hagenaar et al., 2003, 2008, and references therein).
2 Observations
The observations of the small-scale coronal eruptions were obtained with the Transition Region and Coronal Explorer (TRACE; Handy et al., 1999) in its 171 Å passband, which has a peak sensitivity around 1 MK. From the mission archive from 1998/04/01 through 2009/09/30, I selected all data sets pointing at quiet Sun, within 500 arcsec of disk center, extending over at least one day, with 171 Å images as the primary observing passband, and with exposures mostly exceeding 42 s in duration in order to ensure an adequate signal to noise ratio. The initial selection of potentially suitable data sets was facilitated by a visual mission summary made publically available via the TRACE mission home page.111URL: http://trace.lmsal.com/POD/TRACEpodarchive28.html#case02
These candidate data sets were then inspected for data quality, selecting only those sets with generally good exposures with acceptable background levels and radiation damage, that as a set have few or only short interruptions, and with a field of view between and the full arcminutes squared (thus, for example, generally excluding observations in the November–January orbital ’eclipse season’ because of the frequent transits of the Earth and the relatively high instrumental background level owing to a raised detector temperature in that phase of the year). The remaining ten data sets, with a total of 17133 exposures, are listed in Table 1. The effective duty cycle (estimated by identifying intervals with useful observations with interruptions of 30 min. or less) for each of these data sets exceeds 89%.
The image sequences were analyzed visually by displaying the series with normalized intensity scalings, corrected for particle hits on the detector (’despiked’), and by tracking the region for solar rotation, while offsetting for instrumental pointing changes. Events were selected that resembled small equivalents of active-region eruptions associated with CMEs, specifically looking for (a) erupting dark fibrils (like erupting filaments), (b) rapid dimmings around a compact ephemeral region (equivalents of large-scale coronal dimmings), or (c) very rapid reconfigurations of a mix of dark and bright coronal structures above ephemeral regions often linking to one or more neighboring regions.
For each of the selected events with one or more of the mentioned characteristics, I measured the largest length scale over which the perturbation of the corona was apparent, thus measuring the extent over which the eruption unfolds rather than the extent of the original source region or any particular one of the three abovementioned characteristics. I do not differentiate between the three characteristics as many events display them in conjuction. I return to this point in § 3.
Many other events occur within the complex, dynamic quiet-Sun corona in addition to those selected by the above criteria. Their inclusion in, or exclusion from, the currently discussed sample is admittedly subjective. Excluded were, for example, compact, contained flare-like brightenings, many of which are associated with very narrow, jet-like cusps. On the other hand, events with clearly eruptive signatures that included a jet-like event, for example, were included. This selection is similar to the distinction between larger GOES-class flares and CMEs: many (particularly the largest) flares are associated with CMEs, but in this study I focus on events that have clear signatures of a disruption of the magnetic field of the ephemeral region.
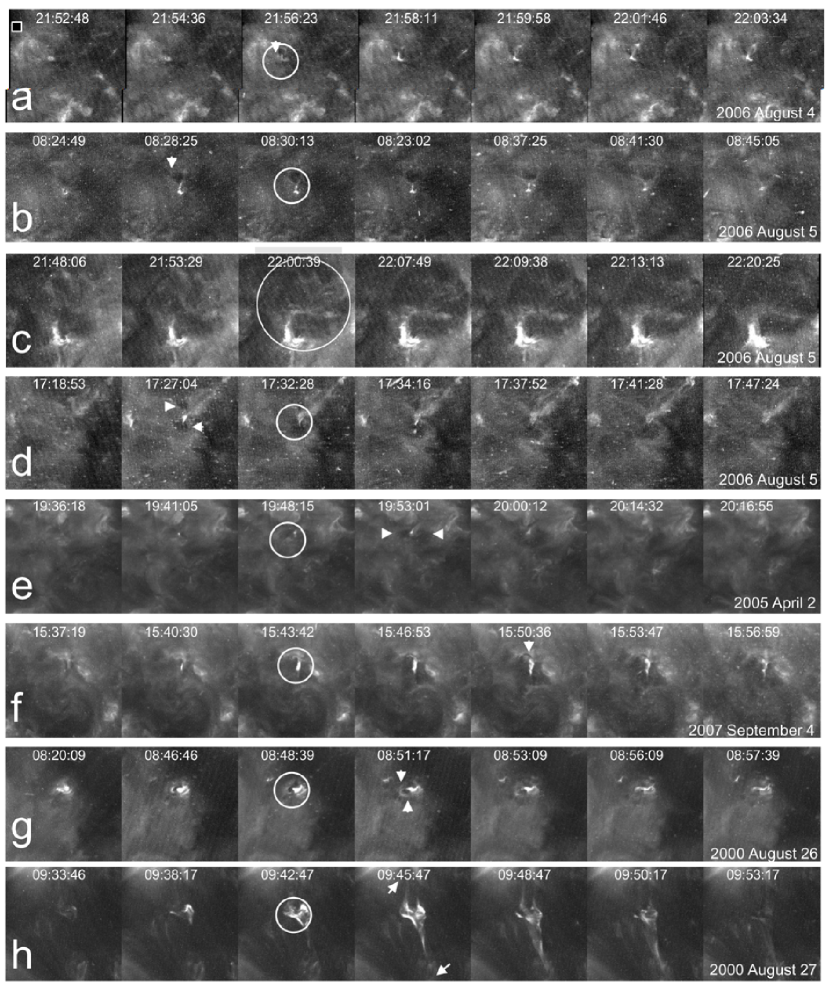
Figure 1 shows select examples of the types of events studied in here. Rows a and b show very small, bubble-like eruptions (marked by arrowheads in one of the frames for each case), in which a one-sided dimming suddenly appears; the size of the coronal dimming for case a in the image taken at 21:56 UT corresponds to 10 times the 1-arcsec TRACE resolution, which puts it at the limit of what can be reliably interpreted as an eruption based on the TRACE data. Row c shows a much larger example of such an event, with a clear coronal dimming extending over approximately 100 arcsec. Rows d and e show eruptions in which a two-sided dimming is seen (marked by the arrow heads), as sometimes observed in association with an active-region eruption. Row f shows an event with a dimming as well as a small, dark fibril (indicated in the 15:50UT frame by the arrowhead). Row g shows an example of a very compact eruption in association with a flare that is so bright that the diffraction pattern caused by the filter support grid shows up, as seen in the 2nd and 3rd panels. Row h shows an eruption in which the ephemeral region field connects to two relatively distant neighboring flux concentrations, extending in fact beyond the shown cutout of the full field of view of the observations.
The examples shown in Figure 1 are characteristic in their appearance, although they were selected from image sets that are well exposed with little damage by background radiation by energetic particles or by a high readout noise associated with relatively high detector temperatures in some phases of the orbits (depending on the season in which the observations are obtained). The diversity of phenomena, the frequent short-term interruptions of good observing conditions by energetic-particle impacts or Earth-atmospheric absorption, and the fact that we are evaluating pattern evolution rather than curves (such as flare brightness curves) severely hamper the ready application of an automated feature finding algorithm, instead requiring a visual identification of the events with the associated subjectivity of such a procedure.
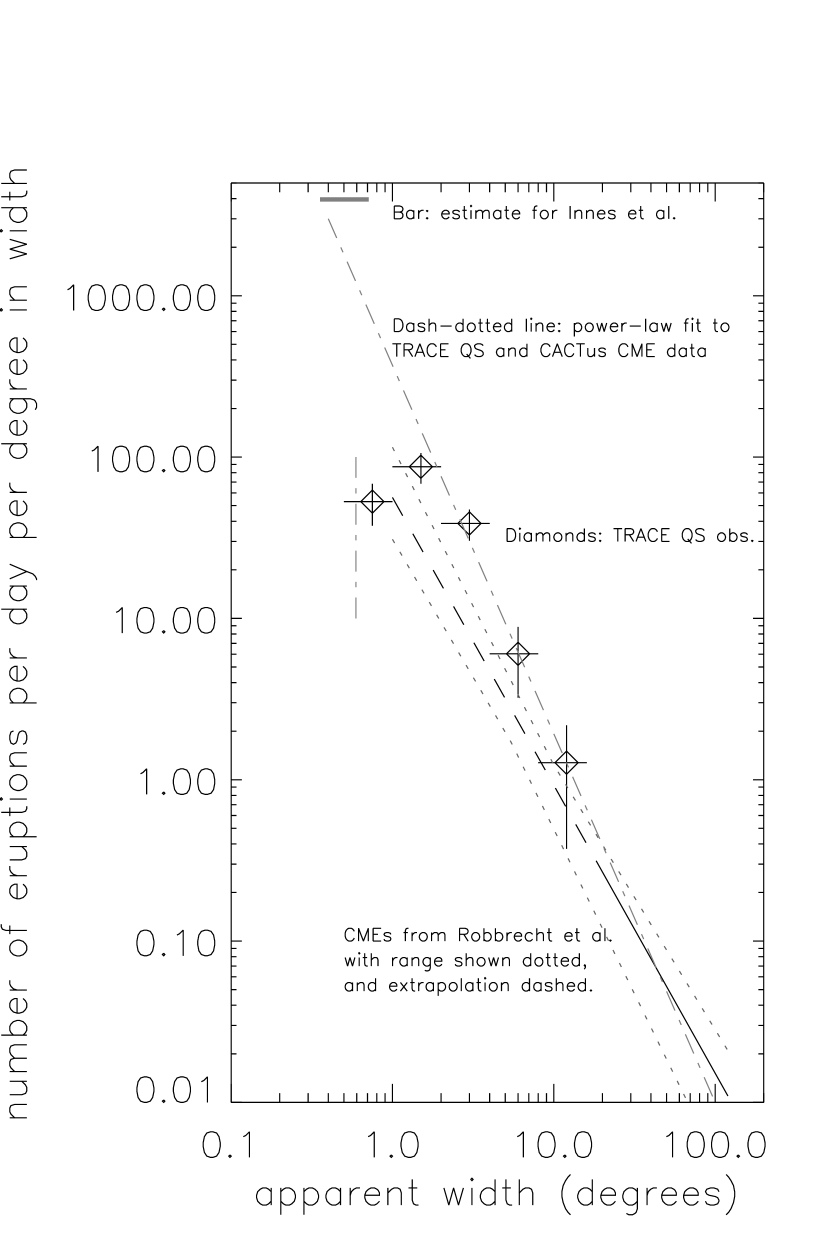
The set of all images, covering 570 h of observing, yielded 80 events that resembled small-scale active-region eruptions as defined above (see Table 1). Most of these events originate in the bright corona over ephemeral regions, but some occur in the connections between such regions, while two occur within the largely unstructured regions over very quiet Sun. The estimated event duration ranges from 3 min. to 104 min., with an average and standard deviation of min. For each eruption a characteristic length scale was estimated using the maximum extent of the event in any direction as measured on the images; these length scales range from 6 Mm to 160 Mm, with an average and standard deviation of Mm. The average histogram of the event size distribution, normalized to events per day on the Sun under the assumption of a homogeneous surface distribution, is shown in Fig. 2, binned into intervals with a width of a factor of two. The assumption of a uniform distribution over the solar surface holds only to first approximation: Hagenaar et al. (2003) show that the latitude distribution at least up to about 60∘ - the limit of the range included in their analysis - is somewhat tapered towards higher latitudes, but the distribution is broad and featureless and the assumption of uniformity good to within about a factor of two, commensurate with the statistical uncertainties of the number of events analyzed here.
3 Discussion and conclusions
The distribution of size scales for eruptive disturbances in the quiet-Sun corona (Fig. 2) shows a pronounced decrease in frequency with increasing size above the interval for the smallest selected events. The apparent turnover at the smallest scales is likely an artefact of the instrumental resolution: events smaller than about 10 resolution elements are difficult to assess, and identifying an erupting small filament or a coronal dimming for such compact features is problematic, so that these small events are likely significantly underrepresented in the sample. The interval for the largest eruptions contains only two events, both from the same region, so that the uncertainty on its frequency is substantial.
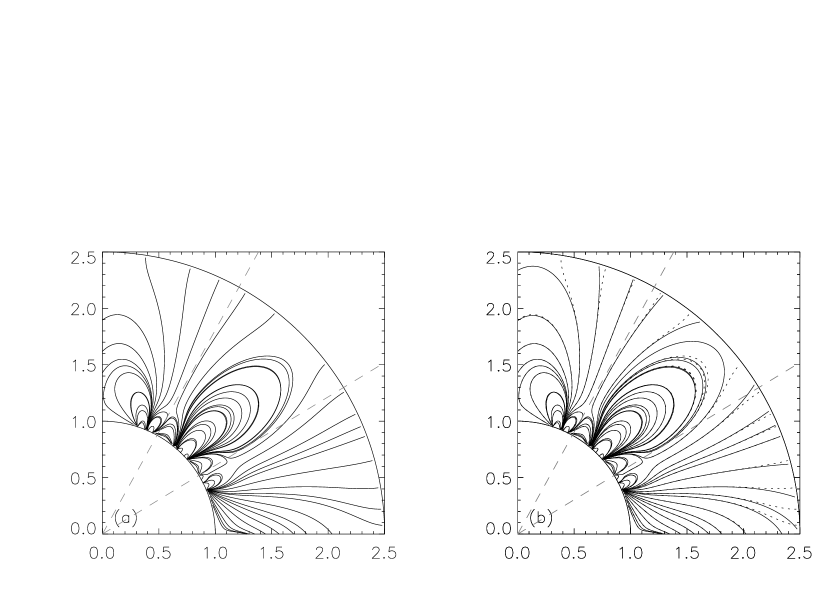
The statistics for the individual time intervals for the three remaining size intervals do not suffice by themselves to say much about the shape of the distribution function as a function of the phase of the solar cycle. Even with all data combined, the slope of the size distribution is rather poorly constrained based on the TRACE data by themselves. I propose, however, that the empirical evidence suggests the combination of the events identified in the present study with the results on CME widths from the study of LASCO observations by Robbrecht et al. (2009). I argue that in both cases, i.e., for the small eruptive events in quiet Sun and for global CMEs, the field somehow destabilizes, erupts, and is at least temporarily disrupted. In the case of the quiet-Sun eruptions of ephemeral-region field studied here, the ultimate extent of the event is likely restricted to the range of the set of magnetic connections of a bipolar region, unless it is energetic enough to breach that and reach into the next set of the overlying hierarchy. The same argument can be made for eruptions in the coronal field over active regions or over large quiet-Sun filaments, although here the highest domain of connectivity obviously reaches into the heliosphere. An illustrative example is shown in Fig. 3a, which mimics the potential field in the so-called PFSS (potential-field source-surface) approximation in which the field is forced to become radial at a distance of roughly 2.5 solar radii from the Sun’s center (see, e.g., Riley et al., 2006, for references and a comparison of the PFSS model results with MHD simulations of the quiescent coronal-heliospheric field). In this scenario, an eruption may be associated with an expanding filament, and all or only part of the coronal region into which the eruption unfolds may or may not exhibit a coronal dimming (see, for example, Reinard and Biesecker, 2008, for a comparison of the CME-related coronal dimmings and the CME angular size). If, in the field configuration shown in Fig. 3a, a large eruption would breach the high coronal field from the strong bipolar region centered at an angle of 45∘ in the diagram, the associated equivalent CME would have an opening angle into the heliosphere close to that shown by the two dashed lines; if, however, the field would contain the eruption and ejecta would be contained to within the range of magnetic concentrations to which the central region is connected, a rather comparable angle would be spanned as projected onto the solar surface - as sizes are expressed in this study (Fig. 1 in Schrijver and Title, 2003, also serves as an illustration in the literature pertinent to this argument for a plane-parallel approximation valid for scales small relative to the solar radius). Figure 3b illustrates how insensitive the inner coronal field is to the upper boundary condition of radial field. This single, highly abstract example of a PFSS field extrapolation does not suffice for a general conclusion, of course, but the correspondence of quiet-Sun eruptions and CME statistics may well point to this argument as the reason for their surprising alignment over a range of scales, as I now discuss.
Figure 2 shows that the average power-law fit to the events reported by Robbrecht et al. (2009) for the overlapping period of 2000 to 2006 forms a continuous extension of the size distribution from the present study, albeit at a somewhat steeper slope than the average fit to the CME distribution. Note that Figure 2 shows the mean power-law fit from Robbrecht et al. (2009) from an angular width of 20∘ upward, i.e., for the range in their results in which a power-law shows a good fit to the observed frequency distribution, and excluding - as for the TRACE observations - very narrow jet-like events (similarly, narrow jet-like ”collimated ejections” seen in LASCO observations (e.g. Wang and Sheeley, 2002) with width of up to are not included in the range to which power-law fits were made to the CACTus CME data). Although the distribution of ephemeral region eruptions lies somewhat above the average best fit to the CACTus CME distribution, they extend that distribution within the range of fits seen in the period of 2000 to 2006. The CACTus CME distribution does not differentiate between events originating in association with active regions or with quiet Sun, but the CME distribution is dominated by events associated with active regions: Zhou et al. (2003, consistent with earlier studies referenced therein), for example, find that 79% of front-side halo CMEs are associated with activity within active regions.
The results in Figure 2 suggest that the eruption frequency in large bipolar regions (for CMEs associated with bipolar regions) and in their (quiet-Sun) surroundings is a scale-free quantity that extends over a factor of almost 100 (but perhaps more), from the largest coronal mass ejections to eruptions near the resolvable limit of order 10 arcseconds for the highest-resolution EUV telescope.
Our knowledge about what happens on even smaller length scales is, for obvious reasons, rather limited. In a recent study, Innes et al. (2009) discuss what they call ’quiet Sun mini-CMEs’. They analyze a sequence of 171 Å images obtained by the STEREO-A spacecraft, with 150 s cadence (comparable to the average cadence in the data set discussed here) and 1.6 arcsec pixels (3.1 times larger than the TRACE pixels). They estimate a total number of events of 1400 per day for the entire Sun when assuming a uniform surface distribution. They do not specifically count events equivalent to those reported on here that look like eruptions of small active-regions, but look for ”emission or absorption trains by eye in series of time-distance 171 Å images” and make ”sensible choices for selecting events.” They do not provide a size distribution, or an average size, of their events, but do note that ”only events seen over 6′′ (3 consecutive pixels) were kept.” Assuming that the steep power law found here continues to the smallest scales that they include, the number of smallest events will dominate the total count. If we assume that these events all reside in an interval with a width of a factor of two, as used for the TRACE data in Fig. 2, extending from 6 to 12 arcseconds, then the equivalent position of the results by Innes et al. (2009) is shown by the gray bar in Fig. 2. As their count includes flare-like brightenings, rapid coronal configurations, as well as the small eruptions counted in the TRACE data analyzed here, the position of the Innes et al. (2009) results is compatible with the TRACE results, even though the mix of event types in their study does not provide a strong constraint on the extension of the power law to very small scales.
Altogether, the data from SOHO/LASCO, TRACE, and STEREO suggest an essentially scale-free frequency distribution for sizes of magnetically driven eruptions in the Sun that extends from the smallest scales that can be observed by present-day high-resolution instruments up to large-scale coronal mass ejections. The grey dashed-dotted line in Figure 2 suggests that this frequency distribution may be approximated to first order by a power-law distribution with an index of about (to be compared to the equivalent power-law index for length scales of loops involved in small-scale quiet-Sun flaring of reported by Aschwanden et al., 2000).
The characteristic power-law index of and the possible steepening when going from large to smaller scales has an intriguing analogy in the flux distribution of newly emerging bipolar regions from large active regions to small ephemeral regions, as summarized by Hagenaar et al. (2003) in their Fig. 11: the apparently smooth transition from ephemeral to active regions can be approximated by a single power law fit with a slope rather close to . It will be interesting, in a future study, to explore in detail the reasons behind this commonality, which includes at least assessing relationships between the longevity of regions as a function of their size (e.g., Harvey and Zwaan, 1993) and the evolution of their propensity to erupt during their life time (possibly related to the phenomenon of active-region nesting, see Brouwer and Zwaan, 1990; Harvey and Zwaan, 1993), and the relationship between the properties of active regions and the extent of their possible eruptions (e.g., Moore et al., 2007).
Although the TRACE data sets studied here span a large part of the past sunspot cycle, the number of events detected per data set is too small to make significant statements about the possible dependence of the number of events on the phase of the sunspot cycle. Data sets at latitudes other than near disk center are even rarer in the TRACE records. In time, the Atmospheric Imaging Assembly on the future Solar Dynamics Observatory should enable a more comprehensive study of the statistics of erupting bipolar regions from ephemeral to active regions both as a function of latitude and cycle phase.
References
- Aschwanden and Parnell (2002) Aschwanden, M. J. & Parnell, C. E. 2002, ApJ 572, 1048
- Aschwanden et al. (2000) Aschwanden, M. J., Tarbell, T. D., Nightingale, R. W., Schrijver, C. J., Title, A. M., Kankelborg, C. C., Martens, P. C. H., & Warren, H. P. 2000, ApJ 535, 1047
- Audard et al. (2000) Audard, M., Güdel, M., Drake, J. J., & Kashyap, V. L. 2000, ApJ 541, 396
- Brouwer and Zwaan (1990) Brouwer, M. P. & Zwaan, C. 1990, Solar Phys. 129, 221
- Crosby et al. (1993) Crosby, N. B., Aschwanden, M. J., & Dennis, B. R. 1993, Solar Phys. 143, 275
- Drake (1971) Drake, J. F. 1971, Solar Phys. 16, 152
- Hagenaar et al. (2008) Hagenaar, H. J., DeRosa, M. L., & Schrijver, C. J. 2008, ApJ 678, 541
- Hagenaar et al. (2003) Hagenaar, H. J., Schrijver, C. J., & Title, A. M. 2003, ApJ 584, 1107
- Handy et al. (1999) Handy, B. N., Acton, L. W., Kankelborg, C. C., Wolfson, C. J., Akin, D. J., Bruner, M. E., Carvalho, R., Catura, R. C., Chevalier, R., Duncan, D. W., Edwards, C. G., Feinstein, C. N., Freeland, S. L., Friedlander, F. M., Hoffman, C. H., Hurlburt, N. E., Jurcevich, B. K., Katz, N. L., Kelly, G. A., Lemen, J. R., Levay, M., Lindgren, R. W., Mathur, D. P., Meyer, S. B., Morrison, S. J., Morrison, M. D., Nightingale, R. W., Pope, T. P., Rehse, R. A., Schrijver, C. J., Shine, R. A., Shing, L., Strong, K. T., Tarbell, T. D., Title, A. M., Torgerson, D. D., Golub, L., Bookbinder, J. A., Caldwell, D., Cheimets, P. N., Davis, W. N., Deluca, E. E., McMullen, R. A., Amato, D., Fisher, R., Maldonado, H., & Parkinson, C. 1999, Solar Phys. 187, 229
- Harvey and Zwaan (1993) Harvey, K. L. & Zwaan, C. 1993, Solar Phys. 148, 85
- Innes et al. (2009) Innes, D. E., Genetelli, A., Attie, R., & Potts, H. E. 2009, A&A 495, 319
- Mandrini et al. (2005) Mandrini, C. H., Pohjolainen, S., Dasso, S., Green, L. M., Démoulin, P., van Driel-Gesztelyi, L., Copperwheat, C., & Foley, C. 2005, A&A 434, 725
- Moore et al. (2007) Moore, R. L., Sterling, A. C., & Suess, S. T. 2007, ApJ 668, 1221
- Reinard and Biesecker (2008) Reinard, A. A. & Biesecker, D. A. 2008, ApJ 674, 576
- Riley et al. (2006) Riley, P., Linker, J. A., Mikić, Z., Lionello, R., Ledvina, S. A., & Luhmann, J. G. 2006, ApJ 653, 1510
- Robbrecht et al. (2009) Robbrecht, E., Berghmans, D., & Van der Linden, R. A. M. 2009, ApJ 691, 1224
- Schrijver and Title (2003) Schrijver, C. J. & Title, A. M. 2003, ApJL 597, L165
- Schrijver and Zwaan (2000) Schrijver, C. J. & Zwaan, C. 2000, Solar and Stellar Magnetic Activity, Cambridge University Press, Cambridge, U.K.
- Wang and Sheeley (2002) Wang, Y.-M. & Sheeley, N. R. 2002, ApJ 575, 542
- Zhou et al. (2003) Zhou, G., Wang, J., & Cao, Z. 2003, A&A 397, 1057
| Time interval | Duty | fov | no. | no. | |
|---|---|---|---|---|---|
| (h) | cycle(%) | (armin2) | images | events | |
| 2000-08-26 00:16UT to 2000-08-28 12:59UT | 60.8 | 92 | 42 | 1548 | 7 |
| 2003-03-25 00:08UT to 2003-20-26 23:59UT | 48.0 | 100 | 55 | 1236 | 10 |
| 2004-07-10 01:01UT to 2004-07-11 23:59UT | 47.0 | 100 | 16 | 560 | 2 |
| 2005-04-02 00:19UT to 2005-04-04 06:39UT | 54.0 | 95 | 54 | 1569 | 13 |
| 2006-08-04 09:57UT to 2006-08-07 23:59UT | 86.0 | 94 | 56 | 4690 | 22 |
| 2006-10-15 05:46UT to 2006-10-20 13:58UT | 128.0 | 99 | 58 | 4701 | 8 |
| 2007-04-05 00:22UT to 2007-04-06 05:55UT | 29.6 | 100 | 36 | 609 | 4 |
| 2007-06-19 01:11UT to 2007-06-20 23:59UT | 46.9 | 89 | 58 | 672 | 5 |
| 2007-09-03 01:45UT to 2007-09-04 23:59UT | 46.2 | 100 | 36 | 870 | 5 |
| 2008-02-12 00:37UT to 2008-02-12 23:59UT | 23.4 | 100 | 58 | 678 | 6 |