Charm cross-section and charmonium(like) states in annihilation with Belle
T. Uglov
Institute for Theoretical and
Experimental Physics,
Bolshaya Cheremushkinskaya, 25, 117218,
Moscow, Russia
Abstract
We report BELLE measurements of the exclusive cross sections for the
processes , , , the first observation of
decay and new state, , using ISR. In addition,
another cluster of events at around 4.05 GeV/ is reported.
1 Introduction
Exclusive hadronic cross sections to final states with charm
meson pairs are of special interest since they provide information
on the spectrum of charmonium states above the
open-charm threshold. Parameters of these states obtained from fits to
the inclusive cross section [1] are poorly understood
theoretically [2].
Initial-state radiation (ISR) is proved to be a powerful tool for
measurement of the exclusive hadronic cross sections at
smaller than the initial center-of-mass energy () at
-factories. ISR allows to obtain cross sections in a broad energy
range while the high luminosity of the -factories compensates for
the suppression associated with the emission of a hard photon.
Here we report the first observation of the new charmonium-like state,
[3], clustering structure near
4.05 GeV/ [4], the first measurement of the exclusive
cross sections for the processes [5],
[6], and the first observation of
decay [7]. The data sample corresponds to a
large integrated luminosity collected with the Belle
detector [8] at the resonance and nearby
continuum at the KEKB asymmetric-energy collider [9].
2 Recoil mass technique
There are two ways of ISR event reconstruction: partial or full.
In the full reconstruction method we select signal
events by reconstructing both the and
mesons. In general, the is not required to be detected; its
presence in the event is inferred from a peak at zero in the spectrum
of the recoil mass against the system. The square of the recoil
mass is defined as:
where and are the energy and
momentum of the combination, respectively.
To select signal events we use the partial reconstruction
method that achieves high efficiency by requiring full reconstruction
of only one of the mesons, the , and the slow
from the other [10]. In this
case the spectrum of masses recoiling against the
system
peaks at the mass. Here and are the c.m. energy and momentum, respectively, of the
combination. This peak is expected to be wide and
asymmetric due to the photon energy resolution function and higher-order
corrections to ISR. To disentangle the
contributions from different final states and to suppress combinatorial
backgrounds, we use the slow pion from the unreconstructed
. The difference between the mass recoiling against and (recoil mass
difference):
has a narrow distribution around the nominal value, since the uncertainty in momentum
partially cancels out.
3 Observation of the significant enhancement at 4.05.
We identify process by peak in the
distribution on the recoil mass against the combination;
is reconstructed in and
modes.
Fig. 1 shows the invariant
mass distribution in the region of . There is a clear
enhancement at similar to that observed by the
BaBar Collaboration [11]. In addition, there is a
clustering of events around that is significantly
above the background level.
Figure 1: Fit
to the a): b): mass spectrum with two coherent resonances. The
curves show the best fit and the contribution from each component.
The dashed curves are for solution I, and the dotted curves
for solution II.
An unbinned maximum likelihood fit is applied to the
mass spectrum in Fig. 1, a). Since
there are two clusters of events in the mass distribution, we fit it
with two coherent Breit-Wigner (BW) resonance functions assuming there
is no continuum production of . There are two
solutions with equally good fit quality. The masses (() and () for the
first and second states, respectively) and widths (() and )) of the resonances are the same
for both solutions; the partial widths to and the relative phase
between them are different. The interference is constructive for one
solution and destructive for the other. The statistical significance
of the structure around 4.05 GeV/ is estimated to be
and is greater than in all of the fitting scenarios that are
considered.
4 First observation of state.
Similar analysis is done for the final state.
Fig. 1, b) shows the invariant mass for selected
events, together with background estimated from the scaled
mass sidebands. Two distinct peaks are evident, one at
4.36 GeV/ and another at 4.66 GeV/.
An unbinned maximum likelihood fit that includes two coherent -wave
Breit-Wigner (BW) functions and a constant, incoherent background is
applied to the mass spectrum in
Fig. 1, b). The fit results in two
solutions with equally good fit quality, masses (() for the first state, ()for the second state)
and widths (() and ()). The
interference is constructive for one solution and destructive for the
other. A statistical significance of is obtained for the
peak around .
5 Measurement of the near-threshold cross section
For the measurement of the exclusive cross section we determine the
mass. The cross sections are extracted from the
mass distributions after background subtraction using the
relation described in [5]. The resulting exclusive
cross sections are shown in Fig. 2.
Figure 2: The exclusive cross sections for a) and b) .
The shape of the cross section is complicated with
several local maxima and minima. Aside from a prominent excess near
the , the cross section is relatively
featureless. The measured cross sections are compatible [12]
within errors with the exclusive cross
section in the energy region up to measured by
CLEO-c [13].
6 Measurement of the near-threshold cross section
The and exclusive cross sections, measured with full
event reconstruction method are shown in Fig. 3. Belle
results, shown with the red points, are compared to the BaBar data
(blue points). The observed exclusive cross sections are
consistent with recent BaBar measurements [14] and are in
qualitative agreement with the coupled-channel model predictions of
Ref. [15]. This includes a peak at that is seen
both in Belle and BaBar mass spectra.
Figure 3: The exclusive cross sections for and . The
data are taken from the Durham database based on [6] and [14].
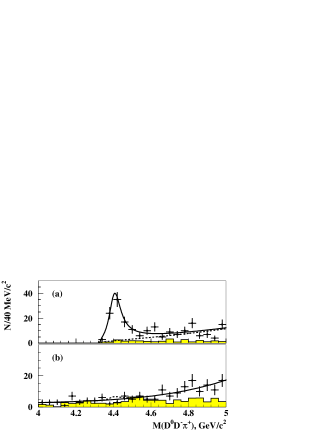
7 Observation of decay
Figure 4: (a) The spectrum for the signal region. The
threshold function is shown by the dashed curve. (b) The
spectrum outside the signal region. The dashed curve
shows the upper limit on the yield at 90% C.L. Histograms
show the normalized contributions from and sidebands.
We use the full reconstruction method described above to
select signal candidates. The cross section extracted
from the background-subtracted mass distribution demonstrates a
prominent peak in a region of resonance. To study the
resonant structure in decays, we select combinations from a
mass window around the nominal mass [16]. We
perform a separate study of and . The spectrum for the signal
interval is shown in Fig. 4(a). A clear peak corresponding to
decay is evident near the threshold. We perform a
likelihood fit to distribution with the signal
parametrized by an -wave RBW function. The significance for the
signal is obtained to be . The obtained peak mass
and total width
are in good
agreement with the PDG [16] values, the recent BES
results [1] and predictions of Ref. [2].
8 Conclusions
In summary, we presented the first observation of the new
charmonium-like state, , significant enhancement near
4.05, the first measurement of the exclusive cross sections for
the processes , , and the first observation of
decay. The obtained ISR results are in a good agreement with
the recent CLEO-c and BaBar measurements of the exclusive cross
sections.
9 Acknowledgements
The work is supported by President’s Grant MK-4646.2009.2.
References
[1] M. Ablikim et al. (BES Collab.), Phys. Lett. B
660, 315 (2008).
[2] T. Barnes, S. Godfrey and E. S. Swanson, Phys. Rev. D
72, 054026 (2005).
[3] X. L. Wang et al. (Belle Collab.),
Phys. Rev. Lett. 99, 142002 (2007).
[4] C. Z. Yuan, et al. (Belle Collab.),
Phys. Rev. Lett. 99, 182004 (2007).
[5] G. Pakhlova et al. (Belle Collab.),
Phys. Rev. Lett. 98, 092001 (2007).
[6] G. Pakhlova et al. (Belle Collab.),
Phys. Rev. D 77, 011103 (2008).
[7] G. Pakhlova et al. (Belle Collab.),
Phys. Rev. Lett. 100, 062001 (2008)
[8] A. Abashian et al. (Belle Collab.),
Nucl. Instr. and Meth. A 479, 117 (2002).
[9] S. Kurokawa and E. Kikutani, Nucl. Instr. and Meth. A
499, 1 (2003); and other papers included in this volume.
[10] Charge-conjugate modes are included throughout this
paper.
[11] B. Aubert et al. (BaBar Collab.), Phys. Rev. Lett. 95, 142001 (2005).
[12] Since only charged final states are measured, our
results should be scaled by a factor of two for this comparison.
[13] D. Cronin-Hennessy et al. (CLEO Collab.),
arXiv:0801.3418 [hep-ex]
[14] B. Aubert et al. (BaBar Collab.),
Phys. Rev. D 76, 111105 (2007).
[15] E. Eichten, K. Gottfried, T. Kinoshita, K.D. Lane
and Tung-Mow Yan, Phys. Rev. D 21, 203 (1980).
[16] W.-M. Yao et al. (Particle Data Group), J. Phys. G
33, 1 (2006).