The radio and IR counterparts of the ring nebula around HD 211564
Abstract
We report the detection of the radio and infrared counterparts of the ring nebula around the WN3(h) star HD 211564 (WR 152), located to the southwest of the Hii region Sh2 132. Using radio continuum data from the Canadian Galactic Plane Survey, we identified the radio counterparts of the two concentric rings, of about 9′ and 16′ in radius, related to the star. After applying a filling factor = 0.05-0.12, electron densities and ionized masses are in the range 10-16 cm-3 and 450-700 M⊙, respectively. The analysis of the Hi gas emission distribution allowed the identification of 5900 M⊙ of neutral atomic gas with velocities between –52 and –43 km s-1 probably linked to the nebula. The region of the nebula is almost free of molecular gas. Only four small clumps were detected, with a total molecular mass of 790 M⊙. About 310 M⊙ are related to a small infrared shell-like source linked to the inner ring, which is also detected in the MSX band A. An IRAS YSO candidate is detected in coincidence with the shell-like IR source.
We suggest that the optical nebula and its neutral counterparts originated from the stellar winds from the WR star and its massive progenitor, and are evolving in the envelope of a slowly expanding shell centered at = (10230, –050), of about 31 pc in radius. The bubble’s energy conversion efficiency is in agreement with recent numerical analysis and with observational results.
keywords:
ISM: bubbles – stars: Wolf-Rayet – ISM: Hii regions1 Introduction
The strong mass flow and high UV photon flux of Wolf-Rayet stars originate the so called ring nebulae, which can be identified as ring-like optical features in the environs of the stars. Searches for optical ring nebulae around WR stars performed in the last decades (e.g. Chu 1981; Heckathorn et al. 1982; Miller & Chu 1993; Marston et al. 1994, 1995), resulted in the detection of more than 60 ring nebulae, 70% of which are linked to WN stars. High angular resolution radio continuum observations led to the detection of the radio counterparts to 25% of the ring nebulae, allowing the estimation of several physical parameters (e.g. Cappa et al. 2002).
In addition, spectral line observations of the neutral atomic and molecular gas helped to determine the characteristics of stellar wind bubbles, since they revealed large amounts of neutral gas linked to the nebulae, and allowed to include neutral gas in the estimate of the bubble’s energetics (Cappa 2006). Conclusions from these studies, which indicated that a small amount of the stellar wind energy released by the central star is converted into kinetic energy of the bubbles, are compatible with both observational and theoretical studies (e.g. Chu et al. 1983; Oey 1996; Freyer et al. 2003, 2006; Cooper et al. 2004).
In the last years, available infrared images obtained from the MSX Galactic Plane Survey (Price et al. 2001) and GLIMPSE survey (IRAC images, Benjamin et al. 2003) allowed the identification of interstellar bubbles in the near- and mid-IR, showing the presence of photodissociation regions at the interface between the ionized and molecular gas (Churchwell et al. 2006, Watson et al. 2008, Watson et al. 2009).
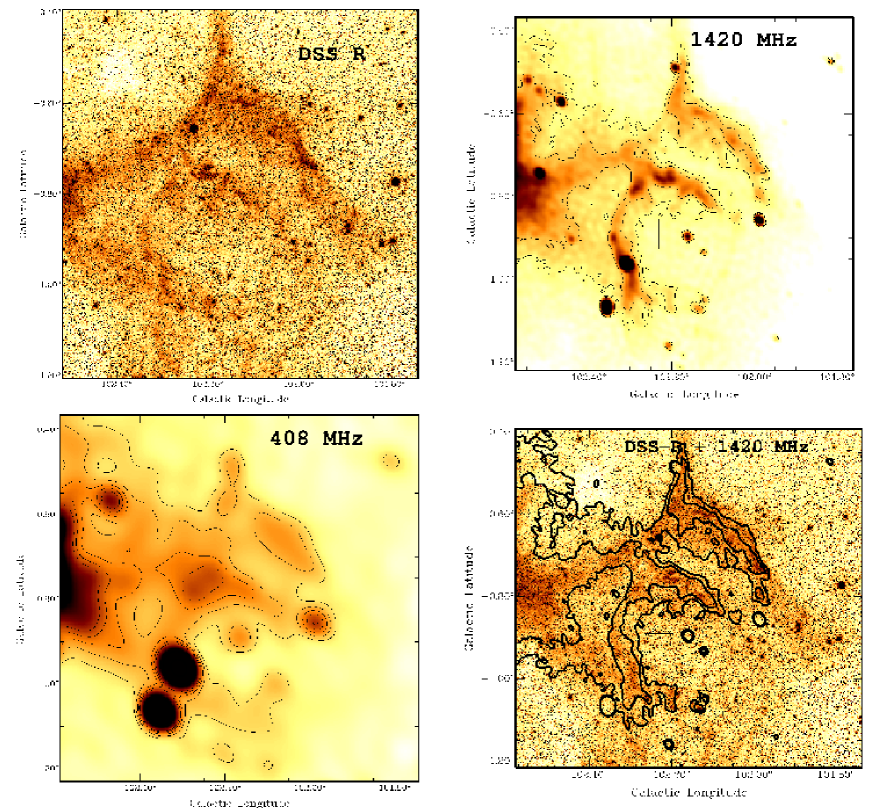
Among the ring nebulae detected optically, the one around the WN star HD 211564 is particularly interesting. The morphology of this optical ring nebula can be described by two concentric ring structures having about 17′ and 36′ in diameter, detected in [OIII], [SII], and H + [NII] lines (Heckathorn et al. 1982). The nebulae are easily identified in the DSS2 R image displayed in the upper left panel of Fig. 1. The symmetry of the inner ring is suggestive of a quite homogeneous interstellar medium, except possibly in the south-southwest quadrant. Both structures are brighter in [OIII] lines than in H + [NII], following the tendency for nebulae around early WN stars (Heckathorn et al. 1982). The inner structure is sharp in appearance and almost complete, with the WR star displaced 37 northeast from the geometrical centre. On the contrary, the outer shell is more diffuse and less well defined.
This ring nebula is located at the southwest of the Hii region Sh2-132, whose brighter section (not shown here) is excited by the WR star HD 211853, at = (10278, –065), and a few O-type stars. Although both HD 211853 and HD 211564 are linked to Sh2-132, they appear related to quite distinct structures.
Previous radio observations of Sh2-132 at 1420 MHz (Felli & Churchwell 1972) show a relatively large area of faint emission extending towards the region where the ring nebula is present. The inner shell was also detected in the far infrared by Marston (1996), who found an infrared shell of 21′ in diameter surrounding the WR star.
HD 211564 ( LS III+55 30 = WR 152) is a WN3(h) star (Smith et al. 1996) located at = (10223, –089) or (RA,Dec[J2000]) = (22h16m24s, +55∘37′37″). The star is considered a probable member of the Cep OB1 association (Lundstron & Stenholm 1984) located in the Perseus spiral arm.
The terminal wind velocity of HD 211564 is in the range 1800-2100 km s-1 (Rochowicz & Niedzielski 1995; Hamann & Koesterke 1998; Niedzielski & Skorzynski 2002), while a mean value for the mass loss rate of WN-w stars is about 510-6 M⊙ yr-1 (Crowther 2007).
In this paper, we report on the radio counterpart of the ring nebula around the WN star HD 211564 first identified by Heckathorn et al. (1982) and analyze the distribution of the ionized and neutral gas using radio continuum and Hi-21cm line data from the Canadian Galactic Plane Survey (CGPS, Taylor et al. 2003), CO data from the Five College Radio Astrophysical Observatory (FCRAO, Heyer et al. 1998), and infrared data from the IRAS and MSX satellites.
2 Data sets
The analysis of the ionized and neutral atomic gas in the environs of HD 211564 was performed using data from the CGPS obtained with the Synthesis Telescope of the Dominion Radio Astrophysical Observatory (DRAO), in Canada. This telescope performed interferometric observations of the 21-cm Hi spectral line, and, simultaneously, continuum emission in two bands centered at 1420 MHz and 408 MHz. Single-dish data were incorporated into the interferometric images ensuring accurate representation of all structures to the largest scales.
To investigate the Hi emission distribution, we extracted a data cube centered at = (10250, –10, –53.4 km s-1) and analyzed a region of 1515 in size. The synthesized beam is 119098, the rms noise is 3 K in brightness temperature (), and the velocity resolution and channel separation are 1.32 and 0.824 km s-1, respectively. The Hi images were convolved to a 25 25 beam size to facilitate the identification of structures. The observed velocities cover the range –165 to +57 km s-1.
The radio continuum data have synthesized beams of 3428 and 10082 at 408 and 1420 MHz, respectively. The measured rms image noises are 1.1 and 0.063 K at 408 and 1420 MHz, respectively.
The 12CO(1-0) line data at 115 GHz were obtained from Brunt & Heyer (2009). The angular resolution is 45″, the velocity resolution 1.0 km s-1, and the rms noise, 0.7 K (main beam brightness temperature).
Infrared images at different wavelengths were used to investigate the dust distribution in the region of the nebula. High resolution IRAS images (HIRES) at 12, 25, 60, and 100 m, were taken from IPAC 111IPAC is funded by NASA as part of the IRAS extended mission under contract to Jet Propulsion Laboratory (JPL) and California Institute of Technology (Caltech).. The angular resolution is in the range 1′-2′.
Images at 8.28, 12.13, 14.65, and 21.3 m (bands A, C, D and E, respectively) taken by the MSX satellite were also obtained from IPAC (184 in angular resolution).
Additional radio and optical images of the region were retrieved from the Skyview web page222http://skyview.gsfc.nasa.gov/.
Finally, to investigate the presence of stellar formation activity in the outskirts of the nebula, we used infrared point sources from the MSX, 2MASS, and IRAS catalogues.
3 Results
3.1 The ionized gas
The radio emission at 1420 and 408 MHz, along with an overlay of the optical and radio emissions at 1420 MHz, are displayed in Fig. 1. Both the inner and outer features identified at optical wavelengths have well detected radio counterparts, as observed at 1420 MHz (upper right panel). The lower right panel shows the striking correlation between the optical and 1420 MHz radio continuum. The inner ring is not complete. However, very low level radio continuum emission is present near = (10207,–100). The outer ring is incomplete both at optical and radio wavelengths. On the other hand, at 408 MHz only the inner structure can be easily identified, while emission linked to the outer optical feature is discernible only near = (1020, –067) (Fig. 1, bottom left panel). The inner and outer rings, as estimated from the optical and radio images, are about 19′ and 32′ in size, respectively.
The nebula is also detected at 2.7 GHz (Frst et al. 1990) and at 4.85 GHz (Condon et al. 1994). Faint emission at 8.35 and 14.85 GHz (Langston et al. 2000) most probably associated with the ring nebula can also be identified.
In order to estimate flux densities of both the inner and outer structures at 1420 MHz and to derive the radio continuum spectral index, we analyzed first the nature of the small-diameter radio sources projected onto the optical nebula. The coordinates of such sources are listed in Table 1, along with the measured flux densities at 408 and 1420 MHz, the spectral index derived from the CGPS data, the catalogued flux densities at other wavelengths, and their identification.
Sources 1, 2, 4, 5, and 6 appear projected onto the nebula. The location of sources 7 and 8 suggests that they are probably unconnected to the features we are interested in. Sources 1, 2, 5, 6, and 8 are clearly non-thermal in nature, probably extragalactic sources.
After subtracting the contribution of the compact sources, and taking into account different background emissions, we estimated the flux density of the inner and outer features around HD 211564 from the image at 1420 MHz. Our estimates are = 0.60.1 Jy and = 1.20.1 Jy for the inner and outer structures, respectively.
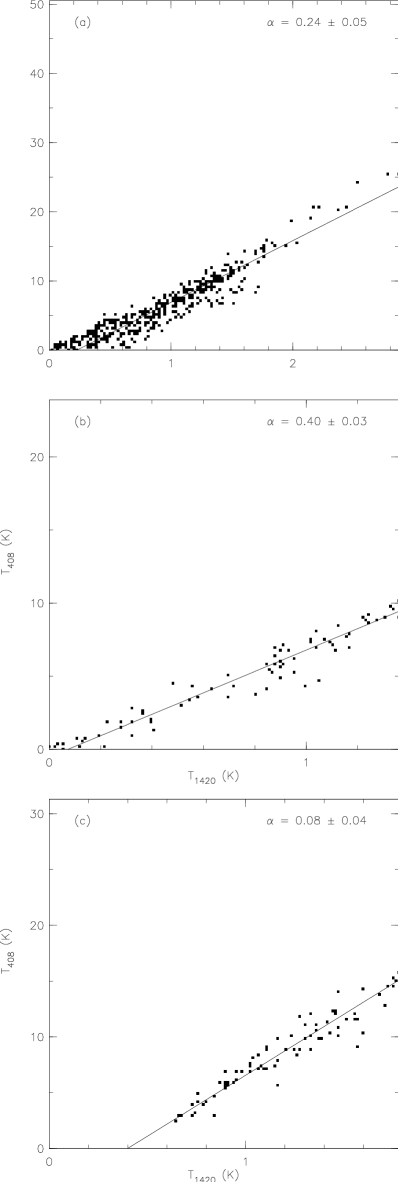
The CGPS images were used to evaluate the spectral index distribution of the radio continuum emission around HD 211564. As a first step, we removed the point sources from the region of interest and convolved the 1420 and 408 MHz images to the same circular resolution of 34. We then constructed TT-plots, in which the brightness temperature at one frequency is plotted point-by-point against the brightness temperature at the other frequency. The temperature spectral index , where , is directly related to the slope of the straight line fitted by regression, . The usual flux density spectral index () is simply .
| S1420 | S408 | S365 | S610 | S1420 | S4850 | Identification | |||
|---|---|---|---|---|---|---|---|---|---|
| (∘) | mJy | mJy | mJy | mJy | mJy | mJy | |||
| (1) | (1) | (2) | (3) | (4) | (5) | ||||
| 1 | 102.355,–1.065 | 1655 | 40922 | –0.70.2 | 67778 | 245 | 528 | 87GB[BWE91] 2216+5517 | |
| 2 | 102.308,–0.961 | 1876 | 63020 | –1.00.1 | 72556 | 325 | 9112 | 87GB,221520.4+552034 | |
| 3 | 102.206,–0.160 | 101 | — | 9.70.6 | NVSS J221720+552309 | ||||
| 4 | 102.122,–0.932 | 5.80.5 | — | 6.60.6 | NVSSJ 221556+553135 | ||||
| 5 | 102.161,–0.896 | 171 | 354 | –0.60.3 | 13.60.6 | NVSS J221601+553446 | |||
| 6 | 101.986,–0.856 | 441 | 874 | –0.60.1 | 7C2213+5516 | ||||
| 7 | 102.519,–0.743 | 321 | — | 40 | 23.00.9 | NVSS J221731+555424 | |||
| 8 | 102.466,–0.619 | 301 | 667 | –0.60.3 | 65 | 19.20.8 | NVSS J221632+560118 |
References: (1) this paper, derived using CGPS data; (2) Douglas (1996), Gregory (1991); (3) Harten et al. (1978); (4) Condon et al. (1998); (5) Becker (1991)
The results of the TT-plot analysis are presented in Figure 2(a-c). In each case, the analysis was limited to regions brighter than 6 K at 1420 MHz and 57 K at 408 MHz. The first panel (Fig. 2a) is a TT-plot of the entire region within an angular radius of 24′ from the centre of the inner ring at = (10220, –092). Although a significant amount of scatter is present on the diagram, a convincing fit is obtained yielding . Since this value is somewhat different from the canonical value of –0.1 for optically thin bremstrahlung, we applied the same procedure to a number of sub-regions around HD 211564 to look for possible spatial variations. Figures 2(b) and (c) show the TT-plots corresponding to the northwestern outer ring near = (10208, –067) and the northern half of the inner ring, respectively. There seems indeed to be significant variations. As a further test, we evaluated the spectral index of the nebulosities around nearby HD 211853 and found (Vasquez et al. 2009), a value clearly more consistent with optically thin bremstrahlung.
3.2 Infrared emission
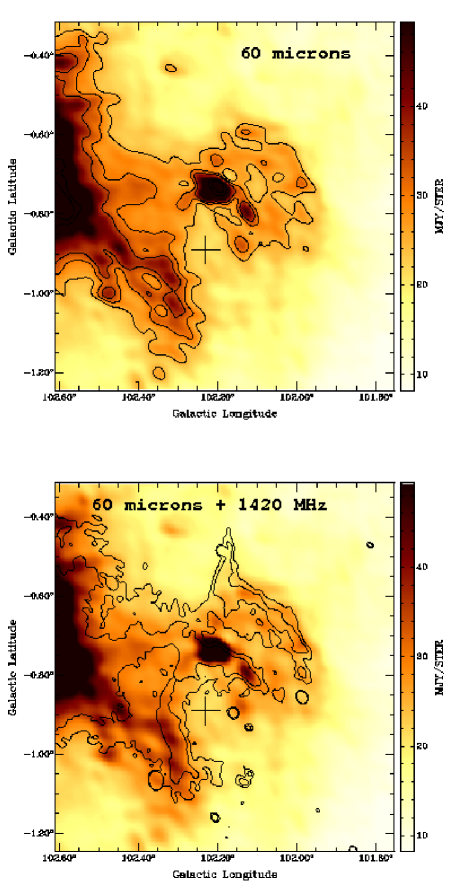
The distribution of the infrared emission at 60 m and its correlation with the radio emission at 1420 MHz is displayed in Fig. 3. The brighter sections of the inner shell are well detected in the far infrared. Emission from the outer feature is hardly detected. The far IR fluxes estimated for the ring nebula at 100 and 60 m are = 660130 Jy and = 340100 Jy, respectively. The quoted uncertainty was derived by using different values for the background emission.
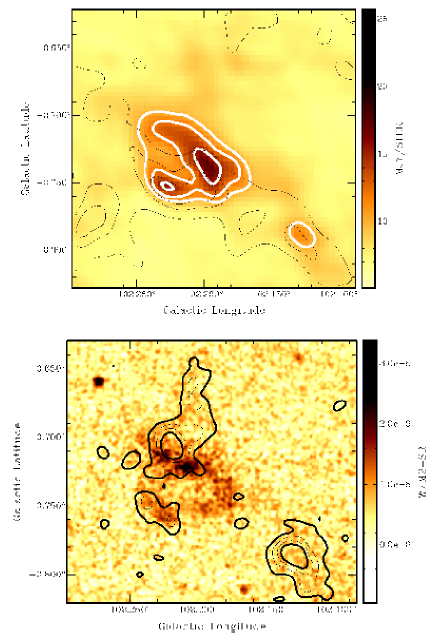
Particularly interesting is the strong and extended IR source located at = (10220, –073). The source is detected in the four IRAS bands. Its ring morphology is shown in the upper panel of Fig. 4, which displays an overlay of the emission at 25 m (color scale and white contours) and in the radio continuum at 1420 MHz (black contours). This IR source partially coincides with a strong radio emitting region. The extended IR source has a clear counterpart in the MSX band A, although the emission is faint (Fig. 4, bottom panel). Note that the brightest region at 8.3 m does not emit at 1420 MHz. Measured IR fluxes at 100, 60, 25, and 12 m are 12723, 533, 5.41.2, and 3.80.2 Jy, respectively. The estimated dust mass is 0.50.3 M⊙.
Following the procedure described by Cichowolski et al. (2001), we derived the color temperature of the dust associated with the ring nebula and the strong IR source. Taking into account different values for the background emission, we found similar dust color temperatures = 304 K for the ring nebula and the strong source. The range of temperatures corresponds to = 1-2, where the parameter is related to the dust absorption efficiency (). The dust temperature derived for both features is typical for Hii regions. The dust mass linked to the nebula is 21 M⊙.
3.3 Neutral gas distribution
| Fluxes | |||||||
| No. | (l,b) | Name | 12m | 25m | 60m | 100m | |
| ∘ | Jy | Jy | Jy | Jy | L⊙ | ||
| 1 | 102.122,–0.790 | 22135+5523 | 0.26 | 0.30 | 3.55 | 22.20 | 166 |
| 2 | 102.203,–0.723 | 22137+5529 | 0.91 | 0.80 | 20.75 | 74.75 | 705 |
| 3 | 102.440,–0.895 | 22158+5529 | 0.25 | 0.30 | 3.60 | 21.60 | 164 |
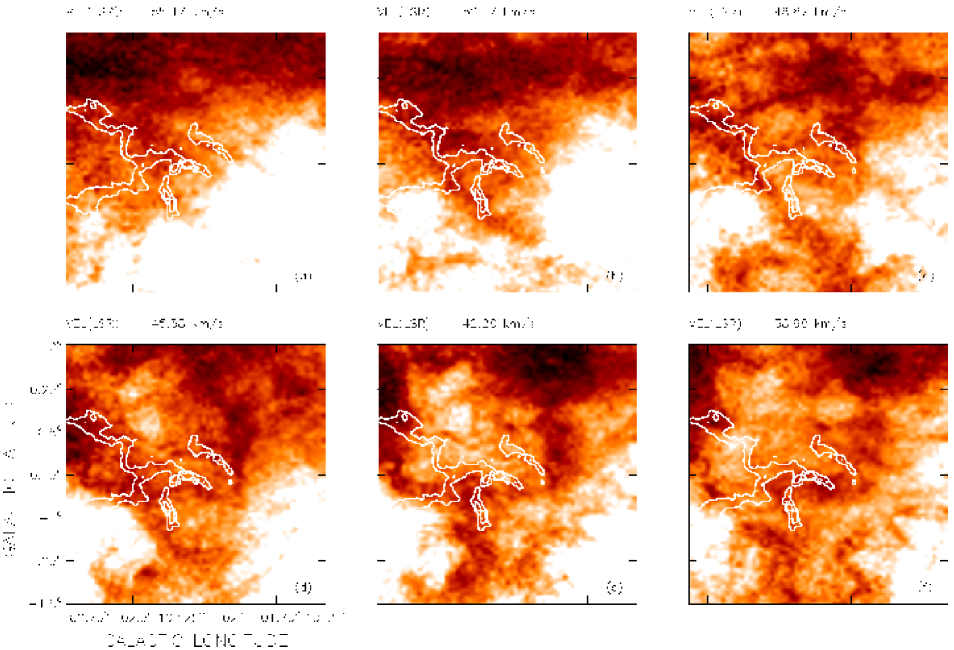
The analysis of the Hi datacube indicated that gas probably linked to the ring nebula is present in the velocity interval from –57 to –37 km s-1. Figure 5 displays overlays of the Hi emission within the velocity interval from –55.5 to –39.0 km s-1 (in color scale) and the radio continuum at 1420 MHz (contours). Each Hi image is the result of averaging the Hi emission within 3.3 km s-1.
The gallery of six Hi images was produced by removing the background in each channel map using DRAO software. The removed background was estimated as the average over the displayed image excluding a circular area of 28′ in radius centered on the WR star. An inspection of the images shows that the gas distribution is quite complex, showing several arc-like features.
The Hi emission in the range –47 to –39 km s-1 (Fig. 5d, e, and f) is characterized by the presence of a large cavity centered at = (10230, –050), encircled by an almost circular envelope. The structure is about 30′ in radius. The inner and outer rings linked to the WR star appear projected onto the weakest section of this large shell.
The images corresponding to the above mentioned velocity interval reveal the existence of neutral gas linked to the ring nebula. The presence of Hi emission encircling the inner shell is easily identified between –47 and –42 km s-1 near = (10235, –090) (Fig. 5d and e). This neutral gas forms a partial ring. The outer ring appears also bordered by Hi gas near = (10200, –060). Note the presence of gas projected inside the inner ring.
Hi emission in the velocity range from –52 to –49 km s-1 (Fig. 5b and c) is seen projected all over the area covered by the rings, being even observed inside the inner ring and in the region between the ionized rings. The partial Hi ring detected near = (10235, –090) (Fig. 5d and e) is also detected in this velocity interval. The emission extends towards = (10208, –117), beyond the ionized arcs. Enhanced Hi emission bordering the inner ring is also present at –55.5 km s-1 (Fig. 5a).
The complex Hi gas distribution between –47 and –39 km s-1 suggests the existence of two structures with similar velocity ranges partially superpossed in the line of sight: the large Hi shell centered at = (10230, –050) and the partial Hi rings linked to the ring nebula.
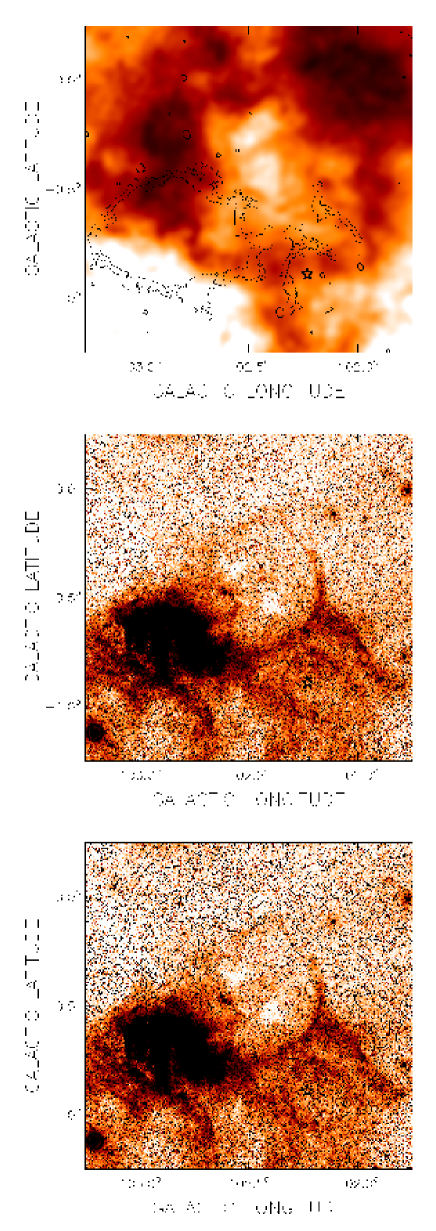
The large Hi shell and its correlation with the optical emission is shown in Fig. 6. The upper panel displays an overlay of the radio continuum emission at 1420 MHz (in contours) and the Hi emission between –47 and –37 km s-1 (in color scale). No background emission was removed from the Hi image displayed in this fugure. The middle panel displays the DSS2-R image of the same area, and the bottom panel shows an overlay of the optical image and the Hi image of the upper panel (in contours). The saturated region at = (10280, –070) in the optical image corresponds to the main body of the Hii region Sh2-132 (Vasquez et al. 2009). The optical filament detected between = (10240, –075) and = (10217, –035) and its faint extension towards –035 defines an almost complete ring-like structure coincident with the inner border of the large shell (see the bottom panel). Note that the brightest section of this filament corresponds to the outer ring. No background was removed from the Hi image displayed in this figure.
To summarise, gas clearly linked to the ring nebula is detected between –52 and –43 km s-1 (Figs. 5b to 5e), while small patches of Hi gas are detected beyond these values. The large Hi shell centered at = (10230, –050), of about 30′ in radius, has an optical counterpart and is detected from –47 to –37 km s-1 in Hi emission. Neutral atomic gas belonging to these structures is partially coincident in the line of sight.
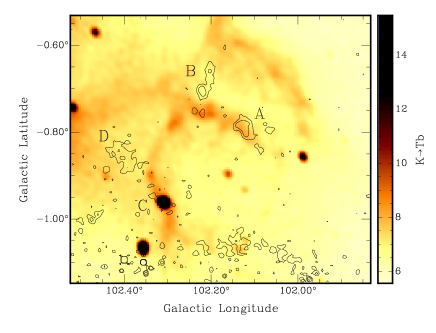
The distribution of the molecular gas was investigated using the 12CO(1-0) datacube, in the velocity interval from –105 to +24 km s-1. Within the area of interest, only a few patches of CO emission were detected within the velocity ranges from –63 to –47 km s-1, –30 to –28 km s-1, and –9 to –2 km s-1. Molecular gas having velocities –47 km s-1 is probably linked to the ring nebula. The integrated emission between –56.5 and –46.4 km s-1 is displayed in Fig. 7 superimposed onto the radio continuum emission. Only four molecular clumps are detected, and three of them coincide with the optical rings (clump A at = [10213, –080], clump B at = [10223, –070], and clump C at = [10232, –096]). Note also that CO clump D at = (10238, –085) and Clump B are projected onto regions of low radio continuum emission.
CO near clump B is probably associated with the IR extended source described in Sect. 3.2, as is suggested by the striking spatial correlation with the IR ring structure detected in the far and mid IR (see the bottom panel of Fig. 4). Note that the emission in MSX band A is enhanced towards the borders of Clump B at = (10221, –073). The presence of molecular emission in the region indicates that the emission in band A most probably originates in polycyclic aromatic hydrocarbons (PAHs), which can be found in photodissociation regions at the interface between ionized and molecular gas (e.g. Churchwell et al. 2006).
We searched for young stellar object (YSO) candidates in the IRAS, MSX, and 2MASS point source catalogues (Egan et al. 2003, Cutri et al. 2003). Following criteria by Junkes et al. (1992), only three IRAS point sources have infrared colors compatible with an YSO classification. Their galactic coordinates are listed in Table 2, along with their identifications, fluxes in the four IRAS bands, and IR luminosities, estimated following Yamaguchi et al. (1999).
It is worth mentioning that source 2 coincides with the extended IR source described above and with clump B. Source 1 appears projected onto clump A, while source 3 might be linked to Clump D. The presence of YSO candidates coincident with molecular clumps suggests that star formation is active in certain areas.
| Cloud | Area | mass | ||
|---|---|---|---|---|
| K km s-1 | 1020 cm-2 | pc2 | M⊙ | |
| A | 9.9 | 10.51.4 | 14.2 | 310 |
| B | 9.3 | 9.91.2 | 11.1 | 200 |
| C | 6.6 | 7.00.9 | 2.7 | 40 |
| D | 8.9 | 9.41.2 | 12.0 | 235 |
4 Discussion
4.1 The distance of the ring nebula and the large Hi shell
Since most of the physical parameters of the nebula depend on its distance, it is important to estimate its value. Based on the association of the WR star to Cep OB1, and adopting = 11.67 mag, and = 0.17 mag, van der Hucht (2001) places the star at a distance of 2.75 kpc, with an uncertainty of about 20%. This distance implies an absolute magnitude = –2.15 mag for the WR star, somewhat different from the adopted mean value for the subclass (in the range –3.9 to –2.8 mag, see table 24 by van der Hucht [2001]). A quite different spectrophotometric distance = 4.2 kpc can be estimated by adopting a mean value = 3.09 mag for WN3 stars and the same absorption = 1.6 mag (van der Hucht 2001).
As shown in Sect. 3.3, Hi gas related to the ring nebula around HD 211564 is present in the velocity range from –52 to –43 km s-1, with a mean velocity of –47 km s-1. Molecular gas probably related to the inner structure has velocities in the range from –49.4 to –46.4 km s-1. Thus, a systemic velocity = –472 km s-1 for the neutral features related to the star seems appropriate.
The analytical fit to the circular galactic rotation model taking into account non-circular motions (Brand & Blitz 1993) predicts that gas having velocities of –47 km s-1 should be placed at a kinematical distance of 3.5 kpc. This value is, within errors, compatible with the derived stellar distance. As a consequence, we adopt 3.51.0 kpc as the distance to the WR star and the surrounding structure. At this distance, the inner and outer ionized rings have linear radii of 8.32.4 pc and 15.44.4 pc, respectively.
Hi gas belonging to the large shell has velocities in the range –46 to –38 km s-1, rather similar to the velocity of the gas linked to the ring nebula, suggesting a similar distance. As a working hypothesis, we adopt a distance of 3.51.0 kpc for the large shell. At this distance, this shell is 31 pc in radius.
4.2 Scenario
Given the observed morphology, a possible scenario to explain the presence of two concentric ionized structures is that the inner and outer rings have been formed by the action of the stellar winds from different evolutionary phases of the star, as proposed by García-Segura & Mac Low (1995) for NGC 6888. Such a scheme has proved to explain the gas distribution in a number of stellar wind bubbles showing double structures (e.g. the ring nebulae around WR 16 and WR 85, Marston 1995).
However, the presence of neutral atomic gas observed between the inner and outer rings, and bordering the inner ring, seems to conspire against such an interpretation for the case of HD 211564. An alternative explanation is that both rings form only one structure, with its main axis nearly along the line of sight. This scenario is compatible with the detection of gas seen in projection between both rings.
Here, we propose that the stellar wind bubble associated with HD 211564 is evolving in the neutral gas envelope of the large shell centered at = (10230, –050). Support to this interpretation comes from the fact that the outer ring near = (10230, –070) appears arched, suggesting that it is being pushed from larger galactic longitudes and higher galactic latitudes. In this context, the section of the outer ring near (10225, –060) would be the result of the interaction of both structures. The fact that the ring nebula is detected towards the fainter region of the large Hi shell and the presence of Hi gas bordering the outer ring at = (10200, –060) reinforces the interpretation that the interstellar bubble is evolving in the compressed envelope. In this scenario, part of the Hi gas seen inside the inner ring and between the outer and inner rings might be linked to the large shell. The fact that the large shell and the interstellar bubble have similar velocities makes it difficult to clearly identify Hi gas belonging to each individual structure.
Note that the ionized rings are detected where gas of the Hi envelope centered at (10235, –050) is present, i.e. where the ambient density is relatively high, in agreement with previous findings by Nazé et al. (2001) for bubbles in the LMC.
4.3 Physical parameters of the nebula
We now estimate the main physical parameters of the bubble associated with HD 211564 bearing in mind the proposed scenario. Thus, we assume that the outer and inner rings form only one structure with the radius of the outer ring, i.e. 16.34.6 pc.
The parameters of the ionized gas were derived from the image at 1420 MHz. Electron densities and Hii masses were obtained from the expressions by Mezger & Henderson (1967) for a spherical Hii region of constant electron density (rms electron density ). The presence of He ii was accounted for by multiplying the Hii mass by 1.27. The rms electron density and ionized mass are 3.5 cm-3 and 2000 M⊙, respectively. Errors of 30% and 60% in the electron density and in the ionized mass come from the distance uncertainty.
The distribution of ionized gas, as shown both by the optical and radio emissions, suggests filling factors in the range = 0.05-0.12 (estimated assuming a spherical bubble of outer radius equal to 16.3 pc, and that 10 to 25% of the surface is covered by plasma). By applying these factors, electron densities and ionized masses are 10-16 cm-3 and 450-700 M⊙, respectively.
The number of UV photons necessary to ionize the gas in the inner and outer rings, as derived from radio continuum emission, is = 48.2, lower than the UV photon flux emitted by the WR star ( = 49.2, Crowther 2007). We can conclude that the WR star can maintain the ionization of the rings. The difference between the two values is consistent with the fact that a large number of UV photons may escape from the bubble through the patchy neutral envelope and/or are absorbed by dust grains mixed with the ionized gas.
An important point to discuss in connection with the radio continuum emission is the fact that the derived spectral indices seem to deviate from typical values for thermal emission. If the large values of spectral index found for some regions (e.g., Fig. 2b) are genuine, this could imply that there are regions where the thermal emission is approaching the optically thick regime. The relative faintness of the emission however militates against such an interpretation, unless the radio continuum emission originates from regions considerably smaller than the observing beam.
If the emitting regions are in the form of small clumps of typical angular size , or of thin filaments of angular thickness , beam smearing or dilution will cause the emitted regions to have an observed emission measure smaller than the true emission measure by a factor where for clumps and for filaments, and and are the beam angular area and beam angular diameter, respectively. The resolution at 1420 MHz is about 1′ so that, writing as the typical angular size in arcmin, we simply have and for clumps and filaments, respectively.
The brightness temperature due to optically thin bremstrahlung or free-free emission is given by where and are the electron temperature and free-free optical depth, the latter given by (e.g., Mezger & Henderson 1967, Chaisson 1976):
| (1) |
where is the Gaunt factor (about unity for our purposes) and the emission measure is in . Setting in the above equation, and taking and , the relation between the turnover frequency (in GHz) and free-free emission measure is given by . A turnover at 1 GHz then corresponds to an emission measure of .
The observed emission measure is given in terms of the free-free brightness temperature by which, for , gives for and . The required beam dilution factor is thus of the order of 400. To relate this factor to the typical size of clumps or thickness of filaments, we note that the linear size of a structure in pc is related to its angular size in arcmin by the relation , where is the source distance in kpc. For the assumed distance of 3.5 kpc, this relation reduces simply to . We thus obtain = 0.05 for clumps and for filaments.
To estimate the neutral atomic mass we took into account the Hi gas with velocities between –52 to –43 km s-1 projected onto the region of the nebula. This velocity interval corresponds to the range in which Hi gas linked to the nebula can be more clearly identified. We assumed that the gas is optically thin and included a He abundance of 10%. The derived neutral gas mass is 5900 M⊙. Uncertainties are about 70%.
The column density and the molecular mass of the cloudlets were estimated from the 12CO data, making use of the empirical relation between the integrated emission (= and . We adopted = (1.060.14) WCO 1020 cm-2 (K km s-1)-1, obtained from -ray studies of molecular clouds in the Orion region (Digel et al. 1995). The integrated emission, column density, area, and the molecular mass of each cloudlet are listed in Table 3.
The small amount of molecular gas in the whole region suggests that either little molecular material was present in the region when the massive star formed or most of the molecular gas was photodissociated and ionized by the strong UV stellar flux. The presence of these small molecular clouds is compatible with the poor signs of stellar formation in the region.
The ambient density derived by distributing the ionized, neutral atomic and molecular mass (5900 M⊙) over a sphere of 16.3 pc in radius is 14 cm-3. This value, higher than that of the typical interstellar medium, is compatible with the suggestion that the interstellar bubble evolved in a neutral expanding shell formed by compressed gas.
To verify whether HD 211564 can provide the energy to blow the interstellar bubble, we estimated the mechanical energy released by the massive star into the ISM during the dynamical age of the bubble and compared it to the kinetic energy of the structure.
The kinetic energy of the interstellar bubble = was derived adopting an expansion velocity of 9 km s-1 (based on the velocity range of the associated Hi gas), and assuming that the total mass related to the bubble (ionized, neutral atomic, and molecular) amounts to 5900 M⊙. The kinetic energy is 4.81048 erg.
The dynamical age of a wind blown bubble can be estimated as = 0.5610 yr (McCray 1983), where is the radius of the bubble (pc), is the expansion velocity (km s-1), and the coefficient is the deceleration parameter. Adopting = 16.3 pc and = 9 km s-1, = 1106 yr. Large uncertainties are involved in this result.
The stellar wind mechanical energy ) released by the WR star can be estimated from the stellar wind parameters. Since we cannot discard that the wind of the O-type star progenitor of the present WR star has contributed to the formation of the bubble, we take into account the contribution of the star during the WR and main sequence phases. The contribution during the WR phase can be derived adopting the stellar wind parameters listed in Sect. 1 ( 510-6 M⊙ yr-1 and = 2000 km s-1), and assuming that this stellar phase lasts 0.5106 yr, compatible with the lifetime of the WR phase of a massive star (Meynet & Maeder 2005). results to be 1.01050 erg. To estimate the contribution during the main sequence phase, we adopt mean stellar wind parameters for O-type stars, i.e. = 210-6 M⊙ yr-1, = 2000 km s-1 (Prinja et al. 1990, Mokiem et al. 2007), and assume that the stellar wind acted during at least 3106 yr. The wind mechanical energy released during the main sequence phase of the star is then 1.41050 erg. Consequently, we adopt 2.41050 erg as the total energy released through stellar winds.
The energy conversion efficiency (= /) = 0.02 is compatible with a stellar wind origin for the ring nebula. Uncertainties in this estimate originate from the input stellar wind energy (i.e. the mass loss rates and terminal velocities), the adopted age of the bubble (which depends on the expansion velocity and the expansion law of the bubble), and the kinetic energy (which includes masses and expansion velocity).
The derived values are similar to estimates for other stellar wind bubbles (e.g., Cappa 2006). They are in agreement with predictions from recent numerical simulations from Freyer et al. (2003, 2006). These authors take into account the action of the stellar wind and the ionizing flux from stars of 35 and 60 M⊙ on the surrounding gas as they evolve from the main sequence stage to the presupernova phase, and investigate the “missing wind problem”. From their simulations, they find / 0.10-0.04 for stars with 35 and 60 M⊙, respectively. Among the additional solutions for the “missing wind problem” in superbubbles listed by Butt & Bykov (2008), the presence of a blowout, in which the hot gas and the energy can spew out from the bubble (Cooper et al. 2004) can clearly apply to the present case.
4.4 The large Hi shell
Assuming a distance of 3.5 kpc for the large shell, the associated neutral atomic mass amounts to about 104 M⊙. The analysis of the CO datacube reveals that a small amount of molecular gas may be associated with the shell, indicating that the large shell evolved in a region with an ambient density of about 3 cm-3.
The kinetic energy and the dynamical age estimated adopting an expansion velocity of 6-9 km s-1 is (4-8)1048 erg and (1.9-2.6)106 yr, respectively.
As regards the origin of the Hi shell, we note that, for an energy conversion efficiency of 0.10, an O-type star with stellar wind parameters = 210-6 M⊙ yr-1 and = 1500 km s-1 might provide the energy to create the observed structure. However, no O-type star has been detected towards the inner part of the large shell.
5 Summary
In this paper we have analyzed the distribution of the ionized and neutral gas, as well as the dust particles, in the surroundings of the WR star HD 211564, located at about 3.5 kpc.
The radio continuum data shows that the ring nebula related to HD 211564 has a clear radio counterpart. Two concentric rings of about 9′ and 16′ in radius are well identified at 1420 MHz. The spectral index of the radio continuum emission has been estimated in several regions of the nebula using the TT-plot method. We have found that the spectral index shows significant variations and that it slightly deviates from the typical value expected for Hii regions, suggesting the presence of small and dense clumps of ionized gas which are optically thick at 1420 MHz. The analysis of the available radio continuum data has enable us to estimate some parameters that characterize the Hii region. Considering a filling factor in the range 0.05-0.12, we obtained ionized masses of 450-700 M⊙, and electron densities of 10-16 cm-3.
The analysis of the infrared emission shows that the brighter sections of the inner ring are well detected in the far infrared, while the outer ring is hardly identified. A strong IR source, detected in the four IRAS bands, is observed at () = (10220, –073). This source presents a ring morphology and is also detected in the MSX Band A.
An inspection of the Hi images suggests that the cavity blown by HD 211564 is evolving in the border of an expanding shell of about 30′ in radius, centred at = (10230, –050). This large structure is observed in the velocity interval from –47 to –39 km s-1. On the other hand, Hi emission probably related to the ring nebula is present in the velocity range from –52 to –43 km s-1. The fact that both structures are partially observed at the same velocities, together with their observed morphologies, suggest that both structures are interacting. The derived neutral gas mass related to the ring nebula is 5900 M⊙.
Molecular gas probably linked to the ring nebula is observed in four small clouds. We have found three YSO candidates associated with molecular clouds. An energetic analysis shows that HD 211564 emits enough ionizing photons to keep the gas ionized and heat the dust, and that its stellar wind is sufficient to explain the formation of the observed features.
6 Acknowledgements
We thank C. Brunt and M.H. Heyer for making their CO data available in advance of publication. Provision of the CO data was supported by NSF grant AST0838222. We acknowledge the anonymous referee for her/his comments. This project was partially financed by the Consejo Nacional de Investigaciones Científicas y Técnicas (CONICET) of Argentina under projects PIP 112-200801-02488 and PIP 112-200801-01299, Universidad Nacional de La Plata (UNLP) under project 11/G093, Universidad de Buenos Aires under project UBACyT X482, and Agencia Nacional de Promoción Científica y Tecnológica (ANPCYT) under projects PICT 00812 and 2007-00902. The Digitized Sky Survey (DSS) was produced at the Space Telescope Science Institute under US Government grant NAGW-2166. This work was partly (S.P.) supported by the Natural Sciences and Engineering Research Council of Canada (NSERC) and the Fonds FQRNT of Québec. The DRAO Synthesis Telescope is operated as a national facility by the National Research Council of Canada. The CGPS is a Canadian project with international partners and is supported by grants from NSERC. Data from the CGPS is publicly available through the facilities of the Canadian Astronomy Data Centre (http://cadc.hia.nrc.ca) operated by the Herzberg Institute of Astrophysics, NRC.
References
- Becker (1991) Becker, R.L. 1991, ApJS, 75, 1
- (2) Benjamin, R.A., Churchwell, E., Babler, B.L., Bania, T. M., Clemens, D.P., Cohen, M., Dickey, J.M., et al. 2003, PASP, 115, 953
- (3) Brand J., Blitz L. 1993, A&A, 275, 67
- (4) Butt, Y.M., Bykov, A.M. 2008, ApJL, 677, 21
- Cappa (2006) Cappa C.E. 2006, RMxAC, 26, 9
- Cappa et al. (2004) Cappa C., Goss W. M., Pineault S., 2002, AJ, 123, 3348
- Chaisson (1976) Chaisson, E.J. 1976 in Frontiers of Astrophysics, edited by E.H. Avrett, Cambridge: Harvard Univ. Press, p. 259
- Chu (1981) Chu, Y.-H. 1981, ApJ, 249, 195
- (9) Chu, Y.-H., Treffers, R. R., Kwitter, K. B. 1983, ApJS, 53, 937
- Churchwell et al. (2006) Churchwell, E., Povich, M.S., Allen, D., Taylor, M.G., Meade, M.R., Babler, B.L., Indebetow, R., et al. 2006, ApJ, 649, 759
- (11) Cichowolski, S., Pineault, S., Arnal, E. M., Testori, J. C., Goss, W. M., Cappa, C. E. 2001, AJ, 122, 1938
- (12) Condon, J.J., Broderick, J.J., Seielstad, G.A., Douglas, K., Gregory, P.C. 1994, AJ, 107, 1829
- (13) Condon, J.J., Cotton, W.D., Greisen, E.W., Yin, Q.F., Perley, R.A., Taylor, G.B., & Broderick, J.J. 1998, The NRAO VLA Sky Survey, AJ, 115, 1693
- (14) Cooper, R.L., Guerrero, M.A., Chu, Y.-H., Chen, C.-H. Rosie, Dunne, B.C. 2004, ApJ, 605, 751
- Crowther (2007) Crowther, P.A. 2007, Annu. Rev. Astron. Astrophys., 45, 177
- (16) Cutri, R.M., Skrutskie, M.F., van Dyk, S., et al. 2003, The IRSA 2MASS All-Sky Point Source Catalog, NASA/IPAC Infrared Science Archive
- Digel et al. (2002) Digel S.W., Hunter S.D., Mukherjee, 1995, ApJ, 441, 270
- Douglas (1996) Douglas, J.N. 1996, AJ, 111, 1945
- Egan et al. (2003) Egan M.P. et al.. 2003, Air force Research Laboratory Technical Report AFRL-VS-TR-2003-1589 (V/114)
- Felli & Churchwell (1972) Felli, M., & Churchwell, E. 1972, A&AS, 5, 369
- (21) Freyer, T., Hensler, G., Yorke, H.W. 2003, ApJ, 594, 888
- (22) Freyer, T., Hensler, G., Yorke, H.W. 2006, ApJ, 638, 262
- (23) Frst E., Reich W., Reich P., Reif K.,1990, A&AS, 85, 61
- Gregory (1991) Gregory, P.C. 1991, ApJ, 575, 1011
- Hamann & Koesterke (1998) Hamann, W.-R., & Koesterke, L. 1998, A&A, 333, 251
- (26) Harten, R. H., Felli, M., Tofani, G. 1978, A&A, 70, 205
- Heckathorn et al. (1982) Heckathorn, J.N, Bruhweiler, F.C., & Gull, T.R. 1982, ApJ, 252, 230
- (28) Heyer, M.H., Brunt, C., Snell, R.L., Howe, J.E., Schloerb, F.P., Carpenter, J.M. 1998, ApJS, 115, 241
- van der Hucht (2001) van der Hucht K. 2001, New Astronomy Rev., 45, 135
- (30) Junkes N., Fürst E., Reich W., 1992, A&AS, 261, 289
- Langston et al. (2000) Langston, G., Minter, A., D’Addario, L., Eberhardt, K., Koski, K., Zuber, J. 2000, AJ, 119, 2801
- Lndstron & Stenholm (1984) Lundstrom I., Stenholm B., 1984, A&AS, 58, 163
- Maeder (1983) Meynet, G., Maeder A. 2005, AA, 429, 581
- (34) McCray, R. 1983, Highlights of Astron., 5, 567
- Marston (1996) Marston, A.P. 1995, AJ, 109, 1839
- Marston et al. (1994) Marston, A.P., Chu, Y.-H., & Garcia-Segura, G. 1994, ApJS, 93, 229
- Marston et al. (1995) Marston, A.P., Yocum, D.R., Garcia-Segura, G., & Chu, Y.-H. 1995, ApJS, 95, 151
- Miller & Chu (1993) Miller, G.J., & Chu, Y.-H. 1993, ApJS, 85, 137
- (39) Mezger P. G., Henderson A. P., 1967, ApJ, 147, 471
- (40) Mokiem, M.R., de Koter, A., Vink, S.J., Puls, J., Evans, C.J., Smartt, S.J., Crowther, P.A., Herrero, et al. 2007, A&A, 473, 603
- (41) Nazé, Y., Chu, Y.-H., Points, S.D., Danforth, C.W., Rosado, M., Rosie Chen, C.-H. 2001, ApJ, 122, 921
- Niedzielski & Skorzynski (2002) Niedzielski, A., & Skórzyński, W. 2002, Acta astron. 52,
- Oey (1996) Oey M.S., 1996, ApJ, 467, 666
- (44) Price, S.D., Egan, M.P., Carey, S.J., Mizuno, D., Kuchar, T. 2001, A&A, 121, 2819
- (45) Prinja, R. K., Barlow, M. J., & Howarth, I. D. 1990, ApJ, 361, 607
- Rochowicz & Niedzielski (1995) Rochowicz,K., & Niedzielski, A. 1995, Acta Astron., 45, 307
- Smith et al. (1996) Smith L.F., Shara, M.M., & Moffat, A.F.J. 1996, MNRAS, 281, 163
- Taylor et al. (2003) Taylor, A.R., Gibson S.J., Peracaula M., Martin P.G., Landecker T.L., Brunt C.M., Dewdney P.E., Dougherty S.M., Gray A.D., Higgs L.A., Kerton C.R., Knee L.B. G., Kothes R., Purton C.R., Uyaniker B., Wallace B.J., Willis A.G., & Durand D., 2003, AJ, 125, 3145
- Vasquez et al. (2009) Vasquez J., Cappa C., Pineault, S., Duronea, N.U. 2009, in preparation
- (50) Watson, C.; Povich, M. S.; Churchwell, E. B.; Babler, B. L.; Chunev, G.; Hoare, M.; Indebetouw, R.; Meade, M. R.; Robitaille, T. P.; Whitney, B. A. 2008, ApJ, 681, 1341
- (51) Watson, C.; Corn, T.; Churchwell, E. B.; Babler, B. L.; Povich, M. S.; Meade, M. R.; Whitney, B. A. 2009, ApJ, 694, 546
- (52) Yamaguchi, R., Saito, H., Mizuno, N., Mine, Y., Mizuno, A., Ogawa, H., & Fukui, Y. 1999, PASJ, 51,791