Twist/Writhe Partitioning in a Coarse-Grained DNA Minicircle Model
Abstract
Here we present a systematic study of supercoil formation in DNA minicircles under varying linking number by using molecular dynamics simulations of a two-bead coarse-grained model. Our model is designed with the purpose of simulating long chains without sacrificing the characteristic structural properties of the DNA molecule, such as its helicity, backbone directionality and the presence of major and minor grooves. The model parameters are extracted directly from full-atomistic simulations of DNA oligomers via Boltzmann inversion, therefore our results can be interpreted as an extrapolation of those simulations to presently inaccessible chain lengths and simulation times. Using this model, we measure the twist/writhe partitioning in DNA minicircles, in particular its dependence on the chain length and excess linking number. We observe an asymmetric supercoiling transition consistent with experiments. Our results suggest that the fraction of the linking number absorbed as twist and writhe is nontrivially dependent on chain length and excess linking number. Beyond the supercoiling transition, chains of the order of one persistence length carry equal amounts of twist and writhe. For longer chains, an increasing fraction of the linking number is absorbed by the writhe.
.1 Introduction
Conformational features and mechanical properties of DNA in vivo (such as supercoil formation, bend/twist rigidity) play an important role in its packing, gene expression, protein synthesis, Luger et al. (1997); Halford and Marko (2004) protein transport, Elf et al. (2007) etc. Advances in single-molecule probing and monitoring techniques in the last decade have provided new opportunities for detailed analysis of such mechanical and structural properties. The mechanical response of single DNA molecules, Strick et al. (2000); Mathew-Fenn et al. (2008) the lifetime of denaturation bubbles, Altan-Bonnet et al. (2003) and the details of supercoil formation Fogg et al. (2006); Forth et al. (2008) can now be investigated. These new experimental findings also triggered renewed theoretical interest in DNA physics. Norouzi et al. (2008); Bar et al. (2007); Alim and Frey (2007); Baiesi and Livi (2009); Rudnick and Bruinsma (2002); Kabakçıoğlu et al. (2009)
The degree of supercoiling in DNA depends on various tunable parameters, such as the linking number, external torque and salt concentration. These parameters essentially modify the molecule’s relative preference for twisting vs writhing. DNA minicircles provide a convenient setting where mechanical properties, such as the asymmetry of the molecule under positive and negative supercoiling, the possibility of torsion-induced denaturation and kink formation can be studied both experimentally Fogg et al. (2006) and theoretically. Harris et al. (2008); Liverpool et al. (2008); Trovato and Tozzini (2008) Despite steady progress in the field in recent decades, a full comprehension of these phenomena is still ahead of us. Analytical models have been successful in explaining many qualitative aspects of DNA mechanics, however, they are typically too simplistic to capture fine details, especially in the short chain limit. Furthermore, their treatment gets difficult in the presence of thermal fluctuations and nonlinearities.
Computer simulations provide a wealth of information on short DNA chains. State of the art full-atomistic simulations are capable of microsecond scale simulations of short DNA oligomers. Perez et al. (2007) Simulations of DNA oligomers have been successfully used to construct a database Dixit et al. (2005) analogous to the crystal structure database. Beyond oligomeric DNA molecules, full-atomistic simulations have also been performed for DNA minicircles. Harris et al. (2008) However, they are short of providing a through exploration of the conformational space even for minicircles as small as - basepairs (bps).
In recent years a number of coarse-grained models have been proposed to study the conformational and mechanical features of DNA at intermediate length scales. Drukker and Schatz (2000); Knotts et al. (2007); Trovato and Tozzini (2008); Sambriski et al. (2009) These models are typically generated in an ad-hoc manner with tuning parameters to match some of the key features of DNA, such as the pitch, persistence length, melting temperature, and sequence specificity. Drukker&Schatz Drukker and Schatz (2000) studied DNA denaturation of short B-DNA oligomers (- bps) using a two-bead model and no major and minor grooves. Knotts et al. Knotts et al. (2007) introduced a three-bead model to study the melting dynamics in chains of length bps. Their model also yields a persistence length of nm compared to the experimentally measured value of nm. A more recent model Sambriski et al. (2009) where they study DNA renaturation events is also tuned to reproduce the persistence length. Trovato et al. recently proposed a single-bead model to study thermal melting that also exhibits major and minor grooves. In simulations of and bps long DNA chains, they demonstrated supercoiling and denaturation using one sample with positive and negative torsional stress for each length. Here, we present our results on the twist/writhe partitioning using a novel coarse-grained DNA minicircle model. Using this model we perform a systematic study of the supercoiling behavior of DNA, and in particular we investigate the equilibrium amounts of twist and writhe accommodated by the chain as a function of the applied torsional stress and the chain length.
Unlike earlier G-like approaches, the model parameters are extracted from full-atomistic DNA simulations via Boltzmann inversion, with no fitting for structural or mechanical properties. With only two beads the model captures most structural details of DNA, such as:
-
•
the helicity and the pitch,
-
•
backbone directionality,
-
•
major and minor groove structure which results in the anisotropic bending rigidity,
-
•
persistence length.
The accuracy of our coarse-grained model is mostly limited by the accuracy of the force-field used in the full-atomistic DNA simulations. The coarse-graining method employed here can be extended in a straightforward manner to include further details, such as basepair specificity, hybridization, and explicit charges. However, setting the efficiency of the model as the priority for mesoscale simulations, we postpone these extensions to a future study. In the next sections, we outline the model and then present our results on the twist/write partitioning in DNA minicircles.
.2 Model
.2.1 Coarse-graining procedure
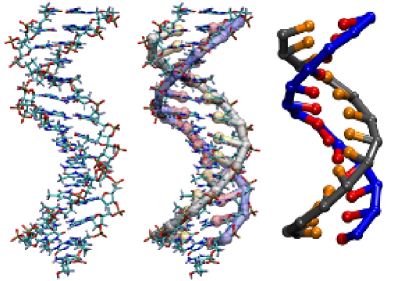
The model is composed of two types of “superatoms” and per nucleotide, representing the collective motion of the backbone phosphate group + sugar (P) and the nucleic acid base (B) as depicted in Fig. 1. Since a realistic description of the helical structure is sought within a minimalist setting the superatoms are considered generic, with no base specificity. The extension to four different bases is straightforward with an approximately 4-fold increase in the number of model parameters. Above simplification is compensated by choosing the superatom positions optimally, with the criterion that the equilibrium distributions associated with the degrees of freedom of -superatoms have maximal overlap when they are calculated for purines ( and ) and pyrimidines ( and ) separately. This condition is best met when the Cartesian coordinates of superatoms are chosen as the center of mass of the atoms { O3’, P, O1P, O2P, O5’, C4’, O4’, C1’, C3’, C2’ }, while superatoms are placed at the center of mass of the atoms {N9, C8, N7, C5, C6, N3, C4} for purines and { N1, C6, C5, C4, N3, C2} for pyrimidines.
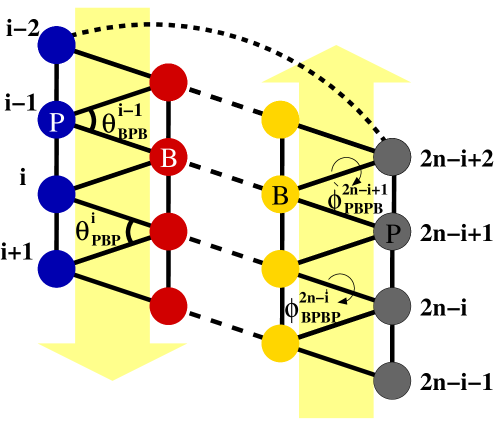
Fig. 2 shows the coarse-grained model composed of the superatoms P and B and the adopted indexing convention for the two strands.
.2.2 Interactions
The effective interactions incorporated into the model are shown in Fig. 2. We use four bonded and two dihedral potentials that maintain the local single-strand geometry:
-
•
harmonic bonds , , and that fix the intra-strand superatom distances as well as the angles and ,
-
•
dihedral potentials associated with the angles and .
All four harmonic bond potentials have the form
| (1) |
where the stiffnesses, , and the equilibrium bond lengths, , differ as listed in Table 1. In particular, the difference between and bond parameters reflects 5’-3’ directionality of the molecule. The choice of harmonic bond potentials and over true angular potentials increases computational efficiency without significantly distorting the equilibrium distributions, as verified in Fig. 3 for the BPB bond angle.
The torsional stiffness of the dihedral angles and defined, respectively, by the superatoms and is modeled by the potential,
| (2) |
where, again, the two stiffness coefficients, , for and dihedral angles and their equilibrium values, , are separately determined from the full-atomistic simulation data as described below.
In addition to the intra-strand interactions above, we define two inter-strand potentials that stabilize the double-stranded structure. First is a tabulated potential connecting the pairs and reflects the hydrogen bonding between the nucleic-acid bases A-T and G-C (again, base specificity is omitted at this stage). The use of a tabulated potential may facilitate monitoring base-pair breaking events in future studies. The second inter-strand interaction takes into account the steric hinderence of the base atoms and the electrostatic repulsion of the phosphate groups through a repulsive potential between the superatoms and . This interaction also helps maintain the directional nature of the hydrogen bonding between the base pairs, which in our model is displayed by the alignment of the superatoms , , , and . Functional forms of both interactions are discussed in the next section.
Finally, a Lennard-Jones excluded-volume potential between all superatom pairs (except ) that do not interact via previously defined potentials maintains the self-avoidance of the DNA chain.
.2.3 Determination of the force constants
The force constants and the equilibrium values for bond and dihedral potentials are obtained from the thermal fluctuations of the associated superatoms via Boltzmann inversion. Reith et al. (2003) The fluctuation data is obtained from molecular dynamics (MD) trajectories of a full-atomistic study by Dixit et al. Dixit et al. (2005) The full-atom MD data includes room-temperature simulations of all possible tetramers of the nucleic-acid bases located at the center of a bps long B-DNA oligomers. Since our model does not include base-pair specificity, all tetramer data was given equal weight throughout our analysis.
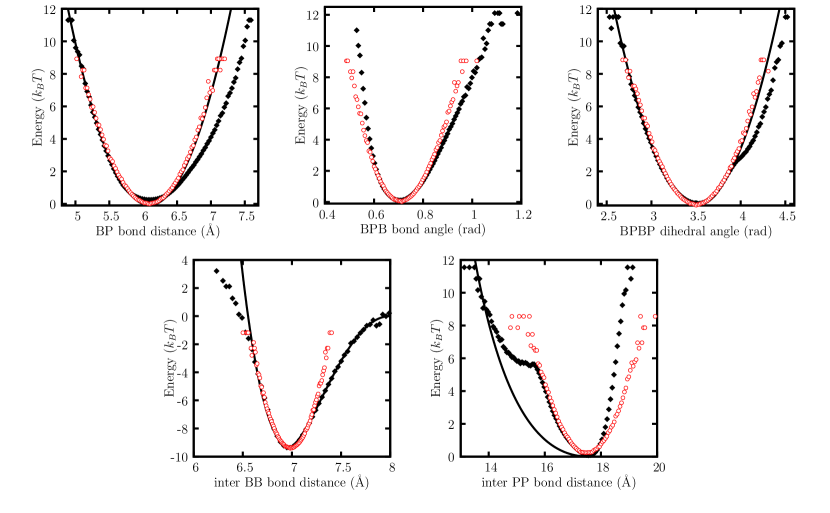
Boltzmann inversion of the probability distributions for each type of bond length, bond angle, and dihedral angle (obtained from the thermal fluctuations of superatom centers) yields potentials of mean force (PMF) which are shown with solid diamond symbols in Fig. 3.
These PMF curves are used to obtain the force constants for the intra-strand bonded interactions by means of harmonic fits. The fits obtained for , and are shown with solid-black lines in Fig. 3 and the force constants obtained by these fits are listed in Table 1. The anharmonic features in PMF curves can be captured using more sophisticated potentials, which could be implemented if a more specific model is desired.
| Interaction Type | Equilibrium Position | Force Constant |
|---|---|---|
| bond | =5.45 Å | =7.04 |
| bond | =6.09 Å | =16.14 |
| bond | =6.14 Å | =20.36 |
| bond | =4.07 Å | =15.93 |
| dihedral | =3.62 rad | =25.40 |
| dihedral | =3.51 rad | =27.84 |
Also shown in Fig. 3 are the PMF curves for the inter-strand bond distances between and , where a strong asymmetry is evident in both. The interaction among superatoms stems from the hydrogen bonds as discussed above, and displays an equilibrium separation. The interactions is incorporated into the model via a tabulated potential, which is obtained by a smooth curve fit to the PMF data.
The PMF curve also displays an equilibrium separation. Unlike the interaction, here we only model the repulsive part of this interaction via a tabulated potential. The attractive part is already captured by the previously discussed potentials, as we will discuss below.
The excluded volume of the superatoms is represented via repulsive Lennard-Jones interactions,
| (3) |
measured in units of . For all B-B and B-P pairs and , whereas for all P-P pairs these values are doubled. Superatom pairs that are bonded and all pairs are excluded from these Lennard-Jones interactions. The constants and exclusions for these Lennard-Jones interactions are chosen such that intra- and inter-strand interactions previously defined are not influenced when the Lennard-Jones interactions are switched on.
The coarse-grained model potential does not include any explicit electrostatic interactions, therefore strictly speaking this model is suitable for high salt concentrations.
.2.4 MD simulation
ESPResSo package Limbach et al. (2006) was used for all coarse-grained MD simulations with the Langevin thermostat at room temperature. All super-atoms were assumed to have the same mass roughly equivalent to 170 atomic mass units. The length and energy units were set to 1 Å and (= K), respectively, from which the unit time () can be determined by dimensional analysis to be approximately 7 fs. The equations of motion were integrated by using the velocity Verlet algorithm with a time-step of 0.015 .
We simulated both linear and circular DNA chains. The initial configurations were chosen as their respective ground-states obtained through over damped MD simulations. The data collection was performed after thermal equilibration, where the required equilibration time depended on the measured quantity. For example, the equilibrium distributions for the degrees of freedom of the coarse-grained model (Fig. 3) took approximately 10 CPU minutes on an Intel Quad-Core machine using a single processor, whereas thermal averages of the writhe and the twist (Fig. 6) for the longest circular DNA we considered required upto 64 CPU weeks using 8 processors in parallel. MD trajectories are visualized by VMD package. Humphrey et al. (1996)
.2.5 Equilibrium Properties
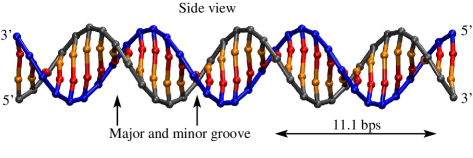
The ground-state structure of the molecule is shown in Fig. 4. Despite the fact that only two beads are used for each unit, the model successfully captures most of the essential features of the DNA molecule. The directionality of the strands is reflected in the differences between the force constants for BP vs. PB bonds and PBPB vs. BPBP dihedral angles. The double helical structure with major and minor grooves is also captured. The helical pitch (the method of calculation is discussed further below) is 11.4 bps in ground state and drops to 11.1 bps at room temperature, suggesting an anharmonic twist rigidity which is a complex function of the model potentials given above. The reason for the somewhat higher helical pitch we find here in comparison with the actual DNA is discussed at the end of this section.
We tested the derived coarse-grained potentials by performing an MD simulation of a 36 bps long linear chain. The resulting Boltzmann inverted distributions of the bond lengths, bond angles and dihedral angles are shown with open red circles in Fig. 3. The distributions associated with intra-strand interactions nicely match the potentials used, which themselves are the best harmonic fits to the corresponding full-atomistic data. The fact that the given potentials are recovered from the thermal fluctuations of the superatoms suggests that the degrees of freedom used in the coarse-grained Hamiltonian are minimally coupled. Also shown in Fig. 3 is the inverted form of the BPB bond angle distribution (top row, in the middle). The agreement between the full-atomistic (filled black diamonds) and the coarse-grained (open red symbols) simulation results is observed also for other angular potentials (not shown) and justifies the aforementioned use of harmonic bond potentials as a replacement for true angular potentials.
On the other hand, the inter-strand degrees of freedom, namely and , display some degree of coupling to other bonded interactions. interaction represents the hydrogen bonding within a base-pair. The tabulated potential we used faithfully reproduces the equilibrium fluctuations upto a few (see bottom-left graph in Fig. 3). Higher-energy excitations of the bond are suppressed beyond the level imposed by the derived potential, suggesting a coupling with the other degrees of freedom in this regime.
interaction we have used is a purely repulsive interaction, as described above. The associated tabulated potential had to be iteratively softened until a good match was obtained with the full-atomistic data on the left of the Boltzmann inverted distributions (for in the bottom-right graph in Fig. 3). The attractive right-hand-side of the effective potential derived from the superatom fluctuations is solely due to the remaining interactions.
We have looked at the persistence length of our model DNA by means of extended simulations of linear molecules with freely fluctuating ends and lengths 114, 228, and 456 bps. Snapshots from these simulations were used to calculate the persistence length and the pitch as explained below.
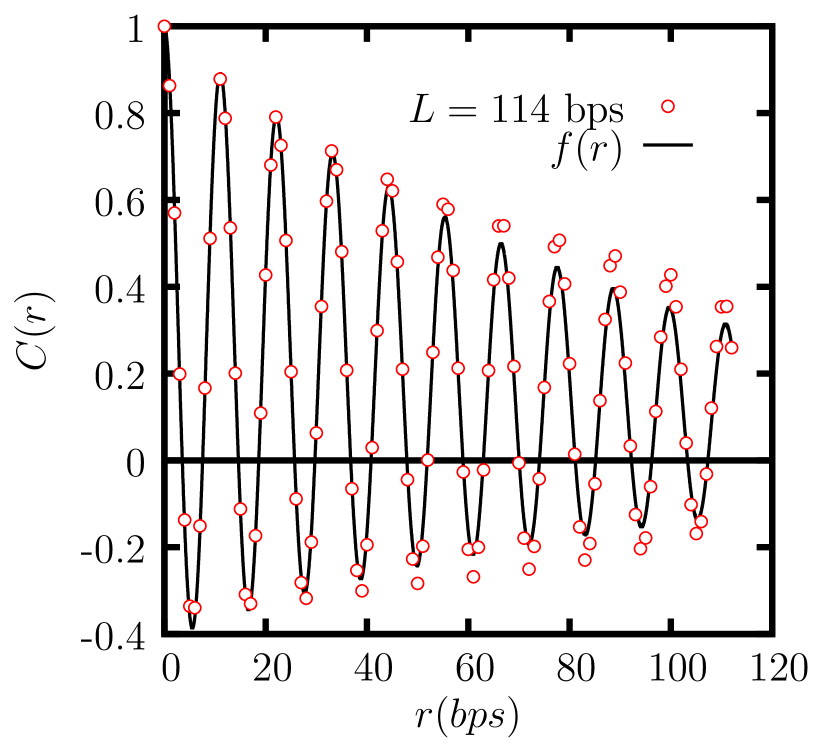
Let be the vector joining and and . Fig. 5 shows for a bps long DNA, calculated by a running average along the chain which is further averaged over 200 snapshots. The helicity of the molecule results in a sinosoidal function with an exponentially decaying amplitude using which both the persistence length and the pitch can be measured. The solid line in Fig. 5 represents the fit to via the following empirical function,
| (4) |
where is a geometrical constant related to the aspect ratio of the helix and given by , is the helical pitch and is the radius measured between the helix center to the superatoms. The decay rate of the correlations measured by fitting Eq. (4) in the interval gives the persistence length () of the model DNA as 96 bps consistently for chain lengths of , , bps (data not shown for and bps long chains). At larger chemical lengths (), finite size effects (short chains) and long equilibration times (long chains) limit the accuracy of the data.
The persistence length of our model DNA is shorter that the experimentally measured length of 50 nm’s ( bps). The stiffness of a DNA chain is a result of both the bonding/angular interactions that form the local helical structure and the electrostatic self-repulsion imposed by the high line charge density. The electrostatic interactions are included here only implicitly, through the coarse-grained force-field parameters that best fit the full-atomistic simulations performed with explicit electrostatic interactions. This approximation is one possible reason for the shorter persistence length we find, while the imperfection (below) of the full-atomistic force-field used by Dixit et al. Dixit et al. (2005) is another.
Equation (4) simultaneously provides an estimate for the helical pitch at room temperature as bps. This value is also slightly higher than that measured ( bps) for the B-DNA. An inspection of the full-atomistic data reveals that the same mismatch exists for the oligomers simulated by the AMBER parm94 force-field Cornell et al. (1995) used by Dixit and coworkers. Dixit et al. (2005) Therefore, the higher pitch is, in fact, a consequence of the imperfect AMBER parm94 force-field rather than a shortcoming of the inverted Boltzmann method used here.
.3 Twist vs Writhe in DNA minicircles
Our main goal in this study is to analyse the twist/writhe partitioning in DNA minicircles. In addition to serving as a demonstration of the model’s capabilities, this problem is also relevant to the denaturation behavior of DNA chains under conserved linking number. Rudnick and Bruinsma (2002); Kabakçıoğlu et al. (2009) In this section, we will explain how we measure the response of a circular DNA chain to applied torsional stress and present our results for chains of different lengths under varying stress levels.
.3.1 Calculating twist and writhe on a discrete chain
Twist and writhe reflect two geometrically distinct modes of response of a DNA chain to applied torsional stress. Let and be the two closed curves interpolating -superatoms of each strand, parametrized by the continuous variable and obtained here by the cubic spline method. The centerline of the DNA is given by . The unit tangent and normal vectors at any point are
| (5) |
Then, the twist () of the chain which is a measure of the sum of the successive basepair stacking angles is formally given by: Kamien (2002)
| (6) |
The writhe () is a nonlocal property associated with the torsional stress stored in the conformation of the centerline (as in the coiling of the old telephone chords) and can be obtained using
| (7) |
For a DNA chain constrained to have a fixed “linking number”(), the number of times one chain loops around the other, total twist and total writhe are connected by the relation White (1969); Fuller (1971)
| (8) |
A variety of methods have been proposed for calculating the amount of and on discrete chains. Klenin and Langowski (2000); de Vries (2005) We found that, constructing the curves by using cubic splines and numerically evaluating Eq. (6) and Eq. (7) is the most accurate approach that guarantees validity of Eq. (8) at all times. Each snapshot that was used for calculating the average values of and plotted in Fig. 6 was checked to satisfy Eq. (8) with a percentage error . Note also that, with the present definition of the centerline as the midpoint of and , a linear DNA chain (closed at infinity) has a finite writhe density measured as . This is due to the corkscrew motion of this centerline; a consequence of the fact that the inter-strand bonds do not cross the center of the tube which tightly encloses the equilibrium structure.
.3.2 Twist and writhe under torsional stress
On circular DNA chains (such as plasmids) the linking number is a topological invariant, unaltered by thermal fluctuations (, topoisomers are employed for this reason). The free energy of a circular DNA of length is minimized when , where, in a strict sense, the equality is attained in the limit and . A weak dependence of on is possible, but will be ignored here and is set to the value we found for our linear model DNA.
In this section, we analyze the behavior of DNA minicircles under varying linking number. By Eq. (8), an excess or a deficiency in the linking number () modifies the equilibrium values of writhe and twist measured in the relaxed state. The partitioning of among writhe and twist depends on the stiffnesses associated with the two quantities (i.e., bending and twisting rigidities) which are complex functions of the intra- and inter-strand interactions between the superatoms. Let
| (9) |
where positive and negative values of correspond to overtwisted and undertwisted circular DNA chains, respectively. Note that, chains of different size are under similar local torsional stress if their values are identical. Nevertheless, we show below that the response of the DNA to depends strongly on the length.
As discussed above, the circular model DNA chain carries a finite writhe () and twist () in the relaxed state () due to the corkscrew motion of the centerline. Since we are interested in measuring the change in twist and writhe as a function of , we define the average deviation in twist as
| (10) |
and the average deviation in writhe as
| (11) |
where the averages are taken over equilibrium snapshots of the system.
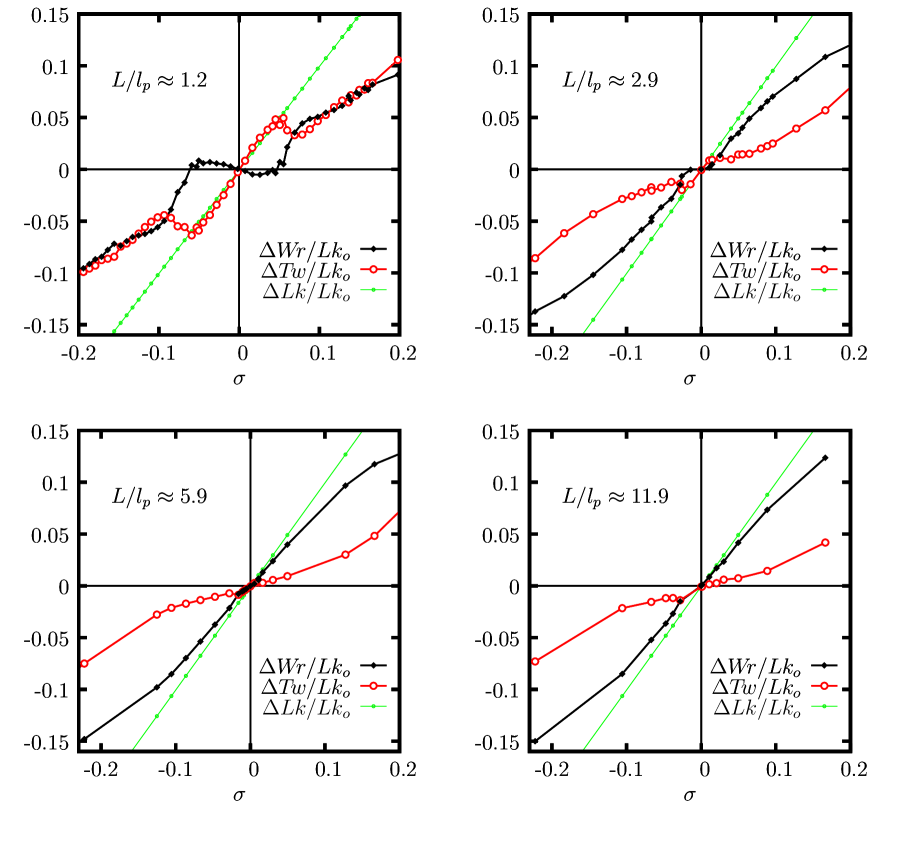
In Fig. 6, and are given as a function of . Four different chain lengths are considered, 1.2, 2.9, 5.8, and and the results are shown in separate graphs from top-left to bottom-right, respectively.
Since is an integer, the values of realizable for a fixed chain length are discrete. In order to overcome this constraint, we combined data obtained from chains with lengths varying upto of the chosen while sampling by changing . For example, regime was sampled with . Above variability in length does not give rise to a significant error in the average writhe and twist of long chains. For short chains the effect is more pronounced and fluctuations are observed in the data. Nevertheless, a general trend that varies with the chain length is clear in Fig. 6 and will be discussed next.
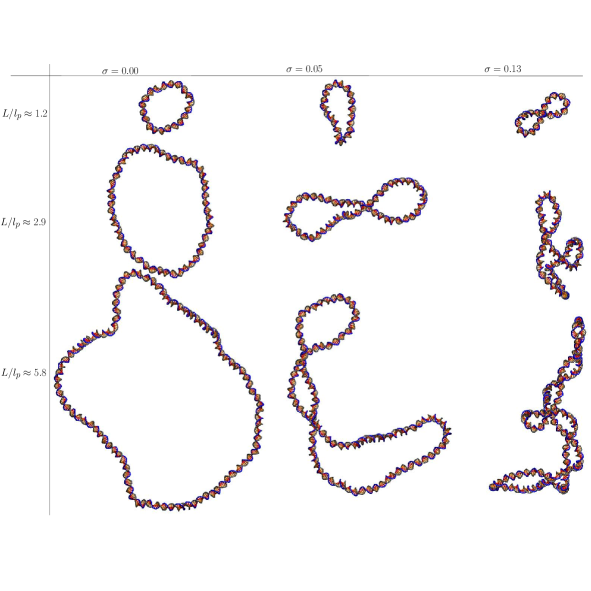
The average writhe and twist of the circular chains display a nonmonotonic dependence on for all four cases considered. Let us first focus on the shortest chain regime () shown in the top-left graph of Fig. 6 and the overtwisting scenario with . There exist two qualitatively distinct modes of torsional response which are separated by a sharp transition at . For small deviations from with , the extra linking number is completely absorbed by the change in twist. In this window the minicircle essentially remains planar (Fig. 7, top-left), with a slightly negative slope in writhe which is probably associated with the aforementioned nonzero writhe density of the relaxed chain.
At the transition, the twist drops sharply and the writhe increases accordingly, absorbing both the additional linking number and the reduction in twist. The jump in writhe is manifested as an out-of-plane deformation of the DNA minicircle (Fig. 7, top-middle). This phenomenon corresponds to the supercoiling transition of the minicircle which can be understood through the buckling instability of the planar state in a circular elastic ribbon model. In fact, the present data can be used to extract the twist persistence length (), of our model DNA through the relation Guitter and Leibler (1992)
| (12) |
for an elastic ribbon with a symmetric torsional response. Substituting yields , consistent with earlier analysis Moroz and Nelson (1997) of the single-molecule experiments. Strick et al. (2000) Further increase in writhe leads to a complete figure-eight shape in the DNA chain as seen in Fig. 7 top-right. Beyond the buckling point, the linking number is almost equally shared by writhe and twist.
A qualitatively similar behavior is observed upon undertwisting in the interval . The buckling transition upon undertwisting takes place at . The asymmetry suggests that undertwisting is easier than ovetwisting the DNA chain. Such nonlinear response in torsional stiffness has already been reported in experiments Selvin et al. (1992); Bryant et al. (2003) and full-atomistic computer simulations Kannan et al. (2006). A recent analytical model for DNA minicircles by Liverpool et al. Liverpool et al. (2008) also predicts that DNA minicircles favor supercoiling to denaturation in the weakly nonlinear regime, consistent with Fig. 6. A possible origin of the nonlinearity is the presence of twist-bend coupling in chiral molecules where the symmetry under 180o rotation around the helix axis is broken (i.e., molecules with major and minor grooves) as argued by Marko&Siggia. Marko and Siggia (1994) Note that, we do not see local base-pair hydrogen-bond breaking events Harris et al. (2008) in this regime. Since our training data set does not include any information regarding the melting of the double helical structure, it is not surprising that the coarse grained model also does not display melting. Incorporation of full-atomistic single-strand DNA simulation data into the model could probably suffice to capture such behavior, which is planned as future work.
When we compare the case to longer chains, we observe two significant differences. First, the buckling transition takes place at smaller values, consistent with Guitter and Leibler (1992), and practically disappearing for . At constant torsional stress density (e.g., ), minicircles with increasing length accommodate a higher fraction of in writhe, with typical configurations shown in the middle column of Fig. 7.
Second, for , , and beyond the buckling point, the majority of the excess linking number is absorbed by the writhe, unlike the equal distribution we have seen for . For these longer chains, decreases with increasing , which is another manifestation of the nonlinear twist rigidity. For fixed , increases monotonically with length, possibly approaching a finite asymptotic value.
.4 Summary and Conclusions
We presented a coarse-grained model which is designed for studying the equilibrium structural properties of - bps long DNA minicircles. Proper thermodynamic averaging of global structural features requires microsecond simulations. Therefore we chose a minimal, two-bead representation of the sugar-phosphate and the base in the basic repeat unit. This approach may be used to address single-strand chirality and base-flipping which are not accessible to single-bead models. The model parameters were extracted from full-atomistic molecular dynamics simulations of DNA oligomers via Boltzmann inversion. Even at this level of simplicity, used coarse-graining methodology yields a faithful representation of the directionality, helicity, major and minor grooves and similar local characteristic features of DNA. For the sake of simplicity and efficiency, base-pair specificity and explicit electrostatic interaction have been ignored here, althought it is straightforward to incorporate these into the model within the present approach. Denaturation upon underwinding should be observable after adding base specificity and including full-atomistic simulations of single-strand DNA in the Boltzmann inversion step, which will be considered in a future extension.
Using our model, we performed a systematic molecular dynamics study of supercoil formation in DNA minicircles. In particular, we measured the twist/writhe partitioning expressed in Eq. (8) as a function of the chain length () and excess linking number density (). We observed a supercoiling (buckling) transition associated with the off-plane deformation instability of the minicircles for , as predicted by analytical calculations on a simple elastic model Guitter and Leibler (1992); Liverpool et al. (2008) and recent full-atomistic simulations. Harris et al. (2008) The transition is marked by a sudden increase in the writhe, while decreases with and practically disappears beyond ( for elastic models). In the planar regime with , the excess linking number is essentially stored in the twist.
Our results suggest that, beyond the supercoiling transition, the fraction of the linking number absorbed as twist and writhe is also nontrivially dependent on chain length. Chains of the order of a persistence length carry approximately equal amounts of twist and writhe, while longer chains accommodate an increasing fraction of the excess linking number as writhe. The dependence of ratio on remains nonlinear also for larger chains. At fixed , we observe that the above ratio increases with and possibly reaches a finite asymptotic value in the limit , as this limit is accurately represented by harmonic elastic energy terms for both twist and writhe. On the other hand, the behavior at fixed , which may apply to the bound portions of a circular DNA chain near the melting temperature, is unclear and appears to be an interesting problem.
Acknowledgements.
We gratefully acknowledge funding through TUBITAK Grant No. 108T553 and Max-Planck-Society Partnership Program for the partner group with Prof. Kurt Kremer from MPIP-Mainz. A.K. is in debt with D. Mukamel, E. Orlandini and D. Marenduzzo for helpful discussions and some of the references.References
- Luger et al. (1997) K. Luger, A. Mäder, R. Richmond, D. Sargent, and T. Richmond, Nature 389, 18 (1997).
- Halford and Marko (2004) S. Halford and J. Marko, Nucl. Acid. Res. 32, 3040 (2004).
- Elf et al. (2007) J. Elf, G. Li, and X. Xie, Science 316, 1191 (2007).
- Strick et al. (2000) T. Strick, J. Allemand, V. Croquette, and D. Bensimon, Prog. Biophys. Mol. Biol. 74, 115 (2000).
- Mathew-Fenn et al. (2008) R. S. Mathew-Fenn, R. Das, and P. A. B. Harbury, Science 322, 446 (2008).
- Altan-Bonnet et al. (2003) G. Altan-Bonnet, A. Libchaber, and O. Krichevsky, Phys. Rev. Lett. 90, 138101 (2003).
- Fogg et al. (2006) J. Fogg, N. Kolmakova, I. Rees, S. Magonov, H. Hansma, J. Perona, and E. Zechiedrich, J. Phys: Cond. Mat. 18, 145 (2006).
- Forth et al. (2008) S. Forth, C. Deufel, M. Sheinin, B. Daniels, J. Sethna, and M. Wang, Phys. Rev. Lett. 100, 148301 (2008).
- Norouzi et al. (2008) D. Norouzi, F. Mohammad-Rafiee, and R. Golestanian, Phys. Rev. Lett. 101, 16 (2008).
- Bar et al. (2007) A. Bar, Y. Kafri, and D. Mukamel, Phys. Rev. Lett. 98, 38103 (2007).
- Alim and Frey (2007) K. Alim and E. Frey, Euro. Phys. J. E 24, 185 (2007).
- Baiesi and Livi (2009) M. Baiesi and R. Livi, J. Phys. A 42, 082003 (2009).
- Rudnick and Bruinsma (2002) J. Rudnick and R. Bruinsma, Phys. Rev. E 65, 24 (2002).
- Kabakçıoğlu et al. (2009) A. Kabakçıoğlu, E. Orlandini, and D. Mukamel, Phys. Rev. E (in press) 80 (2009).
- Harris et al. (2008) S. A. Harris, C. A. Laughton, and T. B. Liverpool, Nucl. Acid. Res. 36, 21 (2008).
- Liverpool et al. (2008) T. B. Liverpool, S. A. Harris, and C. A. Laughton, Phys. Rev. Lett. 100 (2008).
- Trovato and Tozzini (2008) F. Trovato and V. Tozzini, J. Phys. Chem. B 112, 13197 (2008).
- Perez et al. (2007) A. Perez, F. Luque, and M. Orozco, J. Am. Chem. Soc 129, 14739 (2007).
- Dixit et al. (2005) S. B. Dixit, D. L. Beveridge, D. A. Case, T. E. Cheatham, E. Giudice, F. Lankas, R. Lavery, J. H. Maddocks, R. Osman, H. Sklenar, et al., Biophys. J. 89, 3721 (2005).
- Drukker and Schatz (2000) K. Drukker and G. C. Schatz, J. Phys. Chem. B 104, 6108 (2000).
- Knotts et al. (2007) T. A. Knotts, N. Rathore, D. C. Schwartz, and J. J. de Pablo, J. Chem. Phys. 126, 084901 (2007).
- Sambriski et al. (2009) E. Sambriski, D. Schwartz, and J. de Pablo, Biophys. J. 96, 1675 (2009).
- Reith et al. (2003) D. Reith, M. Putz, and F. Muller-Plathe, J. Comput. Chem. 24, 1624 (2003).
- Limbach et al. (2006) H. Limbach, A. Arnold, B. Mann, and C. Holm, Comp. Phys. Comm. 174, 704 (2006).
- Humphrey et al. (1996) W. Humphrey, A. Dalke, and K. Schulten, J. Mol. Graph. 14, 33 (1996).
- Cornell et al. (1995) W. D. Cornell, P. Cieplak, C. I. Bayly, I. R. Gould, K. M. Merz, D. M. Ferguson, D. C. Spellmeyer, T. Fox, J. W. Caldwell, and P. A. Kollman, J. Am. Chem. Soc. 117, 5179 (1995).
- Kamien (2002) R. Kamien, Rev. Mod. Phys. 74, 953 (2002).
- White (1969) J. White, American Journal of Mathematics pp. 693–728 (1969).
- Fuller (1971) F. Fuller, PNAS 68, 815 (1971).
- Klenin and Langowski (2000) K. Klenin and J. Langowski, Biopolymers 54, 307 (2000).
- de Vries (2005) R. de Vries, J. Chem. Phys. 122, 064905 (2005).
- Guitter and Leibler (1992) E. Guitter and S. Leibler, Europhys. Lett. 17, 643 (1992).
- Moroz and Nelson (1997) J. Moroz and P. Nelson, PNAS 94, 14418 (1997).
- Selvin et al. (1992) P. Selvin, D. Cook, N. Pon, W. Bauer, M. Klein, and J. Hearst, Science 255, 82 (1992).
- Bryant et al. (2003) Z. Bryant, M. Stone, J. Gore, S. Smith, N. Cozzarelli, and C. Bustamante, Nature 424, 338 (2003).
- Kannan et al. (2006) S. Kannan, K. Kohlhoff, and M. Zacharias, Biophysical journal 91, 2956 (2006).
- Marko and Siggia (1994) J. Marko and E. Siggia, Macromolecules 27, 981 (1994).