Quasars probing intermediate redshift star-forming galaxies
Abstract
We present a sample of 46 [O iii]-emitting galaxies at detected in the fibre spectra of quasars from the Sloan Digital Sky Survey, Data Release 7 (SDSS-DR7) through an automatic search procedure. We also detect [O ii] and H emission lines from most of these galaxies in the SDSS spectra. We study both the emission and absorption properties of a sub-sample of 17 galaxies in the redshift range -0.7, where Mg ii lines are covered by the SDSS spectra. The measured lower-limits on the star-formation rates of these galaxies are in the range 0.2-20 M⊙ yr-1. The emission line luminosities and (O/H) metallicities from R23 measured in this sample are similar to what is found in normal galaxies at these redshifts. Thus, this constitutes a unique sample of intermediate redshift star-forming galaxies where we can study the QSO absorber - galaxy connection. Strong Mg ii ( Å) as well as Mg i absorption lines are detected in the QSO spectra at the redshift of most of these galaxies. Strong Fe ii ( Å) absorption lines are also generally detected whenever the appropriate wavelength ranges are covered. This suggests that most of these systems could be bona-fide Damped Lyman- systems. We investigate various possible relations between the Mg ii rest equivalent widths and the emission line properties. We find a possible (2 ) correlation between the emission-line metallicity of the galaxies and the Mg ii rest equivalent width of the absorbers (), which could be a consequence of an underlying mass-metallicity relation. However, [O iii]-selected Mg ii systems represent only a minor fraction of the strong Mg ii absorbers. We find this cannot be attributed to biases related either to the spectral signal-to-noise ratio or to the brightness of the QSOs. We measure the average observed fluxes (collected into the SDSS fibre) of the [O ii] and [O iii] lines associated to Mg ii-selected systems through stacking technique. We find that the average lumiosities of emission lines are higher for systems with larger . The stacked luminosities are found to be below the typical detection limit in individual spectra, indicating that faint galaxies can contribute appreciably to the observed population of strong Mg ii absorbers at intermediate redshifts. We also present long-slit spectroscopic observations of SDSS J113108+202151, the most luminous line-emitting galaxy in our sample. Surprisingly, we find that the line-emitting region does not coincide with the nearby extended bright galaxy with consistent photometric redshift seen in the SDSS image.
keywords:
galaxies: abundances – galaxies: ISM – galaxies: fundamental parameters – quasar: absorption lines – quasar:individual: SDSS J113108+2021511 Introduction
The study of intervening absorption lines seen in the spectra of bright distant objects is one of the most sensitive and powerful probe for understanding the early evolution of galaxies. Indeed at low and intermediate redshifts (), the connections between QSO absorption systems and galaxies are mainly investigated for Mg ii-selected systems. These absorbers are found to be statistically associated with relatively bright field galaxies seen within a few tens of kpc to the QSO line of sight (Bergeron & Boissé, 1991; Steidel, 1995). These studies established that Mg ii absorbers provide an unbiased way to detect normal galaxies at different redshifts. However, the success rate of detecting Mg ii absorption in the spectrum of QSOs that have known foreground galaxies with redshift measurements is much less than one (Bechtold & Ellingson, 1992; Bowen et al., 1995; Tripp & Bowen, 2005). These studies suggest that the gaseous halos around galaxies may be less uniformly populated than what was thought before (see Kacprzak et al., 2008). Also it is not necessary that the galaxies responsible for Mg ii absorption are always bright galaxies.
Integral field spectroscopy seems to be a promising technique for the study of galaxies associated to quasar absorption line systems and allowed Bouché et al. (2007) to detect H emission associated to 14 strong Mg ii absorbers (with impact parameters in the range 1-40 kpc), indicating large star formation rates (1-20 M⊙ yr-1). Another possibility is to directly search for galaxy light from Mg ii absorbers in special cases where the quasar flux at short wavelengths is switched-off by a higher redshift Lyman-limit system (Christensen et al., 2009). Till now, such observations have only resulted in stringent upper-limits on the broad-band luminosity of the related galaxies.
It has also been proposed that other classes of QSO absorbers, such as those characterised by strong Ca ii absorption lines, could select the most metal-rich gas (see, e.g. Wild et al., 2006; Nestor et al., 2008), hence probing more central parts of high-redshift galaxies. Wild et al. (2007) have statistically detected [O ii] emission associated to strong Mg ii- and Ca ii-selected absorbers by stacking SDSS quasar spectra. However, only a few direct detections of emission lines from absorbing galaxies have been reported so far. Zych et al. (2007) presented direct imaging and long-slit spectroscopic observations of five quasars with strong Ca ii systems at . They detected [O ii], [O iii], H and H emission lines at the redshift of the absorbers. The luminosity of the corresponding galaxies is high, , with star-formation rates in the range 0.3-30 M⊙ yr-1.
When galaxies are detected with some projected separation to the QSO sight-line it is not obvious whether one is detecting the halo gas associated with the galaxy or one is probing the correlation length of metals in the IGM with respect to the bright galaxies. The contribution of possible faint galaxies closer to the line of sight (i.e. within the point spread function of the QSO) that remain undetected is also not well explored. Therefore, even after two decades of intense research activity to establish the Mg ii absorber-galaxy relationship, there are still open questions in this field that need to be answered.
Here, we present direct detections of emission lines from intervening star-forming galaxies (with impact parameters kpc and redshifts in the range 0.10.8) in quasar spectra from the Sloan Digital Sky Survey (SDSS) Data Release 7. For objects at , the SDSS spectra allow us to search for Mg ii absorption originating from these galaxies. Our approach is very different from all previous ones in the sense that we do not make any pre-selection of galaxies based on QSO absorption lines. On the contrary, we take advantage of SDSS fibre spectra, by first searching for galaxy emission lines on top of background quasars spectra, then looking for the associated absorption lines. Throughout the paper, we adopt a CDM cosmology with , and Mpc-1 (e.g. Spergel et al., 2003).
2 Search for intervening galaxies
We are mostly interested in detecting normal star forming galaxies close to the line of sight of background QSOs. We focus on the redshift range -0.7 as most prominent emission lines, as well as the Mg ii absorption lines, fall in the spectral range covered in the SDSS spectrum. In particular, [O iii] doublet lines are useful because the [O iii] is one of the strongest lines in the optical range and is accompanied by the close-by [O iii] line with a fixed intensity ratio, allowing for an easy identification using an automated procedure. In this section we derive a rough estimate of the expected number of [O iii] emitters that can be detected from the SDSS QSO spectra, describe our automatic routine to detect galaxies and discuss the bias due to QSO luminosity.
2.1 Detectability and number density of faint galaxies
Here we try to get a rough estimate of the number of galaxies with different [O iii] luminosities, at that will be within the SDSS fibre centred around a distant QSO. The expected peak flux of the [O iii]5007 emission from a galaxy (erg s = 41.95; Hippelein et al., 2003) at will be of the order of erg s-1 cm-2 Å-1, assuming a line width FWHM. Note that, throughout the paper, refers to the Schechter parameter of the [O iii]-luminosity function. As we aim here at detecting low luminosity galaxies, we should reach a detection limit of the order of erg s-1 cm-2 Å-1.
If we assume the dominant noise for the detection of an emission line is the photon noise from the quasar continuum (i.e. we ignore the background noise) then the signal-to-noise ratio in the peak of the emission line, SNRl, can be written as:
| (1) |
where and are the counts in the line and in the continuum respectively. The signal-to-noise ratio of the continuum, SNRc, is equal to and the count ratio is equal to the flux ratio (). Therefore, we can write
| (2) |
The detectability of the emission line will not only depend on the [O iii] line flux () but also on the quasar flux (). For a given emission line flux, the minimum signal-to-noise ratio required to detect the [O iii] emission will depend upon the magnitude of the quasar. That is, the 3 detection of the [O iii]5007 emission line arising from a galaxy towards a quasar will require a spectrum with signal-to-noise ratio . In turn, detecting the same galaxy towards a quasar will require a signal-to-noise ratio higher than about 45.
Next, we estimate the probability of a given line of sight to pass very close or through a galaxy with line luminosity greater than a limiting luminosity . Integrating the [O iii] luminosity function over the luminosities gives the number density of galaxies:
| (3) |
where , and are the Schechter parameters of the luminosity function, taken from Table 5 of Ly et al. (2007) and is the incomplete gamma function. We can estimate the number of galaxies with an impact parameter less than the SDSS fibre radius (, i.e. 10 kpc at ):
| (4) |
For , this gives us a number density per unit distance Mpc-1. That is, for a line of sight to a quasar probing , the probability of a galaxy being at an impact parameter less than the SDSS fibre radius will be about . We need to consider this as a very conservative upper limit as while estimating this number we have not considered (1) any bias due to the luminosity of the background QSO (see Sect. 2.3), (2) the emission line attenuation due to dust internal to the galaxy, (3) the fibre losses (i.e. the fact that only a fraction of [O iii] flux may go through the fibre) and (4) the colour selection of QSOs missing dusty sightlines (Noterdaeme et al., 2009a), as expected from galaxies at very low impact parameters. From these simple-minded calculations, one can already see that a huge number of quasar spectra () with adequate signal-to-noise ratios will be required to detect a handful star-forming galaxies with an impact parameter kpc along the line of sight to distant QSOs. The availability of a large number of high quality QSO spectra in the SDSS database makes it a realistic possibility to build a sample of such star forming galaxies to bridge the connection between strong Mg ii systems and star-forming galaxies.
2.2 Search for galaxy [O iii] lines in SDSS quasar spectra
We employ a correlation analysis to select emission line galaxies close to the line of sight to 98 978 quasars from the Sloan Digital Sky Survey II, Data Release 7, without any prior knowledge of the absorption properties of the galaxies. As a first step we iteratively fit the quasar continuum by applying Savitsky-Golay filtering and removing deviant pixels. We then cross-correlate the continuum-subtracted quasar spectra with a template profile of [O iii]4959,5007 generated from the SDSS galaxy template spectrum.
We restrict our search out of the Lyman- forest (in particular for high redshift QSOs) and below Å (i.e. ) to avoid the most crowded telluric line regions. Whenever a high correlation is found (), we check the [O iii]5007 (resp. [O iii]4959) are detected at more than 2 (resp. 1) level. Note that because of the galactic template used, wide emission lines arising from AGNs are not picked-up by our procedure. Each candidate was then inspected visually for the presence of other emission lines in particular H, H and [O ii]3726,3729. Spurious detections were identified and removed from the sample. We list all the 44 confirmed emission line galaxies in the redshift range 0.10.68 in Table 1. Seventeen of these galaxies are in the redshift range ideally suited for detecting Mg ii absorption in the SDSS spectrum itself. These objects form the main sample of this present study.
In addition, we performed an automatic search for the [O ii] emission doublet111The two lines are always blended at the SDSS resolution associated to Mg ii systems to detect higher redshifts systems, for which telluric lines make any search based on [O iii] a difficult task. Mg ii systems were found by an automatic procedure based on correlation analysis, similar to that used by Noterdaeme et al. (2009b) to search for DLAs. This provided us with two additional galaxies, at and 0.788 towards SDSS J120908+022734 and SDSS J161728+061604, respectively. The detections are summarised in Table 1. We concentrate, in this paper, on the sample of 17 [O iii]-selected galaxies at for which the expected positions of the Mg ii 2796,2803 absorption lines are also covered. Lower redshift systems are also provided in Table 1 for the interested reader.
| QSO | plate,MJD,fiber | a | selection | |
|---|---|---|---|---|
| J023914-070557 | 0455,51909,562 | 0.715 | 0.342 | [O iii] |
| J080216+143506 | 2266,53679,154 | 1.562 | 0.141 | [O iii] |
| J080808+064108 | 1756,53080,184 | 2.108 | 0.433 | [O iii] |
| J081154+202148 | 1925,53327,437 | 1.247 | 0.445 | [O iii] |
| J082057+400326 | 0760,52264,075 | 0.588 | 0.301 | [O iii] |
| J085113+071959 | 1299,52972,256 | 1.654 | 0.130 | [O iii] |
| J091417+325955 | 1592,52990,275 | 4.656 | 0.444 | [O iii] |
| J092913+302225 | 1939,53389,537 | 1.815 | 0.439 | [O iii] |
| J094041+341535 | 1594,52992,048 | 1.718 | 0.447 | [O iii] |
| J094335-004322 | 0266,51630,125 | 0.271 | 0.099 | [O iii] |
| J094759+120537 | 1742,53053,624 | 1.287 | 0.257 | [O iii] |
| J095228+032616 | 0571,52286,144 | 1.290 | 0.419 | [O iii] |
| J101246+171419 | 2587,54138,556 | 1.103 | 0.112 | [O iii] |
| J103309+205956 | 2376,53770,427 | 1.113 | 0.361 | [O iii] |
| J104223+092708 | 1240,52734,584 | 1.108 | 0.592 | [O iii] |
| J104257+074850 | 1000,52643,522 | 2.666 | 0.033 | [O iii] |
| J110224+573512 | 0950,52378,241 | 1.620 | 0.293 | [O iii] |
| J111343+184002 | 2490,54179,023 | 2.062 | 0.169 | [O iii] |
| J112146+021757 | 0511,52636,175 | 1.274 | 0.263 | [O iii] |
| J113002+602628 | 0952,52409,403 | 0.374 | 0.061 | [O iii] |
| J113108+202151 | 2502,54180,371 | 1.763 | 0.563 | [O iii] |
| J114340+520303 | 0881,52368,313 | 1.816 | 0.132 | [O iii] |
| J120538+604057 | 0954,52405,535 | 0.537 | 0.434 | [O iii] |
| J120908+022734 | 0517,52024,541 | 1.226 | 0.669 | Mg ii+[O ii] |
| J121510+141802 | 1765,53466,068 | 1.299 | 0.421 | [O iii] |
| J122752+165522 | 2598,54232,188 | 3.348 | 0.565 | [O iii] |
| J125339+175832 | 2601,54144,625 | 0.505 | 0.401 | [O iii] |
| J131804+522510 | 1667,53430,420 | 2.990 | 0.393 | [O iii] |
| J132542+255525 | 2244,53795,141 | 1.439 | 0.433 | [O iii] |
| J133733+445129 | 1465,53082,300 | 1.168 | 0.159 | [O iii] |
| J132918+630424 | 0603,52056,089 | 0.987 | 0.366 | [O iii] |
| J140103-005030 | 0301,51942,052 | 0.927 | 0.357 | [O iii] |
| J140159+414156 | 1346,52822,060 | 1.701 | 0.120 | [O iii] |
| J142421+453523 | 1287,52728,101 | 1.614 | 0.421 | [O iii] |
| J143458+504118 | 1046,52460,542 | 1.485 | 0.199 | [O iii] |
| J144412+022301 | 0536,52024,626 | 1.215 | 0.140 | [O iii] |
| J145240+544345 | 1163,52669,505 | 1.520 | 0.102 | [O iii] |
| J150140+571026 | 0610,52056,133 | 1.799 | 0.103 | [O iii] |
| J154542+505759 | 0796,52401,495 | 0.942 | 0.525 | [O iii] |
| J160521+510740 | 0620,52375,535 | 1.229 | 0.099 | [O iii] |
| J161016+500728 | 0623,52051,304 | 0.239 | 0.127 | [O iii] |
| J161607+212401 | 1853,53566,192 | 1.115 | 0.335 | [O iii] |
| J161728+061604 | 1731,53884,113 | 1.244 | 0.788 | Mg ii+[O ii] |
| J165508+224150 | 1415,52885,478 | 0.621 | 0.453 | [O iii] |
| J165632+414617 | 0631,52079,118 | 2.163 | 0.662 | [O iii] |
| J235621+002906 | 0387,51791,343 | 1.049 | 0.331 | [O iii] |
The redshifts of galaxies studied in this paper, , are marked in bold face.
2.3 Effect of QSO luminosity
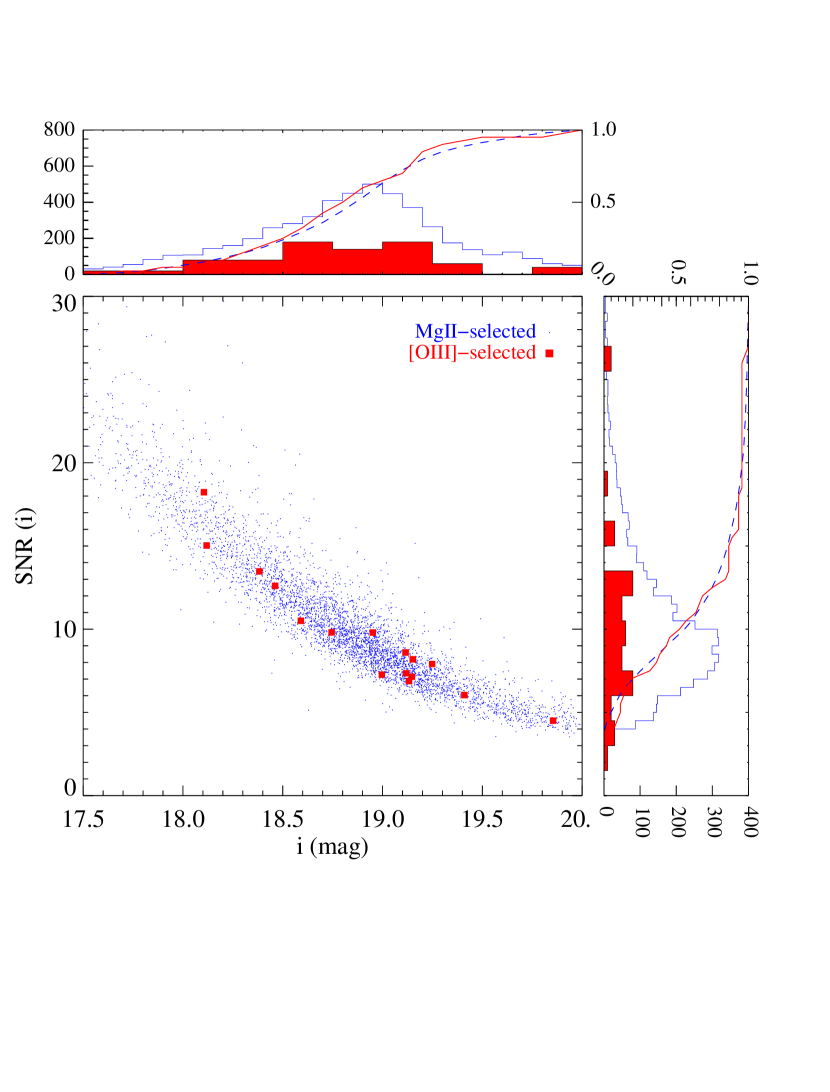
In Fig. 1 we present the fibre magnitudes and spectral signal-to-noise ratios in -band of the whole quasar sample searched for [O iii] emission lines and compare to that of quasars with detected intervening emission lines. It is somehow surprising to see that the detections do not occupy any preferred region of the SNR-magnitude diagram. This is better seen in the upper (resp. right) panel where we compare the differential and cumulative distributions of the magnitudes (resp. signal-to-noise ratios) of QSOs with and without a foreground [O iii]-emitting galaxy. Indeed, a double-side Kolmogorov-Smirnov test shows that the probability of the magnitudes of the quasar with [O iii]-selected intervening galaxies to arise from the same parent population as the whole quasar sample is high (). The same test on signal-to-noise ratio gives .
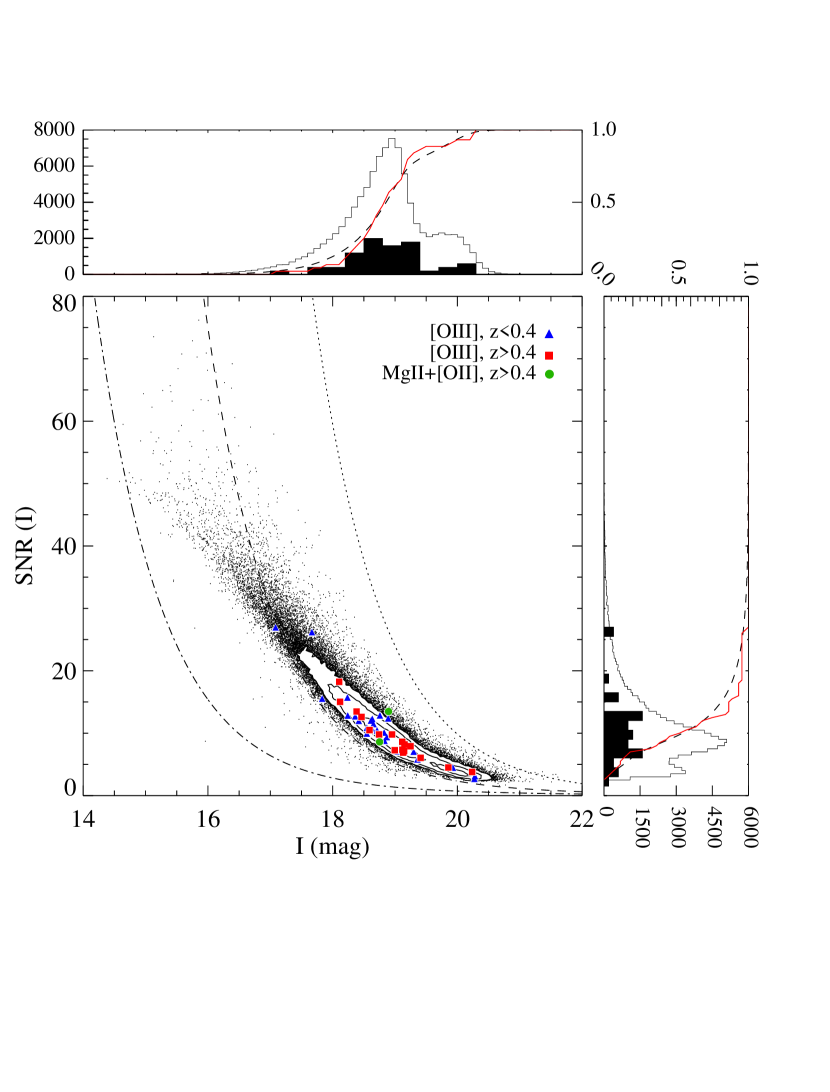
Following Eq. 2, we overplot the S/N ratio required for the 1 detection of an emission line with peak intensity erg s-1 cm-2 Å-1 (or equivalently the 3 detection of erg s-1 cm-2 Å-1) as a function of the -band magnitude of the background quasar. The spectral S/N ratios and -band magnitudes of the quasars roughly follow this relation. While detections are naturally made easy towards faint quasars, the steeply increasing S/N ratio of SDSS spectra with the quasar brightness also allows for detections towards relatively bright quasars. However, the signal-to-noise ratios reached by the SDSS for the very bright quasars () are still not sufficiently high to detect intervening emission lines with erg s-1 cm-2 Å-1. As can be seen in the top panel of Fig. 1, quasars with are rare anyway and do not contribute much to the statistics.
3 Emission line analysis
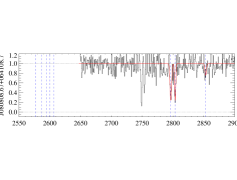
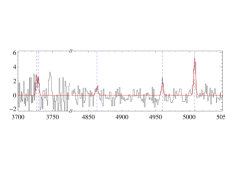
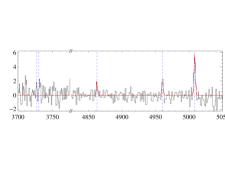
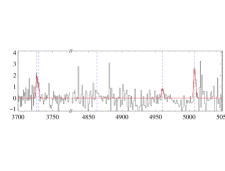
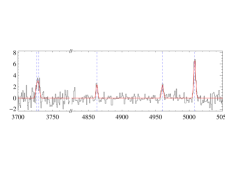
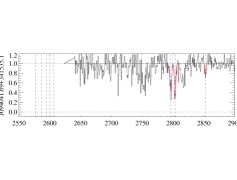
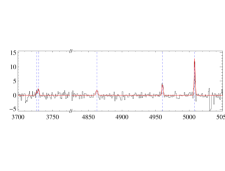
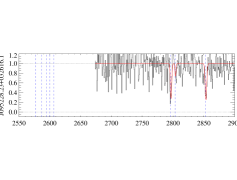
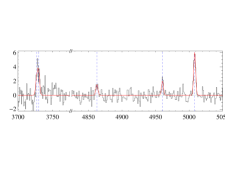
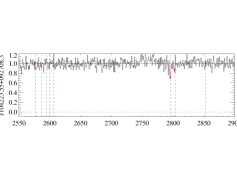
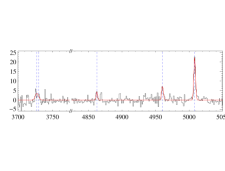
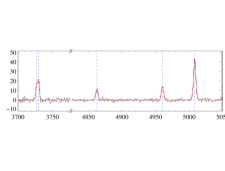
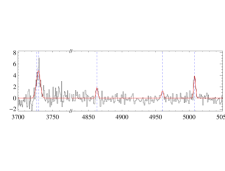
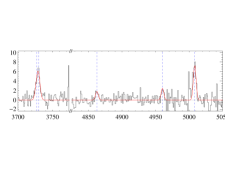
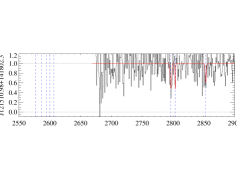
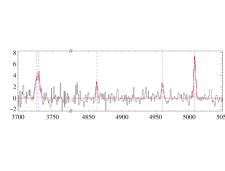
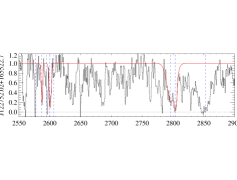
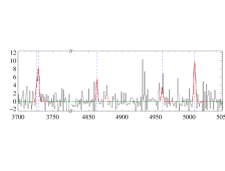
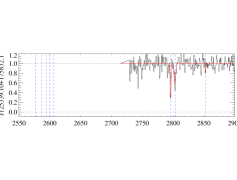
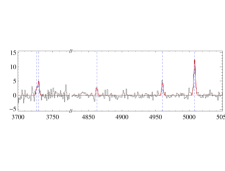
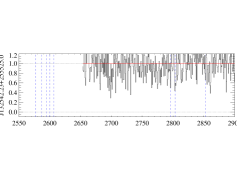
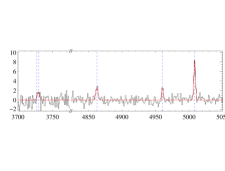
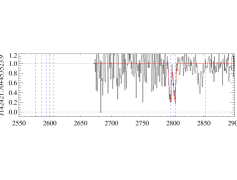
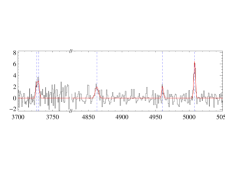
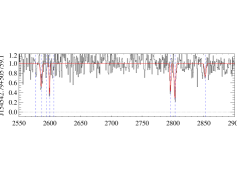
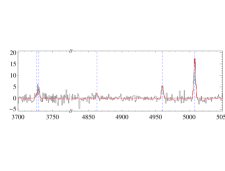
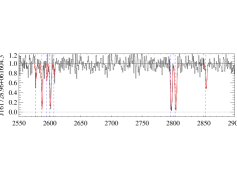
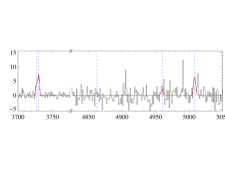
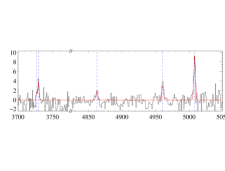
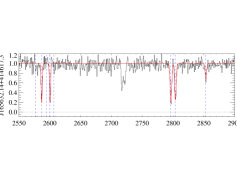
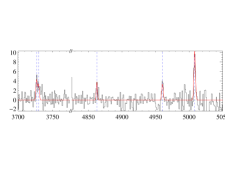
The [O ii]3726,3729 doublet and H are the other strong lines that are expected in the wavelength range covered by the SDSS spectrum for the redshift range of our interest. We detect [O ii]3726,3729 in all the cases except for the galaxy along the line of sight towards J081154+202148. However, it is obvious from Fig. 2 that the S/N in the wavelength range of [O ii] emission is poor. The H line is detected in all but two cases. Here we perform a detailed analysis of H, [O iii] and [O ii] emission lines through Gaussian fitting. As a first step we subtract the continuum emission that includes the continuum light from both the QSO and the galaxy. The unabsorbed continuum (including the quasar broad emission lines but excluding intervening emission lines) is determined accurately by manually adjusting a spline function to the observed spectrum. Then we simultaneously fit the detected emission lines using an IDL code based on MPFIT (Markwardt, 2009), which performs -minimisation by Levenberg-Marquardt technique. We use a single redshift for all emission lines. The [O ii] doublet is fitted with a double Gaussian. Note that although the two lines are always blended at the SDSS spectral resolution it is still possible to distinguish the two corresponding peaks. As the flux ratio of these two lines depends on the kinetic temperature of the gas and the electron density (e.g. Kisielius et al., 2009), we fit the blend with two components allowing for the relative flux ratio to be a free parameter but keeping the line widths tied. In the case of the forbidden lines [O iii]4959,5007, we impose the line ratio to follow the theoretical value of 3 (e.g. Storey & Zeippen, 2000). The results of our fits are shown in Fig. 2. The integrated line intensities of [O iii], [O ii] and H lines are then measured from the fitted Gaussian parameters. In the following, we always refer to [O iii] flux (or luminosity) as the sum of fluxes (or luminosity) of [O iii]5007 and [O iii]4959. Similarly in the case of [O ii], we use the sum of [O ii]3727 and [O ii]3730. The total emission line flux together with the associated errors are given in Table 2. In the case of non-detection we give 2 upper limits.
| Fe ii, Mn ii Mg ii Mg i | [O ii] H [O iii] | |
 |
 |
|
 |
 |
|
 |
 |
|
 |
 |
|
 |
 |
|
 |
 |
|
 |
 |
|
 |
 |
|
 |
 |
|
 |
 |
|
| Rest wavelength (Å) | Rest wavelength (Å) | 10 ″ |
| Fe ii, Mn ii Mg ii Mg i | [O ii] H [O iii] | |
 |
 |
|
 |
 |
|
 |
 |
|
 |
 |
|
 |
 |
|
 |
 |
|
 |
 |
|
 |
 |
|
 |
 |
|
| Rest wavelength (Å) | Rest wavelength (Å) | 10 arcsec |
| QSO | (10-17 erg s-1 cm-2) | (1040 erg s-1)b | SFR (M⊙ yr-1) | |||||||
|---|---|---|---|---|---|---|---|---|---|---|
| [O ii] | [O iii] | H | [O ii] | [O iii] | H | [O ii]c | Hc | [O ii]+Hd | ||
| J080808+064108 | 0.433 | 12.1(4.2) | 25.1(3.0) | 4.9(3.4) | 8.3(2.9) | 17.2(2.8) | 6.7(4.7) | 0.4 | 0.8 | 0.9 |
| J081154+202148 | 0.445 | 22.0(2.6) | 4.0(1.8) | 16.1(2.5) | 5.8(2.7) | … | 0.7 | … | ||
| J091417+325955 | 0.444 | 8.3(2.0) | 12.3(1.9) | 6.0(1.4) | 8.9(1.8) | 0.3 | … | … | ||
| J092913+302225 | 0.439 | 16.9(8.2) | 32.2(2.6) | 7.4(2.3) | 12.0(5.8) | 22.8(2.4) | 10.4(3.3) | 0.5 | 1.2 | 1.7 |
| J094041+341535 | 0.447 | 7.6(3.2) | 33.7(4.2) | 5.7(2.4) | 5.6(2.3) | 24.8(4.1) | 8.4(3.6) | 0.2 | 0.9 | 3.1-4.3 |
| J095228+032616 | 0.419 | 21.1(7.4) | 29.2(2.5) | 6.1(3.2) | 13.4(4.7) | 18.5(2.1) | 7.7(4.1) | 0.6 | 0.9 | 0.5-0.6 |
| J104223+092708 | 0.592 | 21.4(11.7) | 97.9(5.7) | 11.5(4.0) | 31.0(17.0) | 141.9(11.1) | 33.3(11.7 | 1.4 | 3.5 | 7.3-8.0 |
| J113108+202151 | 0.563 | 110.5(9.6) | 247.3(6.8) | 47.1(7.5) | 141.8(12.3) | 317.4(11.7) | 120.8(19.1 | 6.3 | 11.8 | 16.5-17.7 |
| J120538+604057 | 0.434 | 33.9(7.5) | 19.1(2.5) | 6.3(2.7) | 23.3(5.2) | 13.1(2.3) | 8.7(3.7) | 1.0 | 1.0 | 0.2-0.3 |
| J120908+022734e | 0.669 | 42.8(7.2) | 50.1(6.1) | 9.6(4.2) | 83.7(14.0) | 97.8(15.9) | 37.4(16.5) | 3.7 | 3.9 | 1.4-1.8 |
| J121510+141802 | 0.421 | 31.2(8.2) | 34.3(2.8) | 7.3(2.6) | 20.0(5.3) | 22.0(2.4) | 9.3(3.3) | 0.9 | 1.0 | 0.4-0.5 |
| J122752+165522 | 0.565 | 34.5(6.8) | 43.0(4.1) | 14.0(6.6) | 44.6(8.8) | 55.6(7.0) | 36.2(17.0) | 2.0 | 3.8 | 4.7-5.0 |
| J125339+175832 | 0.401 | 19.4(4.6) | 53.8(3.3) | 7.7(2.7) | 11.1(2.6) | 30.7(2.6) | 8.8(3.1) | 0.5 | 1.0 | 1.2 |
| J132542+255525 | 0.433 | 6.9(5.5) | 34.6(2.9) | 11.7(3.3) | 4.7(3.8) | 23.7(2.7) | 16.0(4.6) | 0.2 | 1.7 | 18.1-45.2 |
| J142421+453523 | 0.421 | 16.4(8.0) | 26.2(3.3) | 11.9(4.8) | 10.5(5.2) | 16.8(2.8) | 15.3(6.2) | 0.5 | 1.7 | 5.4-7.2 |
| J154542+505759 | 0.525 | 18.6(11.8) | 75.8(5.0) | 6.9(3.2) | 20.1(12.8) | 82.2(7.2) | 14.9(7.0) | 0.9 | 1.6 | 1.7-1.8 |
| J161728+061604e | 0.788 | 32.1(4.9) | 34.3(9.8) | 93.3(14.3) | 99.8(38.1) | 4.1 | … | … | ||
| J165508+224150 | 0.453 | 11.9(4.8) | 39.7(5.2) | 6.5(3.5) | 9.0(3.6) | 30.2(5.3) | 9.9(5.4) | 0.4 | 1.1 | 2.3-2.6 |
| J165632+414617 | 0.662 | 18.8(5.1) | 38.5(6.9) | 7.6(4.7) | 35.7(9.7) | 73.2(17.4) | 28.9(17.7) | 1.6 | 3.0 | 3.8-4.0 |
Due to fibre losses, luminosities and star formation rates should be considered as lower limits. Luminosities are not corrected for dust-extinction. Updated SFR calibrations for [O ii] (Kewley et al., 2004) and H (Kennicutt, 1998) were taken from Argence & Lamareille (2009), assuming an intrinsic Balmer decrement of 2.85: H = 2.85 H. Self-consistent two-lines calibration ([O ii]+H) from Argence & Lamareille (2009). (Mg ii+[O ii])-selected galaxies.
3.1 Luminosities
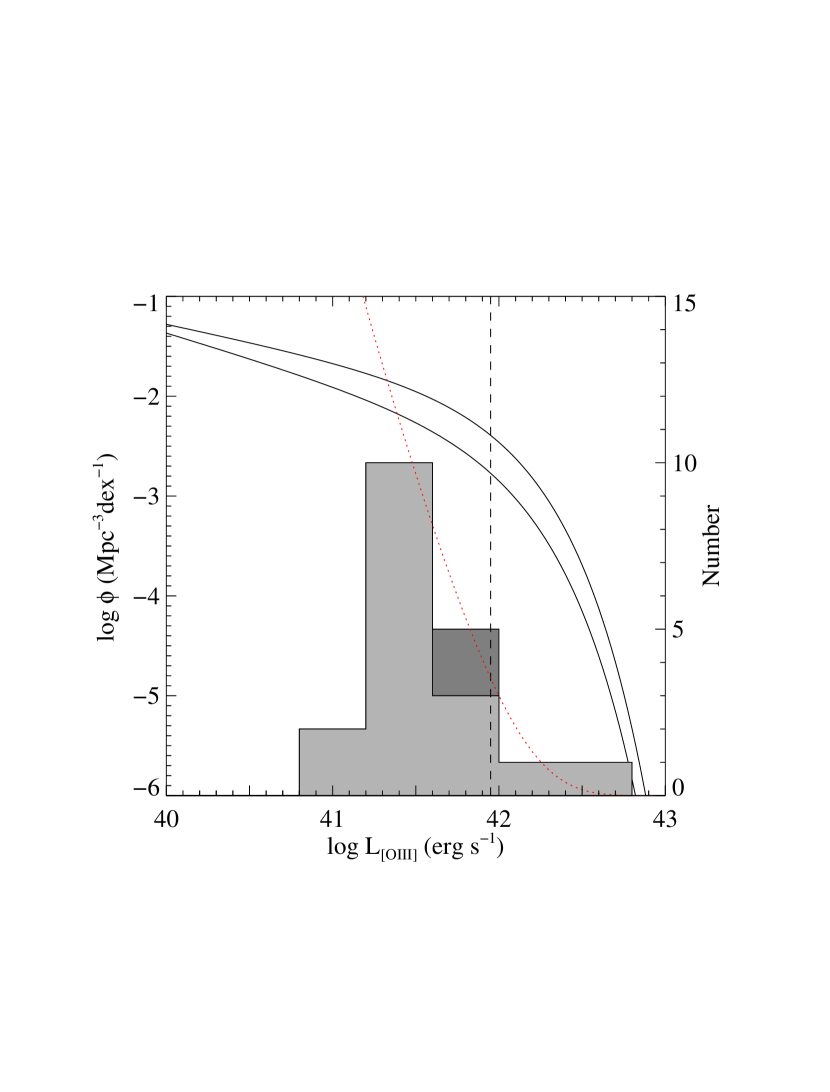
Using the measured redshifts and fluxes we estimate the emission line luminosities for the cosmological parameters noted above. Luminosities for all the three lines are also summarised in Table 2. Note that we do not apply any correction for the dust reddening or the fact that the fibre need not sample the whole galaxy. This means that the quoted luminosities should be treated as lower limits. In Fig. 3, we compare the distribution of the measured [O iii] luminosities of our galaxies and the [O iii] luminosity functions at from Hippelein et al. (2003). The vertical dotted line marks the luminosity of a galaxy. As expected we mostly detect galaxies with luminosities in the range 0.1-3 , with a median [O iii] luminosity 0.2 . The galaxy along the line of sight towards J113108+202151 has . We study this system in detail using our observations with IUCAA Girawali observatory (IGO) in Section 6.
The sharp decrease seen in the number of galaxies detected at the low luminosity end () is a consequence of our detectability limit, as can be seen from the departure from the dotted curve in Fig. 3, while the decrease at high luminosities () is a natural consequence of the decrease in the number density of very luminous galaxies. As there is a factor 30 spread in the luminosity, this set of galaxies provides a good sample for various followup studies such as measuring the cross-section and filling factor of Mg ii absorbers at low impact parameters (i.e kpc).
3.2 Star-formation rates
In this section, we aim at deriving the star-formation rates of intervening galaxies using emission line luminosities. It is known that the relationship between the observed luminosity of a line and star formation rate depends on dust extinction and metallicity [see for example Argence & Lamareille (2009)]. In the redshift range of galaxies that we focus on in this paper, the H line redshifts into the near-IR wavelengths. Thus we can not use the Balmer decrement to get the dust extinction. Also, as the continuum of the galaxy is combined with that of the QSO, we can not use the SED fitting to get the estimates for reddening.
Using more than 100 000 star-forming galaxies from SDSS, Argence & Lamareille (2009) have provided fitting formulae (their Eqs. 23 and 24) that use uncorrected [O ii] and [H] luminosities to get the star formation rates. The typical quoted dispersion in the SFR is about 0.23 dex. As noted by Argence & Lamareille (2009), the SFR derived using their Eq. 23 is weakly sensitive to the variations in dust attenuation. However, their Eq. 24 provides a SFR estimate that is weakly sensitive to the variations in metallicity. Thus for each galaxy we consider the SFR estimates based on the above-mentioned two equations to provide the realistic range in SFR (last column in Table 2). In this table we also give SFR based only on the [O ii] and [H] calibrators. However, these estimates should be treated as lower limits as the SDSS fibres may collect only part of the emission from the galaxies.
It is clear from Table 2 that the star formation rate in the galaxies in our sample varies between 0.2 and 20 M⊙ yr-1. Roughly half of the galaxies in the sample have a SFR less than 2 M⊙ yr-1. Note that in the case of J132542+255525, there is a very large spread between the SFRs derived using the different calibrators. We caution that the [O ii] and H emission lines in this system are close to the detection limit and using their ratio may lead to a significant overestimation of the SFR and metallicities (see next sub-section). It is interesting to note that all the 5 Ca ii absorption selected galaxies studied by Zych et al. (2007) have a SFR similar to that of galaxies in our sample.
3.3 Emission line metallicities
We use the R23 ratio, ([O ii][O iii])H), as calibrated by Kobulnicky et al. (1999) to measure the metallicities. This calibration provides two solutions for most values of R23, a low and a high metallicity estimates. These are generally referred to as “lower” and “upper” branches of R23. The use of additional line ratios is necessary to break the degeneracy (see Kewley & Ellison, 2008). Unfortunately, the corresponding lines are not covered by the SDSS spectra. Therefore, we provide the lower and upper estimates of the metallicity derived using the R23 ratio only. The oxygen metallicity estimated using uncorrected fluxes are given in Table 3. The columns R23l and R23u refer to the lower and upper branch of R23. It is known that the value of (O/H) estimated with and without dust corrections are consistent with each another within 0.1 dex (Moustakas & Kennicutt, 2006; Lamareille et al., 2006).
| QSO | O/H | ||
|---|---|---|---|
| R23l | R23u | ||
| J080808+064108 | 0.433 | 8.10 | 8.52 |
| J081154+202148 | 0.445 | … | … |
| J091417+325955 | 0.444 | … | … |
| J092913+302225 | 0.439 | 8.00 | 8.59 |
| J094041+341535 | 0.447 | 7.95 | 8.60 |
| J095228+032616 | 0.419 | 8.22 | 8.45 |
| J104223+092708 | 0.592 | 8.27 | 8.41 |
| J113108+202151 | 0.563 | 8.08 | 8.53 |
| J120538+604057 | 0.434 | 8.36 | 8.37 |
| J120908+022734† | 0.669 | 8.38 | 8.33 |
| J121510+141802 | 0.421 | 8.33 | 8.37 |
| J122752+165522 | 0.565 | 7.92 | 8.66 |
| J125339+175832 | 0.401 | 8.24 | 8.42 |
| J132542+255525 | 0.433 | 7.40 | 8.86 |
| J142421+453523 | 0.421 | 7.59 | 8.83 |
| J154542+505759 | 0.525 | 8.56 | 8.21 |
| J161728+061604† | 0.788 | … | … |
| J165508+224150 | 0.453 | 8.06 | 8.54 |
| J165632+414617 | 0.662 | 8.09 | 8.53 |
For comparison the Solar value is O/H (Asplund et al., 2009). No correction for dust has been applied when measuring R23. (Mg ii+[O ii])-selected galaxies.
Mouhcine et al. (2006) pointed out that, for the intermediate redshift galaxies where the degeneracy is lifted using other line indicators, the (O/H) is found to be predominantly close to the value obtained for the upper branch. We find that the (O/H) range in our sample obtained using R23u compares well with that measured in intermediate redshift field galaxies and cluster galaxies (See Kobulnicky & Phillips, 2003; Kobulnicky et al., 2003; Lilly et al., 2003; Mouhcine et al., 2006). This confirms that our galaxy selection is not heavily biased towards high or low metallicity galaxies. However, we wish to point-out that the (O/H) determination based on R23u for the Ca ii and DLA-selected galaxies (Zych et al., 2007) are slightly higher than the values we find for the galaxies in our sample.
4 Analysis of absorption features
The emission line analysis presented in the previous section clearly suggests that the distribution of physical properties of the emission line galaxies in our sample are consistent with that found for field galaxies at similar redshift range. Thus, we have an unbiased, albeit small sample of star-forming galaxies where we will be able to probe the nature of absorption lines they produce in the spectra of background QSOs that are at an impact parameter 10 kpc.
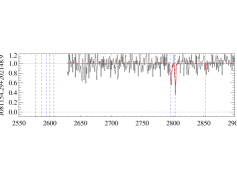
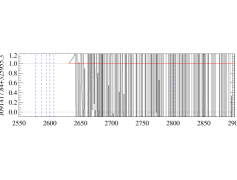
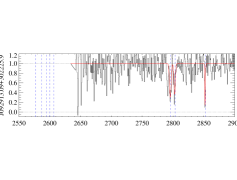
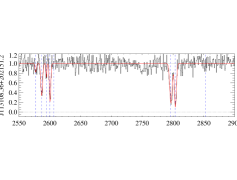
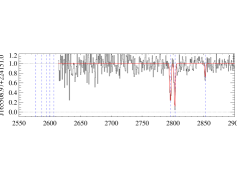
In this section, we analyse the absorption lines produced in the QSO spectra by the emitting galaxies. For this, each quasar spectrum is normalised by dividing the observed spectrum by the quasar continuum. In principle, the galaxy continuum emission should be subtracted prior to normalisation of the spectrum. However, continuum emission from the galaxies is expected to be very small compared to that of the QSO and should have a negligible effect on the measurement of absorption line parameters. The equivalent widths of metal absorption lines are then obtained by simultaneous Gauss-profile fitting, using a single absorption redshift (i.e ) to describe all detected absorption lines but allowing for it to be different from obtained from emission lines. The normalised spectra and gaussian fits to the absorption lines are also shown in Fig. 2. The rest equivalent width of Fe ii , Mg ii and Mg i are provided in Table 4. This table also gives the redshift of the galaxy () and the relative velocity shift between the centroids of the absorption and emission lines ().
| QSO | v | E(B-V)a | Rest equivalent widths (Å) | |||||
|---|---|---|---|---|---|---|---|---|
| () | Fe ii2586 | Fe ii2600 | Mg ii2796 | Mg ii2803 | Mg i2852 | |||
| J080808+064108 | 0.433 | 4(16) | 0.01 | … | … | 2.5(0.5) | 1.9(0.4) | 0.8(0.6) |
| J081154+202148 | 0.445 | 41(15) | 0.04 | … | … | 1.2(0.4) | 1.1(0.3) | 0.3(0.3) |
| J091417+325955b | 0.444 | … | 0.32 | … | … | … | … | … |
| J092913+302225 | 0.439 | -96(13) | 0.02 | … | … | 2.3(0.8) | 1.9(0.6) | 1.3(0.4) |
| J094041+341535 | 0.447 | -16(16) | -0.02d | … | … | 2.1(0.6) | 2.1(0.5) | 0.6(0.3) |
| J095228+032616 | 0.419 | 50(18) | 0.15 | … | … | 2.0(0.7) | 0.6(0.2) | 2.5(0.7) |
| J104223+092708 | 0.592 | -105(16) | 0.02 | 0.6 | 0.6 | 0.6(0.2) | 0.3(0.2) | 0.25 |
| J113108+202151 | 0.563 | 32(7) | -0.01d | 2.4(0.4) | 2.3(0.4) | 4.1(0.4) | 3.6(0.3) | 0.3 |
| J120538+604057 | 0.434 | 59(21) | 0.06 | … | … | 2.5(0.8) | 1.5(0.5) | 0.8(0.9) |
| J120908+022734c | 0.669 | 11(14) | 0.01 | 2.1(0.3) | 2.7(0.3) | 3.2(0.2) | 3.2(0.3) | 1.2(0.2) |
| J121510+141802 | 0.421 | 18(21) | 0.09 | … | … | 1.6(0.8) | 0.6(0.5) | 0.9(0.7) |
| J122752+165522 | 0.565 | 71(12) | 0.04 | 2.5(0.6) | 3.9(0.6) | 12.8 | 5.1 | … |
| J125339+175832 | 0.401 | -41(9) | 0.18 | … | … | 1.2(0.2) | 1.4(0.4) | 0.2(0.3) |
| J132542+255525 | 0.433 | … | 0.03 | … | … | 0.6 | ||
| J142421+453523 | 0.421 | -97(22) | 0.04 | … | … | 3.6(0.7) | 3.1(0.7) | 0.7 |
| J154542+505759 | 0.525 | -58(10) | -0.01d | 1.4(0.5) | 1.0(0.5) | 1.2(0.3) | 2.0(0.4) | 0.9(0.5) |
| J161728+061604c | 0.788 | 104(13) | 0.07 | 2.4(0.3) | 2.7(0.3) | 3.1(0.2) | 3.2(0.3) | 1.3(0.3) |
| J165508+224150 | 0.453 | -57(12) | -0.02d | … | … | 2.2(0.3) | 2.2(0.3) | 0.6(0.3) |
| J165632+414617 | 0.662 | 28(1) | 0.03 | 1.9(0.6) | 1.8(0.6) | 2.6(0.7) | 2.4(0.8) | 1.0(0.7) |
Negative values for E(B-V) are the consequence of intrinsic quasar shape variations. A Lyman-limit system is present at towards this quasar, preventing absorption line measurements at Å. (Mg ii+[O ii])-selected galaxies.
4.1 Mg ii and Fe ii absorption lines
We have chosen the redshift range such that the available SDSS spectrum of each QSO covers the expected wavelength range of Mg ii absorption from the galaxy. In the case of the galaxy towards J091417+325959 (), the flux at the expected position of Mg ii absorption is completely absorbed by a higher redshift Lyman limit system. Similarly in the case of the galaxy towards J122752+165522 the wavelength range of Mg ii absorption is blended with the Lyman- forest absorption from high redshift. In the remaining 15 galaxies that are selected mainly through [O iii] emission we detect Mg ii absorption with rest equivalent widths greater than 1 Å in 13 cases (See Fig. 2). This implies a detection rate of Mg ii absorption with Å to be 87%. Interestingly 9 of these systems have Å (see Table 4). This corresponds to 60% detection rate.
The mean Mg ii equivalent width of our [O iii]-selected galaxy sample is Å (or Å when including the two [O ii]-selected galaxies).
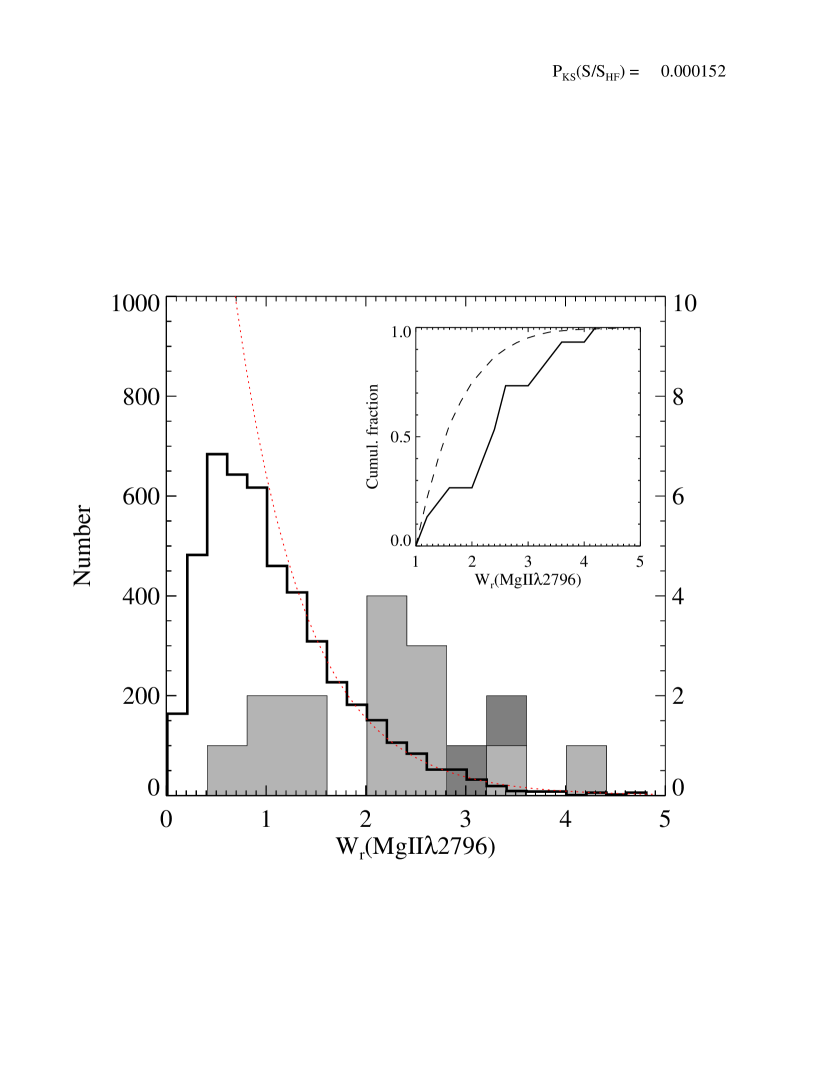
In Fig. 4 we present the distribution of Mg ii equivalent widths from the galaxies in our sample and that obtained at from our automatic search in the SDSS-DR7. Comparing the distribution of Mg ii equivalent widths with the exponential parametrization by Nestor et al. (2005), we find that our sample of Mg ii-selected absorbers is probably complete down to Å. Since [O iii]-selected Mg ii absorbers are selected without any a priori information on their absorbing properties, we can compare the two distributions for equivalenth widths above this value. It is clear from the figure that the Mg ii equivalent widths in our [O iii]-selected sample are predominantly distributed towards higher equivalent widths. A double-side Kolmogorov-Smirnov test gives a probability that the two distributions (for Å) arise from the same parent population. Therefore, Mg ii absorption lines associated to line-emitting galaxies are clearly characterised by larger equivalent widths than the Mg ii-selected absorbers. Below, we address the question of what fraction of strong Mg ii absorption systems in the same redshift range are detected in our emission line search.
In our [O iii]-emission selected sample, we cover the rest wavelength range of Fe ii2586,2600 for 5 galaxies. We detect Fe ii absorption lines in all the cases when Å. In all these cases we find Å and Mg i absorption is also detected. These systems satisfy the criteria defined by Rao et al. (2006) on the equivalent widths of Fe ii, Mg ii and Mg i to select Damped Lyman- systems (see also Rao & Turnshek, 2000). We therefore expect that more than half of the systems in our sample are bona-fide DLAs with . From Fig. 3 of Steidel (1995) it is clear that galaxies associated with DLAs have low impact parameters (i.e 14 kpc) (see also Rao et al., 2003; Chen & Lanzetta, 2003).
4.2 Dust extinction towards QSOs
From Fig. 1 of Argence & Lamareille (2009), we can see that the average dust optical depth in star forming galaxies in their SDSS sample is . This corresponds to an AV of 1.3 and E(B-V) of 0.42 for the assumed RV = 3.1 as in the Galaxy. Therefore quasar absorbers containing large amounts of dust and molecules are likely to be related to star-forming regions in the Universe (e.g. Noterdaeme et al., 2007; Srianand et al., 2008a). Indeed, Wild et al. (2007) statistically detected the nebular [O ii] emission by stacking the spectra of quasars with strong Ca ii absorbers, which have been proved to contain on an average larger amounts of dust than H i-selected DLAs (Wild et al., 2006; Nestor et al., 2008). While dusty absorbers are good candidates to search for the host galaxy emission lines, it is very interesting to verify whether the reciprocal is also true (i.e. whether the absorbers associated to star-forming galaxies within an impact parameter of 10 kpc are also dusty).
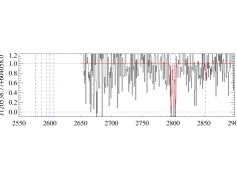
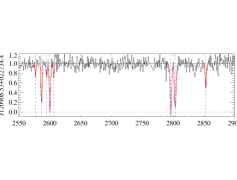
We aim here at deriving the selective reddening E(B-V) of the background QSO produced by the absorbing galaxy. We use the same procedure as described in Srianand et al. (2008a) and Noterdaeme et al. (2009a). In short, we fit the observed spectrum with a SDSS quasar composite spectrum (Vanden Berk et al., 2001), reddened by an extinction law shifted to the redshift of the intervening galaxy. We use the SMC extinction curve given by Gordon et al. (2003), which has been shown to reproduce well the average reddening due to Mg ii absorbers (e.g. Khare et al., 2005; Ménard et al., 2005; Wild et al., 2006; York et al., 2006, see however Srianand et al. 2008a for individual cases). Other extinction laws (LMC, MW) provide similar results as they are very similar in the rest wavelength range of the absorbers covered by the SDSS spectra. QSO-to-QSO intrinsic shape variations are actually the main source of uncertainties. The distribution of E(B-V) is shown on Fig. 5. As can be seen from this figure, the range in intrinsic QSO UV slopes introduces a scatter of about 0.02 mag in the distribution of measured E(B-V).
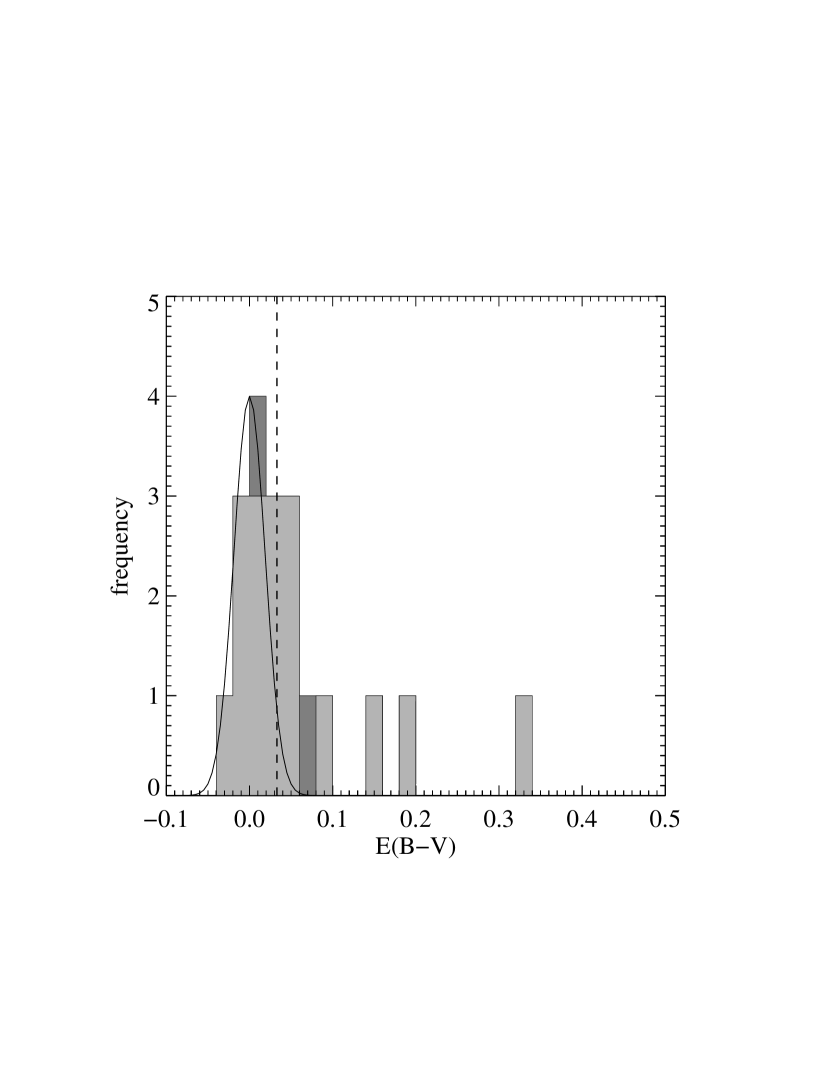
We found three systems (towards J091417+325955, J095228+032616 and J125339+175832) with E(B-V) . For the first system, the reddening of the quasar is derived using a limited wavelength-range because of the presence of a Lyman-limit system. The quasar also has a high redshift (). Therefore, the quoted value of E(B-V) is unreliable. Interestingly, in the case of J095228+032616 in addition to the Mg ii absorption associated with the [O iii] emitting galaxy at there is a strong Mg ii system at with rest equivalent width of the Mg ii doublets 2.6 and 2.3 Å respectively. This system also has very strong Fe ii lines. The QSO SED is reasonably well reproduced assuming the reddening is produced in this system. However, the best fitted curve under-predicts the flux in the blue end of the spectrum. Thus, the E(B-V) value for the galaxy at should be considered as an upper limit. In the case of J125339+175832 the QSO appears to be very red. We also notice that high order Balmer lines as well as Ca ii H and K lines are seen in absorption at the redshift of the QSO. Thus the reddening could be mainly due to the QSO host galaxy.
As can be seen Fig. 5, the distribution is concentrated around a median value E(B-V) = 0.03. Even in the top three cases with high E(B-V) there are indications that the QSO colours are not necessarily reddened by to the emission line galaxy alone. The median value is similar to or slightly higher than what is found for DLAs (E(B-V) 0.02, Murphy & Liske 2004; E(B-V) 0.04, Ellison et al. 2005) and lower than the E(B-V) found in Ca ii absorbers (Wild et al., 2006) and dusty 21-cm and CO absorbers at intermediate redshifts (Srianand et al., 2008a; Noterdaeme et al., 2009a). As expected the measured E(B-V) along the QSO line of sight is much less than that measured for the SDSS galaxies using emission line ratios (Argence & Lamareille, 2009).
4.3 Relationship between emission and absorption
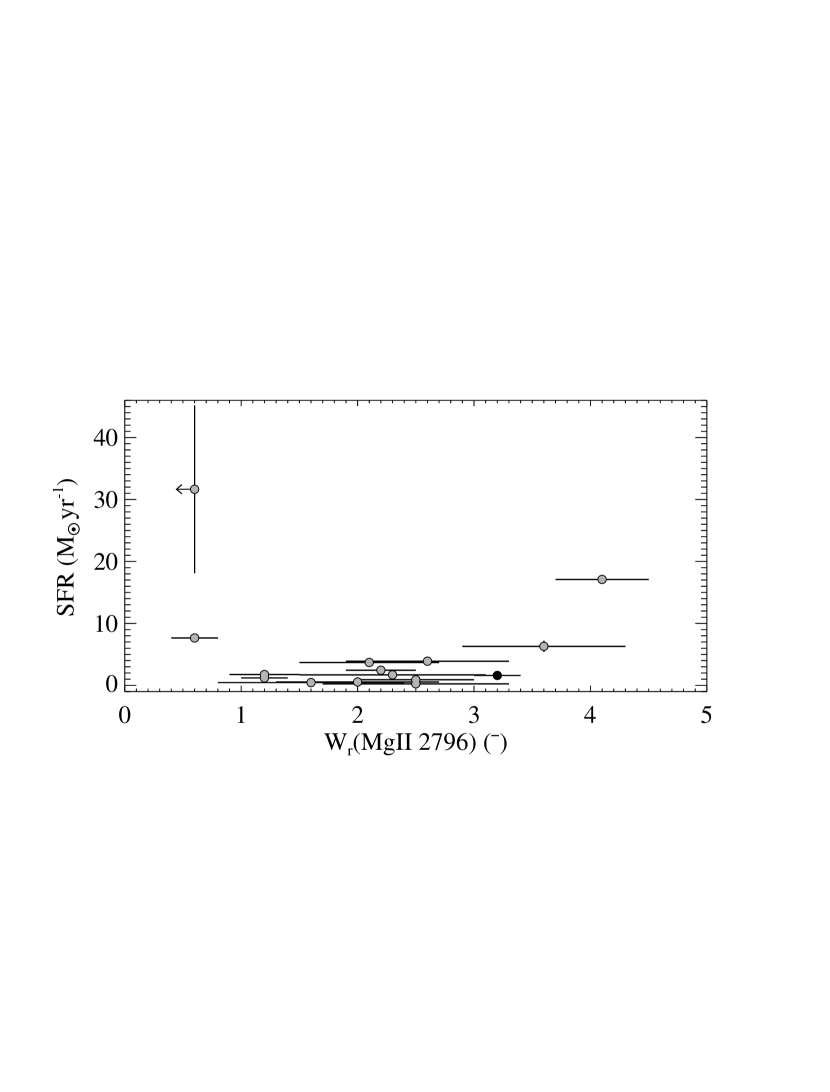
Ledoux et al. (2006) have established a correlation between the velocity width of low ionisation lines and the metallicity of high redshift DLAs. The slope of this relationship is shown to be consistent with the mass-metallicity relation found in local galaxies (Tremonti et al., 2004). In this sub-section we explore various possible correlations between star formation indicators and metallicity indicators from the emission line fluxes and Mg ii equivalent width. We make the assumption that the Mg ii equivalent width reflects the number of components and the velocity spread between them and is not due to line saturation. This assumption allow us to use as an indicator of the velocity spread along the QSO line of sight (see e.g. Nestor et al., 2003; Ellison, 2006).
 |
 |
 |
 |
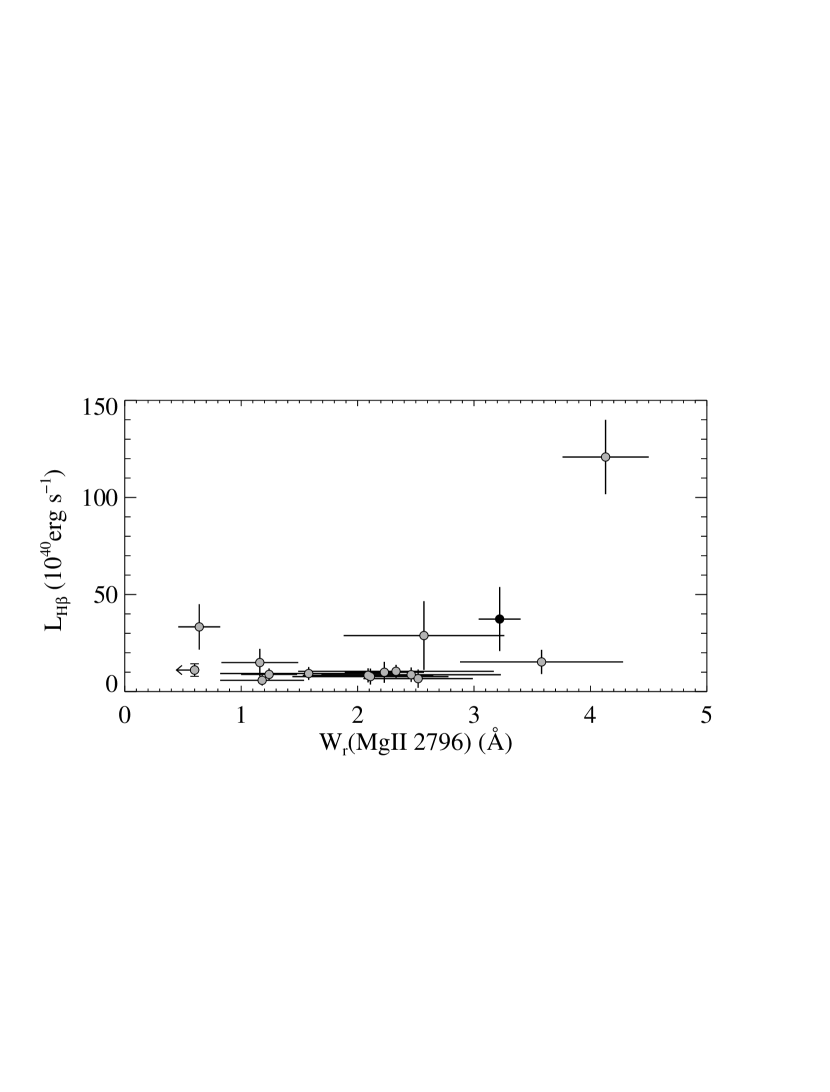
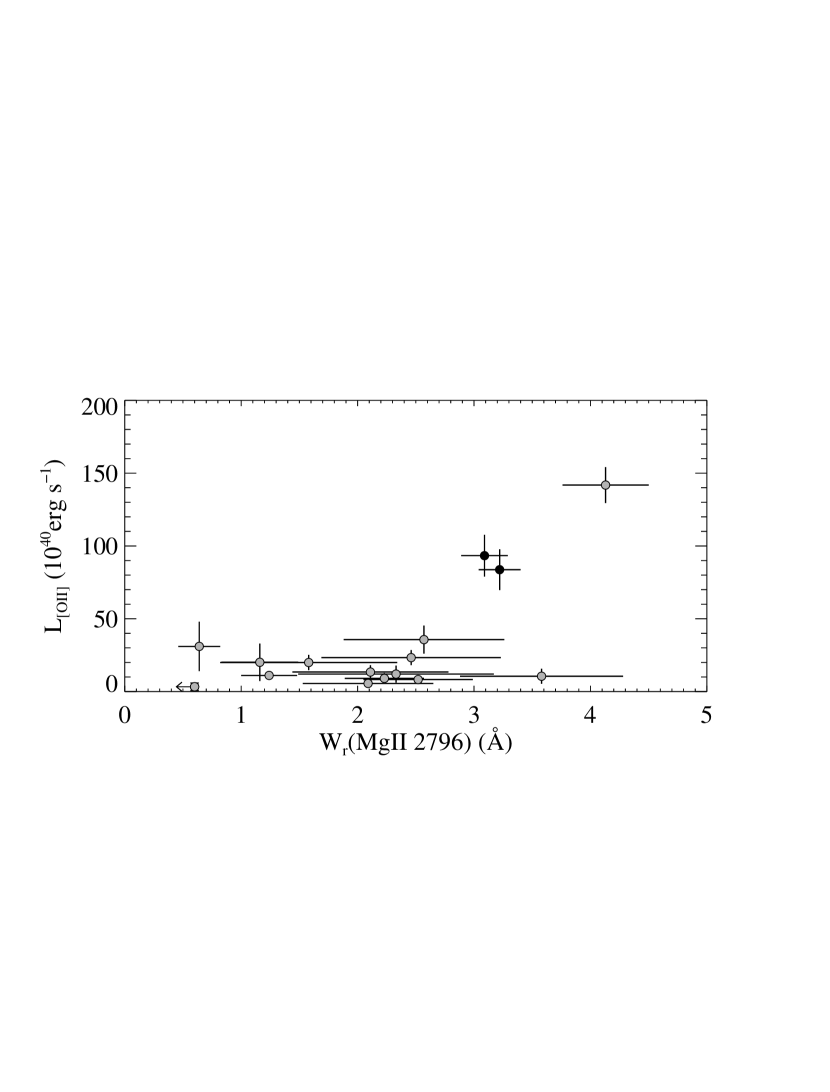
In the three upper panels of Fig 6 we plot the luminosities of [O ii], H and the derived star formation rates as a function of the rest equivalent width of the Mg ii2796 line. No statistically significant correlation is seen between [O ii], H luminosity and . We also do not find any strong correlation between the SFR given in the last column of Table 2 and . However, the largest equivalent width systems are also associated to the largest luminosities. Except from the system towards J132542+255525, this is also true for the SFR. We remind that since the measured [O ii] and H emission line fluxes are very low in this galaxy, it is well possible that the SFR and metallicities, which depend on the line ratios, are significantly over-estimated (see Sect. 3.2).
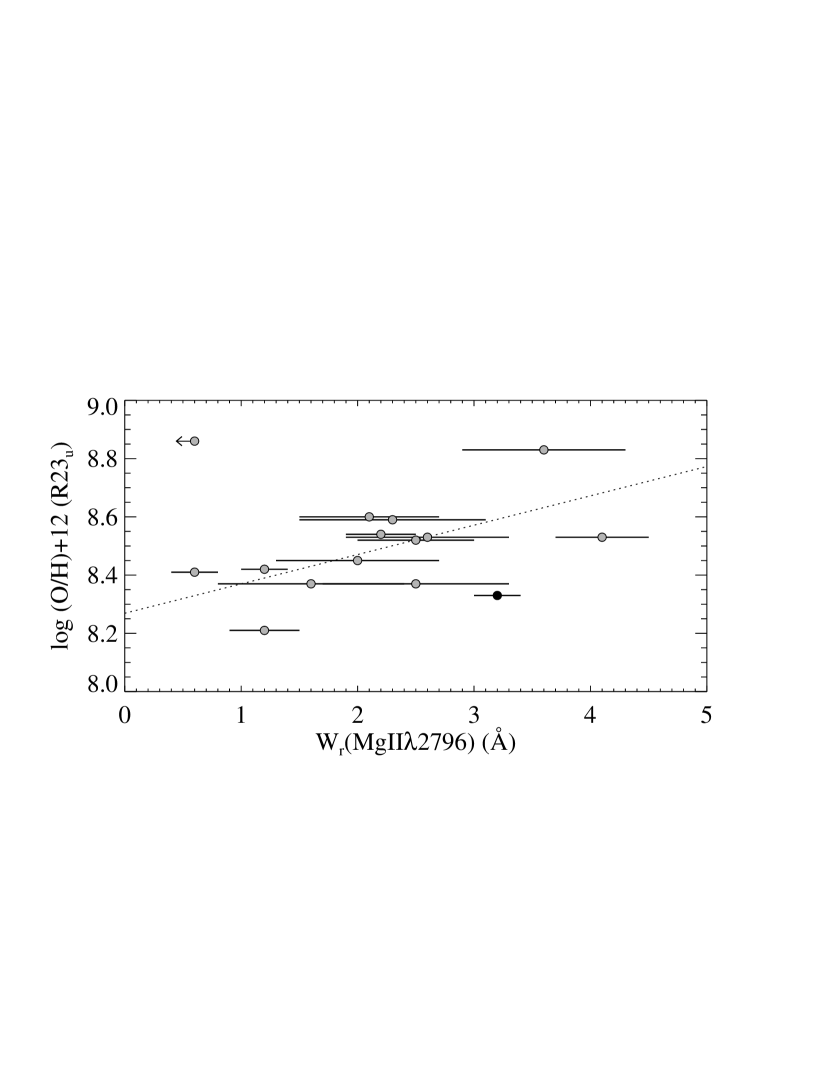
In the bottom panel of Fig. 6, we plot the upper-branch (R23u) estimate of (O/H) as a function of . As pointed-out before, in the absence of additional constraints we end up with two degenerate metallicity measurements using R23. However, in the five line-emitting galaxies studied by Zych et al. (2007) – with similar properties as those presented here – the upper-branch of R23 is preferred. A trend for increasing emission-line metallicities with increasing equivalent width can be seen. The correlation () is significant at the 2 level. However, to draw a firm conclusion on the velocity metallicity correlation we need to remove the degeneracy in the (O/H) estimation and get the velocity spread in the absorbing gas using high resolution spectroscopy. Interestingly, a similar trend is also observed between the Mg ii equivalent width and the gas-phase metallicity measured along the quasar line of sight (e.g. Nestor et al., 2003; Murphy et al., 2007).
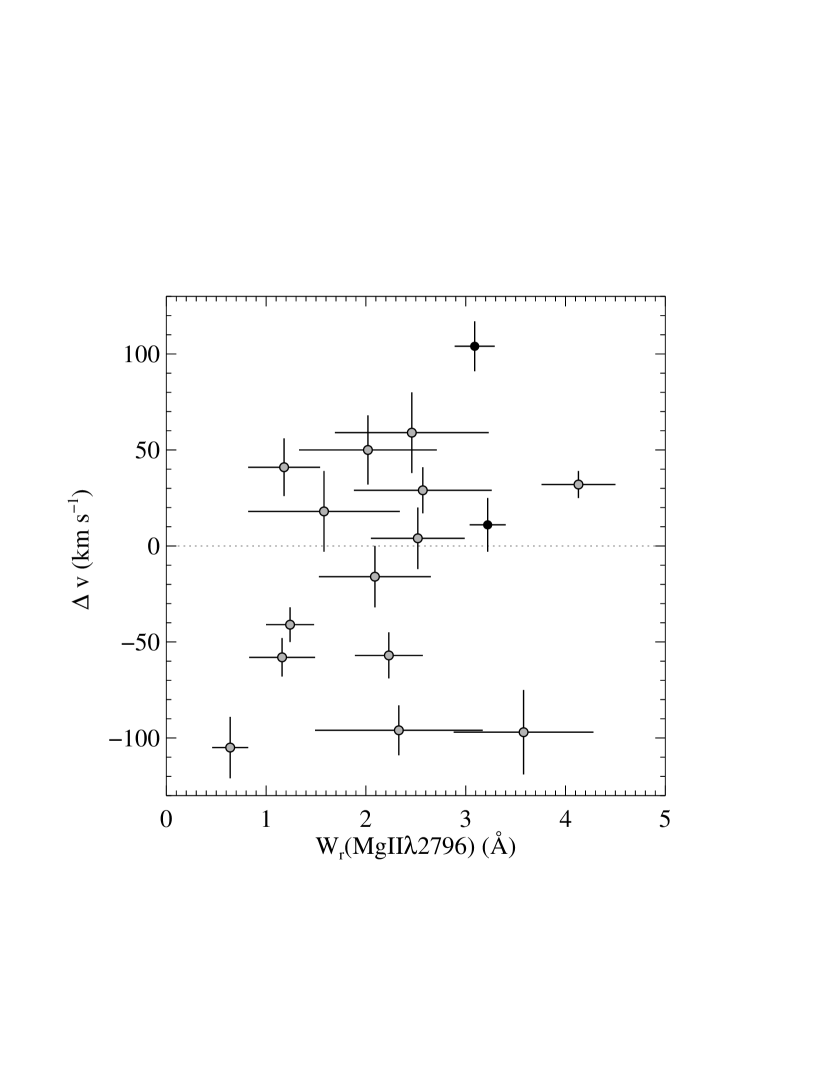
The velocity shifts () between the emission and the absorption lines are quite small (see Table 4), at most about 100 . These are consistent with the expected circular velocities of typical galaxies suggesting the absorbing gas is bounded to the emission line galaxy. We note that the we measure here are lower than that measured with respect to luminous galaxies at larger impact parameters (100-200 for impact parameters 14-75 h-1 kpc Steidel et al., 2002). In Fig. 7 we plot against . We do not find any trend between the two quantities. Although the sample is too small to conclude, this may be explained by the variety of galaxy morphologies found to be associated with low-redshift Mg ii systems (Le Brun et al., 1997).
5 Average line emission from Mg ii absorbers
Based on our automatic search for Mg ii absorption in SDSS-DR7 we find 2319, 1807, 494 and 118 systems respectively with Å, 1-2 Å, 2-3 Å and 3 Å in the redshift range . It is clear from the previous discussion that while most of the emission line galaxies produce strong Mg ii absorption not all the strong Mg ii absorption systems are detected in our [O iii] emission searches. Indeed, the number of strong Mg ii systems (with Å) associated with [O iii]-emitting galaxies detected within the SDSS fibre is about a hundred times less than the total number of strong Mg ii-absorbers. This could be due to (i) poor S/N of the spectra and/or the relative brightness between the QSO and the galaxy, (ii) low star formation rate in the underlying galaxies or (iii) the impact parameter of the emission line regions being larger than 10 kpc (or angular separations more than 1.5”).
To explore the effect of spectral signal-to-noise ratio and galaxy-QSO contrast further, we plot the -band magnitude vs the S/N for all QSOs with intervening Mg ii systems with Å in the redshift range in Fig 8. It is clear from the figure that most of these QSOs have -band magnitudes in a narrow range 18 to 19.5 mag. The spectral signal to noise ratio is constant within a factor 2 in this magnitude range. To the eye there seems to be a tendency for the [O iii]-selected galaxies to prefer slightly fainter -band magnitude (see the upper histogram). However, KS tests do not indicate the differences between two populations to be statistically significant. Thus it seems that there is no clear indication that we could have missed strong emission from most of the Mg ii systems mainly because of the poor signal to noise. It is also clear from Fig. 1 that, in the -magnitude range 18 to 20 mag, the spectral S/N achieved in all the QSO spectra are good enough to detect emission lines with peak flux in excess of 10-17 erg s-1 cm-2 Å-1. Thus the lack of direct detection of emission lines from the strong Mg ii systems is consistent with either their fluxes being small or the impact parameters being large enough so that the emitting regions are not falling inside the fibre.
In order to investigate the average [O ii] and [O iii] emission within 1.5” of associated intervening Mg ii absorption systems, we build several composite spectra corresponding to different ranges of Mg ii equivalent widths. The quasar spectra featuring Mg ii absorption lines in the range where shifted to the absorbers rest frame and combined together using an arithmetic mean. Note that our direct detections are not included in the stacking. The continuum flux in the vicinity of the emission lines was removed using a 2nd-order polynomial fit. Fig. 9 present the resulting composite [O ii] and [O iii] emission lines from intervening Mg ii absorption systems with rest equivalent width in the ranges , 1-2, 2-3 and Å. From this figure, it is clear that the strength of the emission lines increases with the Mg ii equivalent widths. This can also be seen from Table 5 where we give the average luminosity of [O ii] and [O iii] emission lines for different sub-samples defined using . We note that the average [O ii] flux for -2 Å is similar to that obtained by Wild et al. (2007) for Mg ii-selected DLAs ( and ; see Rao et al., 2006).
The average [O iii] luminosity found by stacking Mg ii systems with Å is roughly /10 and close to the lowest luminosity we directly measure in the [O iii]-selected galaxies (in towards J091417+325955). Note that in this case the detection is enabled by the low QSO flux ( = 19.5 mag). As discussed in section 2.1 this system would not have been detected had the QSO being brighter. Zych et al. (2007) have detected emission lines at the redshift of the Ca ii absorber towards J224630.62+131048.5. The rest equivalent width of Mg ii2796 is 2.2 Å. No clear emission lines are detected in the SDSS spectrum. However a galaxy is clearly seen within the area covered by the fibre (See Fig. 5 of Zych et al., 2007) and emission lines (with integrated [O iii] flux of 8 erg cm-2 i.e. lower than our detection limit with SDSS) are detected in the VLT/FORS spectra. We also note that the [O iii] luminosity of this galaxy is similar to the stacked luminosity obtained using systems with Å.
Direct observations of field galaxies at show that the sizes of star-forming galaxies are typically less than 10 kpc (Dahlen et al., 2007; de Mello et al., 2006; Lilly et al., 2003). Integral field spectroscopic observations of Mg ii absorbers at by Bouché et al. (2007) also confirms that H emitting regions of Mg ii-selected galaxies have similar sizes. This means that the galaxies contributing to the stacked emission lines should have impact parameters less than about 20 kpc. Therefore, it is most unlikely that a bright galaxy at high impact parameter (several tens of kpc) will contribute to the average detection of emission lines in the stacked spectrum. The stacking method alone does not provide the higher moments of the -distribution. However, with additional constraints on the galaxy sizes and the small number of direct detections, our results are consistent with at least part of the strong Mg ii absorbers arising from low luminosity galaxies at low-impact parameters, as seen in the case of J224630+131048 (Zych et al., 2007).
| line | Average luminositya for systems with | |||
|---|---|---|---|---|
| W1Å | 1W2 Å | 2W3Å | W3 Å | |
| O ii | 0.5(0.2) | 1.4(0.1) | 3.2(0.2) | 5.1(0.6) |
| O iii | 2.5(0.3) | 3.5(0.3) | 5.1(0.4) | 10.0(0.9) |
a in units of 1040 erg s-1.
It is also interesting to see that the [O iii] and [O ii] emission lines are detected in the stacked spectrum even when we consider only low equivalent widths. In particular there are roughly 4 times more systems with Å compared to that with Å. However the average [O iii] and [O ii] luminosities are less only by a factor 2. Even though our Mg ii-selected systems with low rest equivalent widths ( Å) are likely to be biased towards QSOs with high S/N spectra, it is interesting to see that we detect [O ii] emission at 3 level and that [O iii] is detected at . This means that galaxies with low impact parameters can also produce low equivalent width absorption lines. This is consistent with the fact that we do not detect Mg ii absorption with Å in two of our [O iii]-selected galaxies.
In summary, star-forming galaxies with low [O iii] luminosities seem to provide an important contribution to the population of Mg ii absorption selected galaxies.
6 The case of SDSS J113108+202151
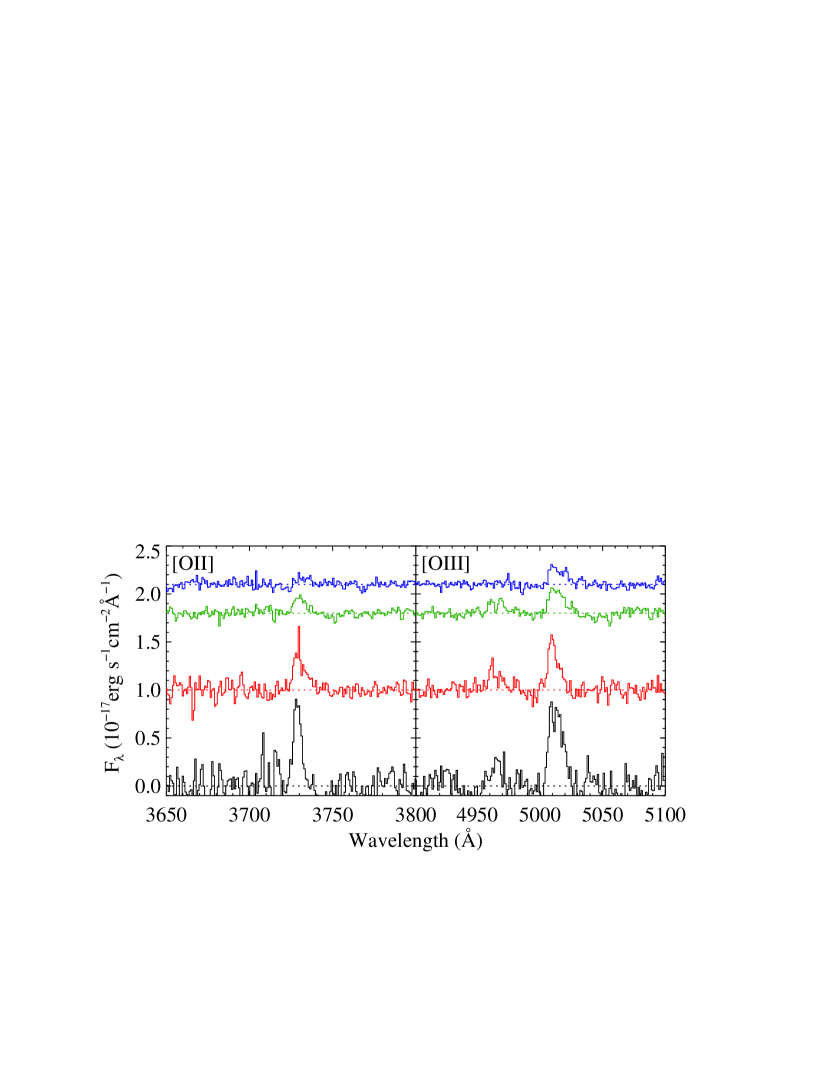
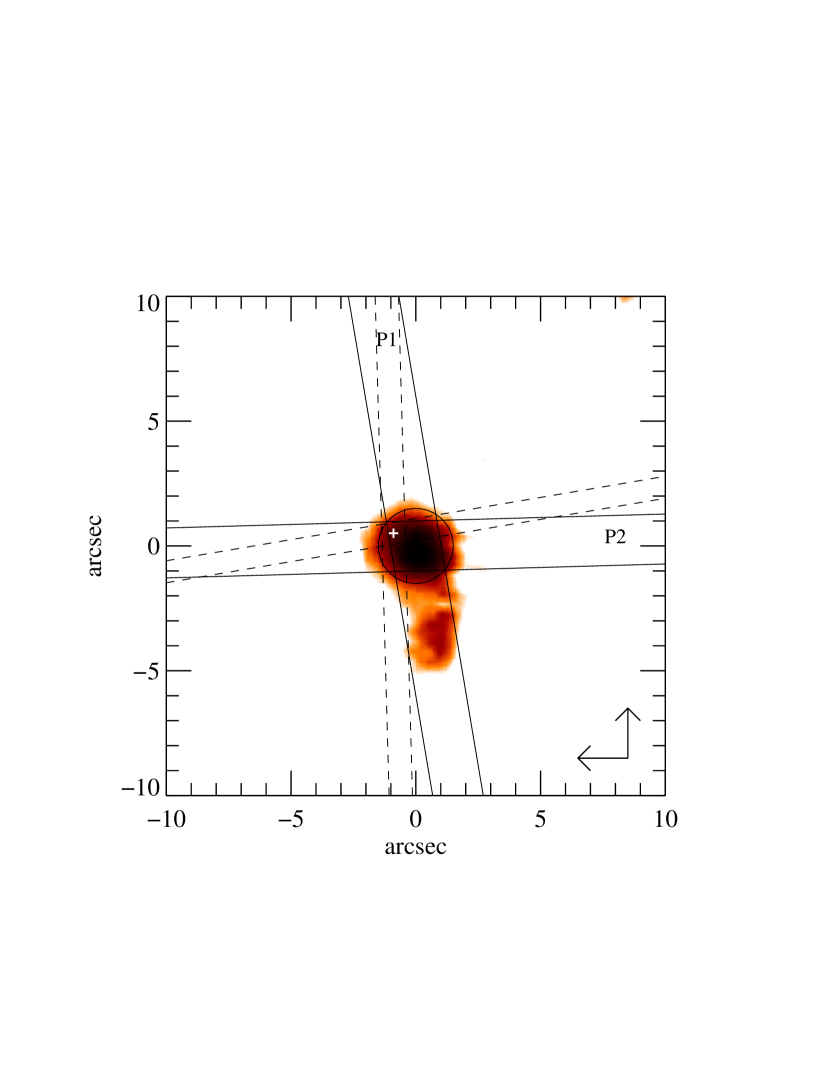
In this section, we study the galaxy at towards J113108+202151 which presents the strongest emission lines in our sample and also the strongest associated Mg ii absorption lines. An extended galaxy (SDSS J113108.31+202147.3) is clearly visible close to the quasar line of sight in the SDSS image, with its centroid located at about 3.5 from the quasar image and extended towards the quasar image (see Fig. 10). Moreover, the photometric redshift provided by SDSS, , is close to that of the detected emission and absorption lines. This is therefore a very good case to study the connection between the galaxy and the absorber.
In order to obtain an accurate measurement of the location of the emission region, we performed long-slit spectroscopy with the 2 m telescope of the IUCAA Girawali Observatory. Observations were carried out on March 20, 2009 using IUCAA Faint Object Spectrograph and Camera (IFOSC). A 2 slit and GR7 grism covering the wavelength range between 3900 Å to 6800 Å were used. The detector used is a LN2 cooled thinned 2k2k CCD camera. Each pixel on the CCD covers 0.34 of sky which corresponds to 1.4 Å using the above grism. Three exposures of 2700 s each were taken at slit position 10 deg from North (P1) and two exposures of 2700 s each were taken at slit position 92 deg from North (P2). The slit positions have been indicated in Fig. 10. For flat fielding Halogen lamp flats were used. Helium and Neon lamps were used simultaneously for getting comparison spectrum. The IRAF routine response was used for making a normalised flat. The doslit package has been used to extract and calibrate the 1D spectrum. Two dimensional analysis was performed using the method described in Vivek et al. (2009).
| arcsec | 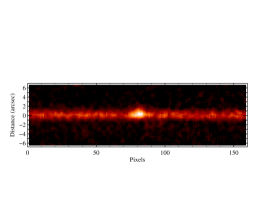 |
 |
|---|---|---|
 |
 |
|
| Dispersion axis (pixels) | ||
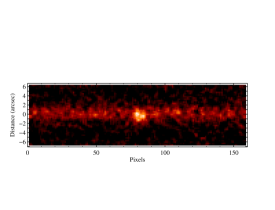
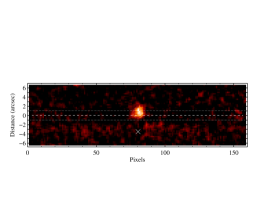
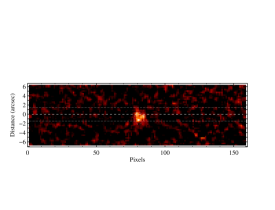
Fig. 11 represents the two-dimensional spectra obtained with the two slit orientations as illustrated on Fig. 10. We removed the quasar trace by fitting a Gaussian in the spatial direction, whose amplitude is allowed to vary smoothly (2nd-order polynomial) with the wavelength. We also left the position of the Gaussian in the spatial direction to vary linearly with the wavelength, to take into account the possible misalignment between the quasar trace and the pixels of the CCD.
The [O ii] emission can be seen as a bright spot in both spectra. Interestingly, despite of aligning the slit with the galaxy seen at 3.5 from the quasar (see Fig. 10), there is no emission line at the corresponding position (marked by a ’X’) in the 2D spectrum. On the contrary, while the second slit angle was chosen to avoid including the galaxy, the [O ii] emission is still detected. This demonstrates the galaxy seen on the SDSS image is not responsible for the detected emission lines. Interestingly, this galaxy does not produce any other detectable absorption line system in the QSO spectra over the wavelength range covered by the SDSS and IGO spectra. We obtained the centroid of the [O ii] emission by fitting the line with a two-dimensional Gaussian function. From triangulating the positions with the two slits, we are able to put a good constraint on the position of the emitting region. We measure an impact parameter , which corresponds to 7 kpc at the redshift of the galaxy. The centroid of the emission region is shown as a white cross on Fig. 10. We see the integrated [O ii] flux measured in IGO and SDSS spectra are consistent with one another suggesting that the whole line-emitting region is within the SDSS fibre.
7 Summary and discussion
Taking advantage of the available 100 000 fibre spectra of quasars in the Sloan Digital Sky Survey-II, DR7, we build a unique sample of 46 star-forming galaxies at detected through their nebular ([O iii] and/or [O ii]) emission lines seen on top of the background quasar spectra. We show the the detectability of [O iii] lines is not biased by the luminosity of the background quasars.
We study both the emission and absorption properties of a sub-sample of 17 galaxies at for which the expected positions of Mg ii lines are covered by the SDSS spectra. The detections show that we are probing a unbiased population of low luminosity [O iii]-emitting galaxies at small impact parameters ( kpc; i.e. the SDSS fibre radius) from the quasar lines of sight. We find that typical properties (metallicity, star-formation rates, kinematics) of these galaxies are similar to that of normal star-forming galaxies at these redshifts. The low E(B-V) we measure along the quasar lines of sight indicates that the absorption lines arise from regions relatively free of dust. This implies that quasar absorbers selected upon the presence of cold gas and dust features (Srianand et al., 2008a, b; Noterdaeme et al., 2009a) might still be the best way to probe the interstellar medium in the densest regions of normal galaxies in the distant Universe.
We find that the equivalent widths of Mg ii absorption lines arising from the [O iii]-selected galaxies are skewed towards higher equivalent widths than the overall population of Mg ii absorbers. However, the [O iii]-selected Mg ii absorbers represent only a small fraction of the overall Mg ii population. From stacking the spectra of quasars featuring strong Mg ii absorbers, we detect the [O ii] and [O iii] emission lines. The average line fluxes are below our typical detection limit in individual spectrum. This suggests that at least part of the strong ( Å) Mg ii absorption systems arise from low luminosity galaxies at small impact parameters. Also strong Mg ii systems have been detected at higher rate around clusters (Lopez et al., 2008). In such cases, the halo sizes of Mg ii systems are inferred to be less than 10 kpc (Padilla et al., 2009).
The absorption properties of the galaxies indicate that at least half of the emission line galaxies in our sample, if not all, contain sufficient neutral gas to produce Damped Lyman- absorption (Rao et al., 2006) as well as 21-cm absorption Gupta et al. (2009) along the quasar line of sight. Unfortunately, most of the QSOs in our sample do not have sufficient radio fluxes to carry-out 21-cm searches.
SDSS spectra allowed us to explore the possible connections between various parameters of the galaxies (such as metallicity, dust content and kinematics) derived from the absorbing gas and that derived from emission lines in a limited redshift range. Nevertheless, our representative sample of 46 galaxies presented in Table 1 is ideally suited for several follow-up observations using space and ground-based telescopes. This should allow one to explore various issues such as: the connection between the reddening along the QSO line of sight and the dust extinction in the line-emitting region; the comparison between the emission and absorption line metallicities; the dependence of the properties of the absorbing gas on the galaxy morphology, kinematics and impact parameter, etc. Finally, we perform long-slit observations of the most luminous galaxy with Mg ii absorption in our sample (SDSS J113108+202151). We show that the [O ii] emission detected in the SDSS spectrum is not detected in the extended bright galaxy seen on the SDSS image. This once again suggests that one should be cautious in associating intervening absorption (or emission) to bright galaxies seen in the field with photometric redshift measurements only.
Acknowledgements
We gratefully thank the anonymous referee for thorough reading of the paper and helpful comments and suggestions. We also thank P. Petitjean and P. Boissé for useful comments on the manuscript. PN acknowledges support from the french Ministry of Foreign and European Affairs. We wish to acknowledge the IUCAA/IGO staff for their support during our observations. We acknowledge the use of the Sloan Digital Sky Survey. Funding for the SDSS and SDSS-II has been provided by the Alfred P. Sloan Foundation, the Participating Institutions, the National Science Foundation, the U.S. Department of Energy, the National Aeronautics and Space Administration, the Japanese Monbukagakusho, the Max Planck Society, and the Higher Education Funding Council for England. The SDSS Web Site is http://www.sdss.org. The SDSS is managed by the Astrophysical Research Consortium for the Participating Institutions. The Participating Institutions are the American Museum of Natural History, Astrophysical Institute Potsdam, University of Basel, University of Cambridge, Case Western Reserve University, University of Chicago, Drexel University, Fermilab, the Institute for Advanced Study, the Japan Participation Group, Johns Hopkins University, the Joint Institute for Nuclear Astrophysics, the Kavli Institute for Particle Astrophysics and Cosmology, the Korean Scientist Group, the Chinese Academy of Sciences (LAMOST), Los Alamos National Laboratory, the Max-Planck-Institute for Astronomy (MPIA), the Max-Planck-Institute for Astrophysics (MPA), New Mexico State University, Ohio State University, University of Pittsburgh, University of Portsmouth, Princeton University, the United States Naval Observatory, and the University of Washington.
References
- Argence & Lamareille (2009) Argence, B. & Lamareille, F., 2009, A&A, 495, 759
- Asplund et al. (2009) Asplund, M., Grevesse, N., Sauval, A. J., & Scott, P., 2009, ARA&A, 47, 481
- Bechtold & Ellingson (1992) Bechtold, J. & Ellingson, E., 1992, ApJ, 396, 20
- Bergeron & Boissé (1991) Bergeron, J. & Boissé, P., 1991, A&A, 243, 344
- Bouché et al. (2007) Bouché, N., Lehnert, M. D., Aguirre, A., Péroux, C., & Bergeron, J., 2007, MNRAS, 378, 525
- Bowen et al. (1995) Bowen, D. V., Blades, J. C., & Pettini, M., 1995, ApJ, 448, 634
- Chen & Lanzetta (2003) Chen, H. & Lanzetta, K. M., 2003, ApJ, 597, 706
- Christensen et al. (2009) Christensen, L., Noterdaeme, P., Petitjean, P., Ledoux, C., & Fynbo, J. P. U., 2009, A&A, 505, 1007
- Dahlen et al. (2007) Dahlen, T., Mobasher, B., Dickinson, M., Ferguson, H. C., Giavalisco, M., Kretchmer, C., & Ravindranath, S., 2007, ApJ, 654, 172
- de Mello et al. (2006) de Mello, D. F., Wadadekar, Y., Dahlen, T., Casertano, S., & Gardner, J. P., 2006, AJ, 131, 216
- Ellison (2006) Ellison, S. L., 2006, MNRAS, 368, 335
- Ellison et al. (2005) Ellison, S. L., Hall, P. B., & Lira, P., 2005, AJ, 130, 1345
- Gordon et al. (2003) Gordon, K. D., Clayton, G. C., Misselt, K. A., Landolt, A. U., & Wolff, M. J., 2003, ApJ, 594, 279
- Gupta et al. (2009) Gupta, N., Srianand, R., Petitjean, P., Noterdaeme, P., & Saikia, D. J., 2009, MNRAS, 398, 201
- Hippelein et al. (2003) Hippelein, H., Maier, C., Meisenheimer, K., et al., 2003, A&A, 402, 65
- Kacprzak et al. (2008) Kacprzak, G. G., Churchill, C. W., Steidel, C. C., & Murphy, M. T., 2008, AJ, 135, 922
- Kennicutt (1998) Kennicutt, Jr., R. C., 1998, ARA&A, 36, 189
- Kewley & Ellison (2008) Kewley, L. J. & Ellison, S. L., 2008, ApJ, 681, 1183
- Kewley et al. (2004) Kewley, L. J., Geller, M. J., & Jansen, R. A., 2004, AJ, 127, 2002
- Khare et al. (2005) Khare, P., York, D. G., vanden Berk, D., et al., 2005, in IAU Colloq. 199: Probing Galaxies through Quasar Absorption Lines, P. Williams, C.-G. Shu, & B. Menard, ed., pp. 427–429
- Kisielius et al. (2009) Kisielius, R., Storey, P. J., Ferland, G. J., & Keenan, F. P., 2009, MNRAS, 397, 903
- Kobulnicky et al. (1999) Kobulnicky, H. A., Kennicutt, Jr., R. C., & Pizagno, J. L., 1999, ApJ, 514, 544
- Kobulnicky & Phillips (2003) Kobulnicky, H. A. & Phillips, A. C., 2003, ApJ, 599, 1031
- Kobulnicky et al. (2003) Kobulnicky, H. A., Willmer, C. N. A., Phillips, A. C., et al., 2003, ApJ, 599, 1006
- Lamareille et al. (2006) Lamareille, F., Contini, T., Brinchmann, J., Le Borgne, J.-F., Charlot, S., & Richard, J., 2006, A&A, 448, 907
- Le Brun et al. (1997) Le Brun, V., Bergeron, J., Boisse, P., & Deharveng, J. M., 1997, A&A, 321, 733
- Ledoux et al. (2006) Ledoux, C., Petitjean, P., Fynbo, J. P. U., Møller, P., & Srianand, R., 2006, A&A, 457, 71
- Lilly et al. (2003) Lilly, S. J., Carollo, C. M., & Stockton, A. N., 2003, ApJ, 597, 730
- Lopez et al. (2008) Lopez, S., Barrientos, L. F., Lira, P., et al., 2008, ApJ, 679, 1144
- Ly et al. (2007) Ly, C., Malkan, M. A., Kashikawa, N., et al., 2007, ApJ, 657, 738
- Markwardt (2009) Markwardt, C. B., 2009, ArXiv e-prints 0902.2850
- Ménard et al. (2005) Ménard, B., Zibetti, S., Nestor, D., & Turnshek, D., 2005, in IAU Colloq. 199: Probing Galaxies through Quasar Absorption Lines, P. Williams, C.-G. Shu, & B. Menard, ed., pp. 86–91
- Mouhcine et al. (2006) Mouhcine, M., Bamford, S. P., Aragón-Salamanca, A., Nakamura, O., & Milvang-Jensen, B., 2006, MNRAS, 369, 891
- Moustakas & Kennicutt (2006) Moustakas, J. & Kennicutt, Jr., R. C., 2006, ApJ, 651, 155
- Murphy et al. (2007) Murphy, M. T., Curran, S. J., Webb, J. K., Ménager, H., & Zych, B. J., 2007, MNRAS, 376, 673
- Murphy & Liske (2004) Murphy, M. T. & Liske, J., 2004, MNRAS, 354, L31
- Nestor et al. (2008) Nestor, D. B., Pettini, M., Hewett, P. C., Rao, S., & Wild, V., 2008, MNRAS, 390, 1670
- Nestor et al. (2003) Nestor, D. B., Rao, S. M., Turnshek, D. A., & Vanden Berk, D., 2003, ApJ, 595, L5
- Nestor et al. (2005) Nestor, D. B., Turnshek, D. A., & Rao, S. M., 2005, ApJ, 628, 637
- Noterdaeme et al. (2009a) Noterdaeme, P., Ledoux, C., Srianand, R., Petitjean, P., & Lopez, S., 2009a, A&A, 503, 765
- Noterdaeme et al. (2009b) Noterdaeme, P., Petitjean, P., Ledoux, C., & Srianand, R., 2009b, A&A, 505, 1087
- Noterdaeme et al. (2007) Noterdaeme, P., Petitjean, P., Srianand, R., Ledoux, C., & Le Petit, F., 2007, A&A, 469, 425
- Padilla et al. (2009) Padilla, N., Lacerna, I., Lopez, S., Barrientos, L. F., Lira, P., Andrews, H., & Tejos, N., 2009, MNRAS, 395, 1135
- Rao et al. (2003) Rao, S. M., Nestor, D. B., Turnshek, D. A., Lane, W. M., Monier, E. M., & Bergeron, J., 2003, ApJ, 595, 94
- Rao & Turnshek (2000) Rao, S. M. & Turnshek, D. A., 2000, ApJS, 130, 1
- Rao et al. (2006) Rao, S. M., Turnshek, D. A., & Nestor, D. B., 2006, ApJ, 636, 610
- Spergel et al. (2003) Spergel, D. N., Verde, L., Peiris, H. V., et al., 2003, ApJS, 148, 175
- Srianand et al. (2008a) Srianand, R., Gupta, N., Petitjean, P., Noterdaeme, P., & Saikia, D. J., 2008a, MNRAS, 391, L69
- Srianand et al. (2008b) Srianand, R., Noterdaeme, P., Ledoux, C., & Petitjean, P., 2008b, A&A, 482, L39
- Steidel (1995) Steidel, C. C., 1995, in QSO Absorption Lines, Meylan, G., ed., p. 139
- Steidel et al. (2002) Steidel, C. C., Kollmeier, J. A., Shapley, A. E., Churchill, C. W., Dickinson, M., & Pettini, M., 2002, ApJ, 570, 526
- Storey & Zeippen (2000) Storey, P. J. & Zeippen, C. J., 2000, MNRAS, 312, 813
- Tremonti et al. (2004) Tremonti, C. A., Heckman, T. M., Kauffmann, G., et al., 2004, ApJ, 613, 898
- Tripp & Bowen (2005) Tripp, T. M. & Bowen, D. V., 2005, in IAU Colloq. 199: Probing Galaxies through Quasar Absorption Lines, Williams, P., Shu, C.-G., & Menard, B., eds., pp. 5–23
- Vanden Berk et al. (2001) Vanden Berk, D. E., Richards, G. T., Bauer, A., et al., 2001, AJ, 122, 549
- Vivek et al. (2009) Vivek, M., Srianand, R., Noterdaeme, P., Mohan, V., & Kuriakosde, V. C., 2009, MNRAS, L321+
- Wild et al. (2006) Wild, V., Hewett, P. C., & Pettini, M., 2006, MNRAS, 367, 211
- Wild et al. (2007) —, 2007, MNRAS, 374, 292
- York et al. (2006) York, D. G., Khare, P., Vanden Berk, D., et al., 2006, MNRAS, 367, 945
- Zych et al. (2007) Zych, B. J., Murphy, M. T., Pettini, M., Hewett, P. C., Ryan-Weber, E. V., & Ellison, S. L., 2007, MNRAS, 379, 1409