A simple model to interpret the ultraviolet, optical and infrared SEDs of galaxies
Abstract
We present a simple, largely empirical but physically motivated model, which is designed to interpret consistently multi-wavelength observations from large samples of galaxies in terms of physical parameters, such as star formation rate, stellar mass and dust content. Our model is both simple and versatile enough to allow the derivation of statistical constraints on the star formation histories and dust contents of large samples of galaxies using a wide range of ultraviolet, optical and infrared observations. We illustrate this by deriving median-likelihood estimates of a set of physical parameters describing the stellar and dust contents of local star-forming galaxies from the Spitzer Infrared Nearby Galaxy Sample (SINGS) and from a newly-matched sample of SDSS galaxies observed with GALEX, 2MASS, and IRAS. The model reproduces well the observed spectral energy distributions of these galaxies across the entire wavelength range from the far-ultraviolet to the far-infrared. We find important correlations between the physical parameters of galaxies which are useful to investigate the star formation activity and dust properties of galaxies. Our model can be straightforwardly applied to interpret observed ultraviolet-to-infrared spectral energy distributions (SEDs) from any galaxy sample.
keywords:
dust, extinction; galaxies: stellar content; galaxies: ISM; galaxies: statistics.1 Introduction
Combined ultraviolet, optical and infrared data are now becoming available for large samples of galaxies. To extract constraints on the stellar populations and ISM of galaxies from these multi-wavelength observations requires the consistent modelling of the emission by stars, gas and dust. A standard approach to this problem is to compute the radiative transfer of the light emitted by evolving stellar populations through gas and dust in the ISM (e.g. Silva et al. 1998, Dopita et al. 2005). Such sophisticated models provide valuable insight into the detailed emission of individual galaxies. However, because of the complexity of radiative transfer calculations, these models are not optimised to derive statistical constraints on physical parameters from observations of large samples of galaxies. We present a simple, largely empirical but physically motivated model which can be used to interpret the mid- and far-infrared SEDs of galaxies consistently with the emission at ultraviolet, optical and near-infrared wavelengths. This model allows us to derive statistical estimates on physical parameters related to the star formation history and dust content of large samples of galaxies.
2 Description of the model
We compute the emission by stars in galaxies using the latest version of the [Bruzual & Charlot (2003)] population synthesis code (Charlot & Bruzual, in prep.). The stellar emission is attenuated using the simple two-component dust model of [Charlot & Fall (2000)], which accounts for the fact that stars are born in dense molecular clouds with typical lifetimes of yr; at later ages, stars migrate to the ambient (diffuse) ISM (see equation 2 in da Cunha et al. 2008). We use an ‘effective absorption’ curve for each component, , where the slope reflects both the optical properties and the spatial distribution of the dust. We adopt for the ambient ISM and for the stellar birth clouds. This prescription allows us to compute the total energy absorbed by dust in the birth clouds and in the ambient ISM; this energy is re-radiated by dust at infrared wavelengths.
We define the total dust luminosity re-radiated by dust in the birth clouds and in the ambient ISM as and , respectively. The total luminosity emitted by dust in the galaxy is then .
We distribute and in wavelength over the range from 3 to 1000 m using four main components:
-
•
the emission from polycyclic aromatic hydrocarbons (PAHs; i.e. mid-infrared emission features),
-
•
the mid-infrared continuum emission from hot dust with temperatures in the range 130–250 K,
-
•
the emission from warm dust in thermal equilibrium with adjustable temperature in the range 30–60 K,
-
•
the emission from cold dust in thermal equilibrium with adjustable temperature in the range 15–25 K.
In stellar birth clouds, the relative contributions to by PAHs, the hot mid-infrared continuum and warm dust are kept as adjustable parameters. These clouds are assumed not to contain any cold dust. In the ambient ISM, the contribution to by cold dust is kept as an adjustable parameter. The relative proportions of the other 3 components are fixed to the values reproducing the mid-infrared cirrus emission of the Milky Way. We find that this minimum number of components is required to account for the infrared SEDs of galaxies in a wide range of star formation histories (see da Cunha et al. 2008 for details).
3 The star formation activity and dust content of local galaxies
The model summarised in the previous section allows us to derive statistical constraints on the physical properties of galaxies from ultraviolet, optical and infrared observations. We build a comprehensive library of stochastic models covering a wide range of star formation histories, metallicities, dust attenuation, dust temperatures and fractional contributions by different dust components to the total infrared luminosity. For each model in the library, we compute the predicted ultraviolet, optical and infrared fluxes in the GALEX, SDSS, 2MASS, Spitzer, IRAS, ISO and SCUBA bands. We compare these predictions with observations of two local samples of galaxies: the Spitzer Infrared Nearby Galaxy Sample (SINGS, Kennicutt et al. 2003), and a sample of 3258 SDSS galaxies with complementary photometric observations by GALEX, 2MASS and IRAS (da Cunha et al. 2009).
For each observed galaxy, we assess how each model in the stochastic library (characterised by a set of randomly drawn physical parameters) fits the observed SED by computing the goodness-of-fit. We build the likelihood distribution of any physical parameter by weighting the value of that parameter in each model of the library by the probability . Our final estimate of the parameter is the median of the likelihood distribution and the associated confidence interval is the 16th–84th percentile range.
3.1 SINGS sample
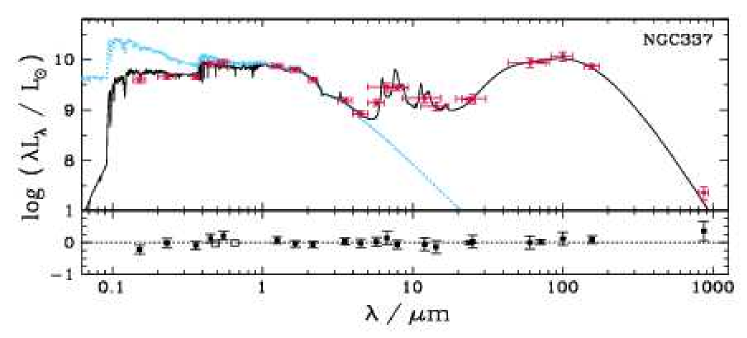
We start by exploiting our model to interpret observed SEDs of the SINGS sample, which contains 75 local galaxies spanning a wide range in morphology and star formation activity. We compare our model predictions with the ultraviolet, optical and infrared observations of these galaxies using the method outlined above. To illustrate the quality of our fits, in Fig. 1, we show an example of the best-fit SED of one galaxy of this sample with median Spitzer infrared colours, NGC 337.
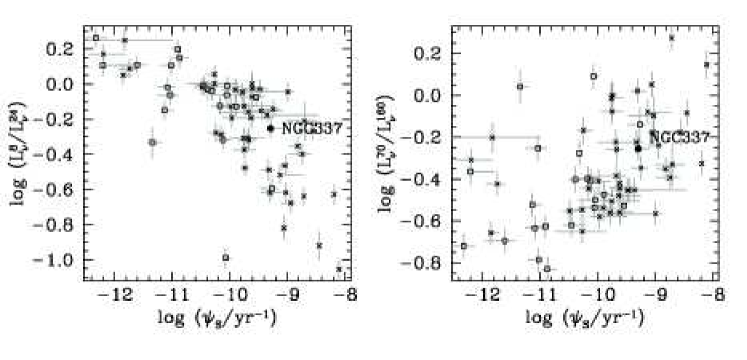
The results of our spectral fits for the full sample show that the mid- and far-infrared colours of galaxies correlate strongly with the specific star formation rate (i.e. star formation rate divided by the stellar mass; see Fig. 2), as well as with other galaxy-wide properties such as the ratio of infrared luminosity between stellar birth clouds and the ambient ISM, the contributions by PAHs and grains in thermal equilibrium to the total infrared emission, and the ratio of dust mass to stellar mass.
3.2 SDSS-IRAS sample
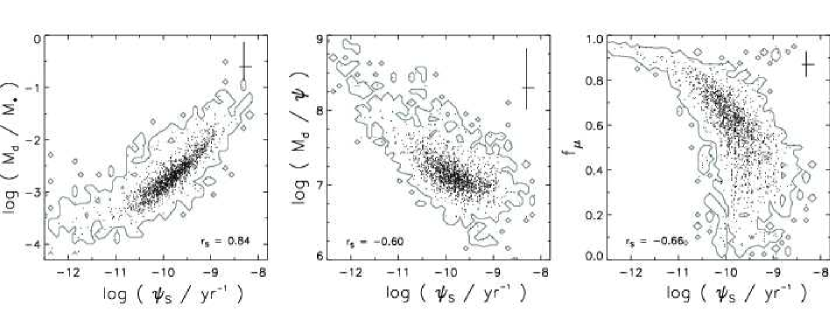
We further investigate the relations between star formation activity and dust content using a sample of 3258 star-forming SDSS galaxies with complementary photometric observations by GALEX, 2MASS and IRAS (da Cunha et al. 2009). We find that the specific star formation rate correlates strongly with the dust-to-stellar mass ratio, the ratio of dust mass to star formation rate and the fraction of dust luminosity contributed by the diffuse ISM (Fig. 3). A comparison with recent models of chemical and dust evolution of galaxies suggests that these correlations could arise, at least in part, from an evolutionary sequence (da Cunha et al. 2009).
Acknowledgements.
E. da Cunha acknowledges the IAU for a travel grant and also financial support from the EU ToK grant 39965 and FP7-REGPOT 206469.References
- [Bruzual & Charlot (2003)] Bruzual, G., Charlot, S. 2003, MNRAS, 344, 1000
- [Charlot & Fall (2000)] Charlot, S., Fall, S. M. 2000, ApJ, 539, 718
- [da Cunha et al. (2008)] da Cunha, E., Charlot, S., Elbaz, D. 2008, MNRAS, 388, 1559
- [da Cunha et al. (2009)] da Cunha, E., Eminian, C., Charlot, S., Blaizot, J. 2009, MNRAS, submitted
- [Dopita et al. (2005)] Dopita, M. A., et al.. 2005, ApJ, 619, 755
- [Kennicutt et al. (2003)] Kennicutt Jr., R. C., et al. 2003, PASP, 115, 928
- [Silva et al. (1998)] Silva, L., Granato, G. L., Bressan, A., Danese, L. 1998, ApJ, 509, 103