The evolution of mass profiles of galaxy clusters
Abstract
We determine the average mass profile of galaxy clusters at two different redshifts and compare its evolution with cosmological model predictions. We use two samples of galaxy clusters spanning similar (evolutionary corrected) mass ranges at different redshifts. The sample of low-redshift () clusters is extracted from the ESO Nearby Abell Cluster Survey (ENACS) catalog. The sample of high-redshift () clusters is mostly made of clusters from the ESO Distant Cluster Survey (EDisCS). We determine the average mass-profiles for these two cluster samples by solving the Jeans equation for hydrostatic equilibrium, using galaxies as tracers. By using two cluster galaxy populations, characterized by the presence and, respectively, absence of emission-lines in their spectra (’ELGs’ and ’nELGs’ hereafter), we are able to partially break the mass-profile orbital-anisotropy degeneracy.
We find that the mass-profiles of both the nearby and the distant clusters are reasonably well fitted by a Navarro, Frenk & White (NFW) model. The best-fit values of the NFW concentration parameter are as predicted by cosmological numerical simulations; cluster mass-density profiles become more concentrated with time. The evolution of the number-density profile of nELGs proceeds in the opposite sense, becoming less concentrated with time.
In our analysis we also recover the orbital anisotropy of nELGs and ELGs . We find that in low- clusters nELGs follow almost isotropic orbits and ELGs have more radially-elongated orbits. In high- clusters both nELGs and ELGs follow radially-elongated orbits.
We discuss these results in terms of the predicted secular mass growth of galaxy clusters and the transformation of ELGs into nELGs.
Keywords:
Galaxies: clusters: general – Galaxies: kinematics and dynamics:
98.65.Cw, 98.62.Ck, 98.62.Dm, 98.80.Es1 Introduction
The study of the mass distribution within clusters and of its evolution with redshift can provide very useful constraints on the nature of dark matter (DM) Spergel and Steinhardt (2000); Meneghetti et al. (2001); Reed et al. (2005) and on the formation and evolution of galaxy clusters and their components Springel et al. (2001); El-Zant et al. (2004); Gao et al. (2004). CDM cosmological simulations have shown that the mass-density profiles of cosmological halos follow a universal profile Navarro et al. (1997),
| (1) |
parameterized by the concentration parameter 111The virial radius is the radius within which the enclosed average mass density of a cluster is 200 times the critical density. The virial mass is the mass enclosed within a sphere of radius . The circular velocity is defined from the previous two quantities as = .. This universal model, named ’NFW’ after the initials of its proposers, is characterized by a central density cusp. The NFW model has been shown to fit reasonably well the mass-density profile of nearby clusters (e.g. Biviano and Girardi, 2003; Rines et al., 2003; Katgert et al., 2004; Pointecouteau et al., 2005; Biviano and Salucci, 2006; Łokas et al., 2006), although the precise form of the profile near the center has been a matter of debate (e.g. Moore et al., 1999; Hayashi et al., 2004; Diemand et al., 2005).
Cosmological simulations predict a mild dependence of on the halo mass, , and a mild evolution of the relation with redshift, (e.g. Gao et al., 2008; Duffy et al., 2008). Observed values of low- galaxy systems appear to be somewhat higher than theoretical predictions, but the discrepancy mostly concerns low-mass galaxy systems Duffy et al. (2008); Biviano (2008). Massive galaxy clusters at low- have the expected concentrations (e.g. Katgert et al., 2004; Rines and Diaferio, 2006). This is true also for clusters at redshift van der Marel et al. (2000).
Little is known about the mass-density profiles of galaxy clusters at still higher-. Mass-density profile concentrations have so far been estimated for about a dozen clusters in total at Allen et al. (2002); Hoekstra et al. (2002); Jee et al. (2005); Voigt and Fabian (2006); Maughan et al. (2007); Rzepecki et al. (2007); Schmidt and Allen (2007); Halkola et al. (2008), all via gravitational lensing or deep X-ray observations. Here we report on the determination of the average mass-density profile of 19 clusters at (), based on the projected phase-space distribution of cluster galaxies, used as tracers of the gravitational potential.
We adopt km s-1 Mpc-1, , throughout this paper.
2 The samples
We use two samples of galaxy clusters, one at , the EDisCS sample Halliday et al. (2004); White et al. (2005); Poggianti et al. (2006); Desai et al. (2007); Milvang-Jensen et al. (2008), and another at , the ENACS sample Katgert et al. (1996, 1998), to investigate the evolution of the average cluster mass profile.
We select the 15 EDisCS clusters with velocity dispersion km s-1, in order to have a more homogeneous data-set in terms of mass. We then add to this sample four clusters from the MORPHS Dressler et al. (1999); Poggianti et al. (1999), all with masses in the same range covered by the 15 EDisCS clusters. All 19 clusters have sufficiently wide spatial coverage () for the dynamical analysis, as well as homogeneous photometry (which is needed for the determination of the radial incompleteness, see below).
Among the ENACS clusters, we use the 59 ENACS clusters studied in detail by Biviano et al. (2002); Katgert et al. (2004); Biviano and Katgert (2004).
We identify cluster members by the procedure described in Biviano et al. (2006), which has been validated on cluster-sized halos extracted from cosmological numerical simulations Biviano et al. (2006); Wojtak et al. (2007). We then determine cluster line-of-sight (los) velocity dispersions by applying the robust biweight estimator to the velocity distributions of selected cluster members Beers et al. (1990). Cluster masses are determined from the -estimates using the – relation of Mauduit and Mamon (2007).
In summary, our data-set consist of 19 distant clusters from to () with masses from to (mean: ) and 59 nearby clusters from to () with masses from to (mean: ). When account is taken for the predicted evolution in mass between and Adami et al. (2005); Lapi and Cavaliere (2009) the two samples are found to contain halos of similar (evolutionary-corrected) masses at two different cosmic epochs.
Determination of the average cluster mass profile requires stacking together all the clusters in each of the two samples. Stacking is done by scaling the projected clustercentric galaxy distances, , by cluster virial radii, , and the los galaxy velocities (in the cluster rest frame), , by cluster circular velocities, . In such a way we avoid mixing up the virialized regions of the more massive clusters with the unvirialized, external regions of the less massive ones. Since cluster mass profiles are expected to depend very mildly on cluster mass (e.g. Navarro et al., 1997; Dolag et al., 2004), the shape of the stacked cluster mass-profile is expected to be similar to the average shape of the individual cluster mass profiles.
The center of each cluster is defined to be the position of its X-ray surface-brightness peak, when available, or the position of its brightest cluster galaxy otherwise. We only use galaxies in the radial range in the dynamical analysis. At the analysis is unreliable because of the uncertainty in the position of the cluster center, and at the analysis is unreliable because dynamical relaxation is not guaranteed outside the virial region. In this radial range the high- (low-) stacked cluster contains 556 (respectively 2566) galaxies.
We identify two populations of tracers: nELGs, the galaxies without emission lines in their spectra, and ELGs, galaxies with emission lines. More specifically, we classify ELGs the EDisCS galaxies with an [OII] equivalent width Å or with any other line in emission Poggianti et al. (2006) and the MORPHS galaxies with a spectral type different from ’k’, ’k+a’, and ’a+k’ Poggianti et al. (1999). We refer to Katgert et al. (1996) for the ELG classification of ENACS galaxies. The fraction of ELGs among the galaxies selected for the dynamical analysis is 47% in the high- sample, and only 13% in the low- sample, a difference that reflects the evolution of the properties of cluster galaxies Dressler et al. (1999); Poggianti et al. (1999, 2006).
The samples are not spectroscopically complete to a given magnitude. This is not a problem for the dynamical analysis as far as the incompleteness does not depend on radius. The spectroscopic incompleteness is indeed independent on radius for the ENACS Katgert et al. (1998). On the other hand, for the high- cluster sample we need to weigh galaxies according to their radial positions when determining the galaxy number density profiles. The weighting method is described in Poggianti et al. (2006).
In constructing the galaxy number density profiles, we also need to assign different weights to the contributions of different clusters to the number counts in a given radial bin. This is because each cluster contributes galaxies to the stacked sample only out to a limiting radius, which is defined by the observational set-up. Hence, while at small radii all clusters contribute, at large radii we need to correct for those clusters that have not been sampled. The correction method is similar to the one described in Merrifield and Kent (1989) – see Biviano et al. (2002) and Katgert et al. (2004) for applications to the ENACS.
3 The method
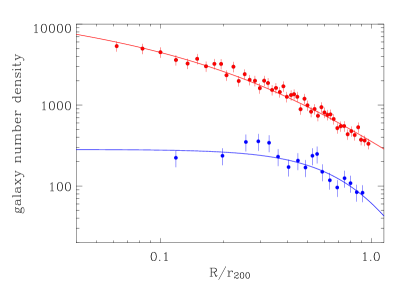
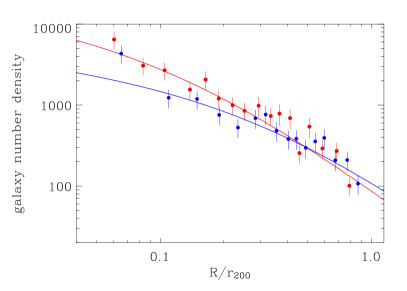
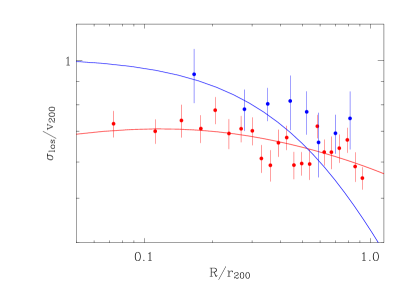
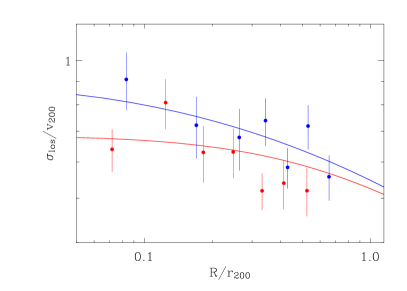
The method we adopt for the dynamical analysis of our two stacked clusters is based on the standard spherically-symmetric Jeans analysis Binney and Tremaine (1987)222Spherical symmetry is imposed by the stacking procedure, which is irrespective of the individual cluster position angles. In this analysis, the observables are the galaxy number density profile and the los velocity dispersion profile . These are displayed in Figures 1 and 2, respectively, separately for the two cluster samples and for the two cluster galaxy populations.
is uniquely related to the 3-D galaxy number density profile via the Abel inversion equation. The other observable, , is then uniquely determined if both the cluster mass profile, , and the cluster velocity anisotropy profile, , are known van der Marel (1994); Binney and Mamon (1982). The velocity anisotropy profile is
| (2) |
where , are the mean squared tangential and radial velocity components, which reduce to and , respectively, in the absence of bulk motions and net rotation (as we assume in the present analysis).
We adopt parameterized model representations of and and determine the best-fit parameters of these models by comparing the observed profile with the predicted one, using the statistics and the uncertainties on the observed profile. In order to reduce the so-called “mass–anisotropy” degeneracy which plagues these kinds of analyses (see, e.g., Merritt, 1987; van der Marel et al., 2000; Łokas and Mamon, 2003) we adopt the method recently suggested by Battaglia et al. (2008). Namely, we consider two independent tracers of the same gravitational potential, nELGs and ELGs, and determine the best-fit parameters of and by a joint -analysis of the best-fits to the profiles of the two populations. Clearly must be the same for both tracers, but can in principle be different, so the degeneracy is only partially broken; however the constraints on the dynamics of the system are significantly stronger than when using a single tracer.
Our choice of the and models is driven by the results of the analysis of cluster-sized halos extracted from cosmological numerical simulations. We adopt the NFW model, eq. (1), parameterized by the concentration , for the mass-density profile and also for the galaxy number-density profile 333More precisely, we fit the projected NFW profile Bartelmann (1996) to ., but we allow different concentrations for the galaxy and the mass distributions. Only when the projected-NFW model does not provide an acceptable fit to , we consider an alternative model,
| (3) |
We refer to this modelCavaliere and Fusco-Femiano (1978) as the ’core’ model, since it is characterized by a central constant density.
We consider two models for the velocity-anisotropy profile . One is the Mamon-Łokas (’MŁ’ hereafter) model Mamon and Łokas (2005)
| (4) |
and the other is the Osipkov-Merritt (’OM’ hereafter) model Osipkov (1979); Merritt (1985)
| (5) |
Both the MŁ and the OM models depend on just one free parameter, the anisotropy radius, , which marks the transition from the central region, where and the galaxy orbits are isotropic, to the external region, where and the galaxy orbits become increasingly radial.
4 Results
4.1 The nearby cluster sample
The nELG is best-fitted by a (projected) NFW profile with . A core model is required to fit the ELG which avoid the central cluster region, with best-fit parameter values and . The best-fit models are displayed in Figure 1 (left panel). Abel-inversion of the best-fitting models provides the 3-D number density profiles .
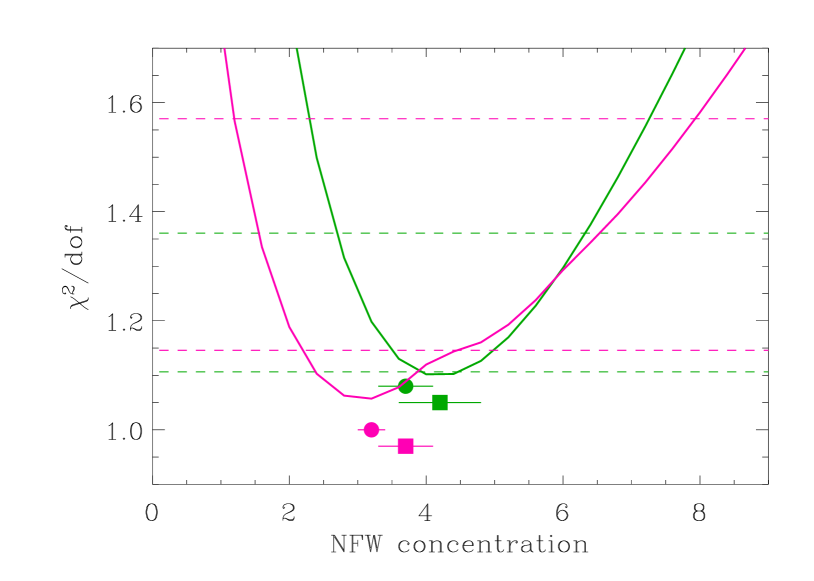
The best-fit parameter of the stacked cluster NFW mass-density profile is determined by a joint fit to the observed -profiles of the nELGs and ELGs. The best-fit solution is obtained when the OM model is adopted for the velocity anisotropy profiles of the two galaxy populations. The best-fit value of the NFW concentration parameter is (90% confidence levels, c.l. in the following), in agreement with Katgert et al. (2004). The vs. solution is displayed in Figure 3 (green curve).
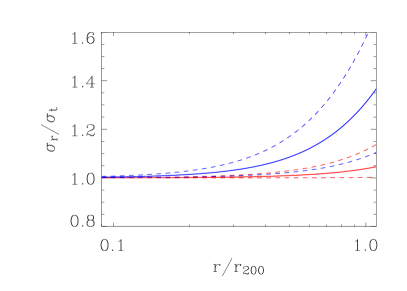
Using this solution for the cluster mass profile we obtain the best-fit OM-model parameters and for the nELG and ELG populations, respectively (90% c.l.). These profiles are shown in the left panel of Figure 4 [where we actually display ]. The best-fit solutions indicate that nELGs follow isotropic orbits within the cluster virial region, and that ELG orbits are isotropic near the center but become increasingly radial in the outer cluster regions. These results are in agreement with Biviano and Katgert (2004).
In Figure 2 (left panel) we display the observed los velocity dispersion profiles, and the best-fit obtained via the Jeans analysis.
4.2 The distant cluster sample
Projected NFW models provide a good fit to the of nELGs and ELGs with best-fit parameters and , respectively (see the right panel of Figure 1). Abel-inversion of these best-fitting models then provide the 3-D number density profiles that we use in the dynamical analysis.
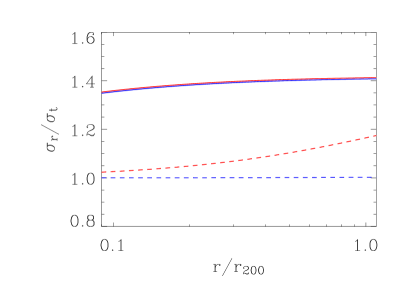
The joint best-fit to the los -profiles of nELGs and ELGs is obtained when the MŁ model is adopted. The mass profile best-fit concentration value is (90% c.l.). The vs. solution is displayed in Figure 3 (pink curve). Using this solution for the stacked cluster mass profile, we find that the best-fit value of the MŁ model parameter , is the same for the nELGs and for the ELGs, , at the lower limit of the -range considered in the minimization analysis. The solution is only poorly constrained, and , for the nELGs and the ELGs, respectively. The best-fit velocity-anisotropy profiles are shown in Figure 4 (right panel). Both cluster galaxy populations are characterized by radially anisotropic orbits, although isotropy cannot be formally excluded for the ELGs, given the uncertainties.
The observed -profiles are shown in the right panel of Figure 2, together with the best-fit solutions from the Jeans analysis.
5 Discussion and perspectives
Using cluster galaxies as tracers of the gravitational potential, we have solved the Jeans analysis for the dynamical equilibrium of a spherical system, and determined the average mass-density profiles of galaxy clusters at and at . These mass-density profiles are well described by NFW models with values which decrease with increasing . The best-fit values are in agreement with the theoretical predictions of CDM models. This can be seen in Figure 3 where we display our best-fit results together with the theoretically predicted mean values. These are determined by using the masses and redshifts of the clusters in our two samples and applying the theoretical relations of Gao et al. (2008) and Duffy et al. (2008).
Our result appears to disagree with the conclusions of Duffy et al. (2008) who claim that the observed values of clusters and groups are significantly above the theoretically expected ones for group- and cluster-sized cosmological halos. However most of the claimed discrepancy is for low-mass galaxy systems, which are not covered by the present analysis. Preliminary dynamical analyses of the mass-density profiles of low- groups Biviano (2008), done with similar techniques as the one employed here, do indicate a discrepancy in the direction reported by Duffy et al. (2008).
An additional result of our dynamical analysis is the determination of galaxy orbits in clusters at low- and high-. We find that these orbits become more isotropic with time. While low- cluster nELGs have nearly isotropic orbits, high- cluster nELGs move on radially elongated orbits, and so do both low- and high- ELGs (compare the left-hand and right-hand panels of Figure 4).
Orbital isotropization might result from the hierarchical accretion process of clusters Gill et al. (2004) which undergo an initial, fast accretion phase, followed by a slower, smoother accretion phase Lapi and Cavaliere (2009). During the fast accretion phase clusters are subject to rapid variations of their gravitational potential Manrique et al. (2003); Peirani et al. (2006); Valluri et al. (2007), and these are capable of isotropizing galaxy orbits Hénon (1964); Lynden-Bell (1967); Kandrup and Siopis (2003); Merritt (2005); Lapi and Cavaliere (2009). The end of the fast accretion phase for cluster-sized halos occurs at Lapi and Cavaliere (2009), hence it is not over yet for most of the clusters of our high- sample. This can explain why the orbits of high- cluster galaxies have not become isotropic yet. At lower-, galaxies that have entered the cluster environment lately may experience only a slower orbital isotropization process, probably caused by ram-pressure Dolag et al. (2009). Cluster ELGs are in this situation, while low- cluster nELGs have developed isotropic orbits already because they were accreted much earlier than ELGs.
The different relative fraction of nELGs and ELGs in low- and high- clusters suggest that ELGs gradually transform into nELGs Poggianti et al. (2006). Since ELGs have a wider spatial distribution in clusters than nELGs, as ELGs join the nELG population, the global nELG spatial distribution become less concentrated. This is indeed observed in our data-sets (compare the red curves in the left and right panels of Figure 1).
The results presented here are still preliminary, as their statistical significance is not very strong given the rather limited size of the data-set for high- cluster galaxies. Substantial improvement in the understanding of the accretion and internal dynamics history of galaxy clusters requires much better statistics. In this sense, the proposed ESA mission “EUCLID”444http://sci.esa.int/science-e/www/area/index.cfm?fareaid=102 for the measurement of Dark Energy is extremely promising. As of this writing, the EUCLID mission proposal considers a 20,000 deg2 spectroscopic survey with a near-IR slitless spectrometer down to a sensitivity level of erg cm-2 s-1 for emission-lines, with a 1/3 sampling rate. Such a survey should return clusters, each with cluster members with measured redshifts, at . By stacking together clusters of similar mass it should be possible to constrain not only the evolution of the average cluster mass-density profile to an accuracy of % in , but also to measure the redshift evolution of the relation. With the same sample it will also be possible to determine the evolution of the ELG orbits in clusters, and to infer the history of cluster mass accretion.
References
- Spergel and Steinhardt (2000) D. N. Spergel, and P. J. Steinhardt, Physical Review Letters 84, 3760–3763 (2000).
- Meneghetti et al. (2001) M. Meneghetti, N. Yoshida, M. Bartelmann, L. Moscardini, V. Springel, G. Tormen, and S. D. M. White, MNRAS 325, 435–442 (2001).
- Reed et al. (2005) D. Reed, F. Governato, L. Verde, J. Gardner, T. Quinn, J. Stadel, D. Merritt, and G. Lake, MNRAS 357, 82–96 (2005).
- Springel et al. (2001) V. Springel, S. D. M. White, G. Tormen, and G. Kauffmann, MNRAS 328, 726–750 (2001).
- El-Zant et al. (2004) A. A. El-Zant, Y. Hoffman, J. Primack, F. Combes, and I. Shlosman, ApJ 607, L75–L78 (2004).
- Gao et al. (2004) L. Gao, G. De Lucia, S. D. M. White, and A. Jenkins, MNRAS 352, L1–L5 (2004).
- Navarro et al. (1997) J. F. Navarro, C. S. Frenk, and S. D. M. White, ApJ 490, 493–508 (1997).
- Biviano and Girardi (2003) A. Biviano, and M. Girardi, ApJ 585, 205–214 (2003).
- Rines et al. (2003) K. Rines, M. J. Geller, M. J. Kurtz, and A. Diaferio, AJ 126, 2152–2170 (2003).
- Katgert et al. (2004) P. Katgert, A. Biviano, and A. Mazure, ApJ 600, 657–669 (2004).
- Pointecouteau et al. (2005) E. Pointecouteau, M. Arnaud, and G. W. Pratt, A&A 435, 1–7 (2005).
- Biviano and Salucci (2006) A. Biviano, and P. Salucci, A&A 452, 75–81 (2006).
- Łokas et al. (2006) E. L. Łokas, R. Wojtak, S. Gottlöber, G. A. Mamon, and F. Prada, MNRAS 367, 1463–1472 (2006).
- Moore et al. (1999) B. Moore, T. Quinn, F. Governato, J. Stadel, and G. Lake, MNRAS 310, 1147–1152 (1999).
- Hayashi et al. (2004) E. Hayashi, J. F. Navarro, C. Power, A. Jenkins, C. S. Frenk, S. D. M. White, V. Springel, J. Stadel, and T. R. Quinn, MNRAS 355, 794–812 (2004).
- Diemand et al. (2005) J. Diemand, M. Zemp, B. Moore, J. Stadel, and C. M. Carollo, MNRAS 364, 665–673 (2005).
- Gao et al. (2008) L. Gao, J. F. Navarro, S. Cole, C. S. Frenk, S. D. M. White, V. Springel, A. Jenkins, and A. F. Neto, MNRAS 387, 536–544 (2008).
- Duffy et al. (2008) A. R. Duffy, J. Schaye, S. T. Kay, and C. Dalla Vecchia, MNRAS 390, L64–L68 (2008).
- Biviano (2008) A. Biviano, arXiv:0811.3535, 2008.
- Rines and Diaferio (2006) K. Rines, and A. Diaferio, AJ 132, 1275–1297 (2006).
- van der Marel et al. (2000) R. P. van der Marel, J. Magorrian, R. G. Carlberg, H. K. C. Yee, and E. Ellingson, AJ 119, 2038–2052 (2000).
- Allen et al. (2002) S. W. Allen, R. W. Schmidt, and A. C. Fabian, MNRAS 335, 256–266 (2002).
- Hoekstra et al. (2002) H. Hoekstra, M. Franx, K. Kuijken, and P. G. van Dokkum, MNRAS 333, 911–922 (2002).
- Jee et al. (2005) M. J. Jee, R. L. White, N. Benítez, H. C. Ford, J. P. Blakeslee, P. Rosati, R. Demarco, and G. D. Illingworth, ApJ 618, 46–67 (2005).
- Voigt and Fabian (2006) L. M. Voigt, and A. C. Fabian, MNRAS 368, 518–533 (2006).
- Maughan et al. (2007) B. J. Maughan, C. Jones, L. R. Jones, and L. Van Speybroeck, ApJ 659, 1125–1137 (2007).
- Rzepecki et al. (2007) J. Rzepecki, M. Lombardi, P. Rosati, A. Bignamini, and P. Tozzi, A&A 471, 743–752 (2007).
- Schmidt and Allen (2007) R. W. Schmidt, and S. W. Allen, MNRAS 379, 209–221 (2007).
- Halkola et al. (2008) A. Halkola, H. Hildebrandt, T. Schrabback, M. Lombardi, M. Bradač, T. Erben, P. Schneider, and D. Wuttke, A&A 481, 65–77 (2008).
- Halliday et al. (2004) C. Halliday, B. Milvang-Jensen, S. Poirier, B. M. Poggianti, P. Jablonka, A. Aragón-Salamanca, R. P. Saglia, G. De Lucia, R. Pelló, L. Simard, D. I. Clowe, G. Rudnick, J. J. Dalcanton, S. D. M. White, and D. Zaritsky, A&A 427, 397–413 (2004).
- White et al. (2005) S. D. M. White, D. I. Clowe, L. Simard, G. Rudnick, G. De Lucia, A. Aragón-Salamanca, R. Bender, P. Best, M. Bremer, S. Charlot, J. Dalcanton, M. Dantel, V. Desai, B. Fort, C. Halliday, P. Jablonka, G. Kauffmann, Y. Mellier, B. Milvang-Jensen, R. Pelló, B. Poggianti, S. Poirier, H. Rottgering, R. Saglia, P. Schneider, and D. Zaritsky, A&A 444, 365–379 (2005).
- Poggianti et al. (2006) B. M. Poggianti, A. von der Linden, G. De Lucia, V. Desai, L. Simard, C. Halliday, A. Aragón-Salamanca, R. Bower, J. Varela, P. Best, D. I. Clowe, J. Dalcanton, P. Jablonka, B. Milvang-Jensen, R. Pello, G. Rudnick, R. Saglia, S. D. M. White, and D. Zaritsky, ApJ 642, 188–215 (2006).
- Desai et al. (2007) V. Desai, J. J. Dalcanton, A. Aragón-Salamanca, P. Jablonka, B. Poggianti, S. M. Gogarten, L. Simard, B. Milvang-Jensen, G. Rudnick, D. Zaritsky, D. Clowe, C. Halliday, R. Pelló, R. Saglia, and S. White, ApJ 660, 1151–1164 (2007).
- Milvang-Jensen et al. (2008) B. Milvang-Jensen, S. Noll, C. Halliday, B. M. Poggianti, P. Jablonka, A. Aragón-Salamanca, R. P. Saglia, N. Nowak, A. von der Linden, G. De Lucia, R. Pelló, J. Moustakas, S. Poirier, S. P. Bamford, D. I. Clowe, J. J. Dalcanton, G. H. Rudnick, L. Simard, S. D. M. White, and D. Zaritsky, A&A 482, 419–449 (2008).
- Katgert et al. (1996) P. Katgert, A. Mazure, J. Perea, R. den Hartog, M. Moles, O. Le Fevre, P. Dubath, P. Focardi, G. Rhee, B. Jones, E. Escalera, A. Biviano, D. Gerbal, and G. Giuricin, A&A 310, 8–30 (1996).
- Katgert et al. (1998) P. Katgert, A. Mazure, R. den Hartog, C. Adami, A. Biviano, and J. Perea, A&As 129, 399–412 (1998).
- Dressler et al. (1999) A. Dressler, I. Smail, B. M. Poggianti, H. Butcher, W. J. Couch, R. S. Ellis, and A. J. Oemler, ApJS 122, 51–80 (1999).
- Poggianti et al. (1999) B. M. Poggianti, I. Smail, A. Dressler, W. J. Couch, A. J. Barger, H. Butcher, R. S. Ellis, and A. J. Oemler, ApJ 518, 576–593 (1999).
- Biviano et al. (2002) A. Biviano, P. Katgert, T. Thomas, and C. Adami, A&A 387, 8–25 (2002).
- Biviano and Katgert (2004) A. Biviano, and P. Katgert, A&A 424, 779–791 (2004).
- Biviano et al. (2006) A. Biviano, G. Murante, S. Borgani, A. Diaferio, K. Dolag, and M. Girardi, A&A 456, 23–36 (2006).
- Wojtak et al. (2007) R. Wojtak, E. L. Łokas, G. A. Mamon, S. Gottlöber, F. Prada, and M. Moles, A&A 466, 437–449 (2007).
- Beers et al. (1990) T. C. Beers, K. Flynn, and K. Gebhardt, AJ 100, 32–46 (1990).
- Mauduit and Mamon (2007) J.-C. Mauduit, and G. A. Mamon, A&A 475, 169–185 (2007).
- Adami et al. (2005) C. Adami, A. Biviano, F. Durret, and A. Mazure, A&A 443, 17–27 (2005).
- Lapi and Cavaliere (2009) A. Lapi, and A. Cavaliere, ApJ 692, 174–186 (2009).
- Dolag et al. (2004) K. Dolag, M. Bartelmann, F. Perrotta, C. Baccigalupi, L. Moscardini, M. Meneghetti, and G. Tormen, A&A 416, 853–864 (2004).
- Merrifield and Kent (1989) M. R. Merrifield, and S. M. Kent, AJ 98, 351–366 (1989).
- Binney and Tremaine (1987) J. Binney, and S. Tremaine, Galactic dynamics, Princeton, NJ, Princeton University Press, 1987, 747 p., 1987.
- van der Marel (1994) R. P. van der Marel, MNRAS 270, 271–297 (1994).
- Binney and Mamon (1982) J. Binney, and G. A. Mamon, MNRAS 200, 361–375 (1982).
- Merritt (1987) D. Merritt, ApJ 313, 121–135 (1987).
- Łokas and Mamon (2003) E. L. Łokas, and G. A. Mamon, MNRAS 343, 401–412 (2003).
- Battaglia et al. (2008) G. Battaglia, A. Helmi, E. Tolstoy, M. Irwin, V. Hill, and P. Jablonka, ApJl 681, L13–L16 (2008).
- Bartelmann (1996) M. Bartelmann, A&A 313, 697–702 (1996).
- Cavaliere and Fusco-Femiano (1978) A. Cavaliere, and R. Fusco-Femiano, A&A 70, 677–+ (1978).
- Mamon and Łokas (2005) G. A. Mamon, and E. L. Łokas, MNRAS 363, 705–722 (2005).
- Osipkov (1979) L. P. Osipkov, Soviet Astronomy Letters 5, 42–44 (1979).
- Merritt (1985) D. Merritt, MNRAS 214, 25P–28P (1985).
- Gill et al. (2004) S. P. D. Gill, A. Knebe, B. K. Gibson, and M. A. Dopita, MNRAS 351, 410–422 (2004).
- Manrique et al. (2003) A. Manrique, A. Raig, E. Salvador-Solé, T. Sanchis, and J. M. Solanes, ApJ 593, 26–37 (2003).
- Peirani et al. (2006) S. Peirani, F. Durier, and J. A. de Freitas Pacheco, MNRAS 367, 1011–1016 (2006).
- Valluri et al. (2007) M. Valluri, I. M. Vass, S. Kazantzidis, A. V. Kravtsov, and C. L. Bohn, ApJ 658, 731–747 (2007).
- Hénon (1964) M. Hénon, Annales d’Astrophysique 27, 83–+ (1964).
- Lynden-Bell (1967) D. Lynden-Bell, MNRAS 136, 101–+ (1967).
- Kandrup and Siopis (2003) H. E. Kandrup, and C. Siopis, MNRAS 345, 727–742 (2003).
- Merritt (2005) D. Merritt, New York Academy Sciences Annals 1045, 3 (2005).
- Dolag et al. (2009) K. Dolag, S. Borgani, G. Murante, and V. Springel, MNRAS 399, 497–514 (2009).