Spitzer IRAC imaging photometric study of the massive star forming region AFGL 437
Abstract
We present Spitzer IRAC mid-infrared photometry on the massive star forming region AFGL 437 (IRAS 03035+5819). From the IRAC colour-colour diagram, we identify several new embedded YSOs within 64 arcsec of the central compact cluster. Using the IRAC ratio images, we investigate the molecular outflows associated with the highly embedded young stellar object WK34 in the central cluster. We attribute the lobes seen (extended to 0.16 pc in the north) in the ratio map to shocked molecular hydrogen emission. IRAC images reveal a large diffuse nebulosity associated with the central cluster and extending up to 8.0 pc from south-west to north-east direction with its brightness gradually increasing from 3.6 to 8.0 m. A dense box-car-shaped nebula (more than 2.0 pc in size) situated to the south-west of the cluster shows molecular hydrogen emission that may have been caused by shock waves from the compact cluster sources. It seems that these sources are also responsible for the infrared-bright nebulosity. Using a 2D radiative transfer model, we derive from the spectral energy distributions, the mass, age and luminosity of all the YSOs identified within the central cluster. The SED modelling shows that the driving engine of the outflows, WK34, appears to be massive but very young and deeply embedded. The weighted mean values of the masses and ages of the 21 YSOs derived from the model are in the range 1-10 M⊙ and 104.1-6.4 yr respectively; while their luminosities are in the range of 100.47-3.48 L⊙.
keywords:
stars: formation – stars: pre-main-sequence – infrared: ISM – ISM: jets and outflows – stars: winds and outflows1 Introduction
Compact clusters embedded in giant molecular clouds provide an opportunity to study recent star formation over a wide range of masses in a small volume (e.g., Lada & Lada (2003)). Due to the large visual extinction suffered by the protostars in such clusters, infrared, especially mid- and far-infrared, observations help in studying them. AFGL 437 (IRAS 03035+5819; G139.909+0.197) is one such compact embedded cluster of size 15 arcsec (Kleinmann et al., 1977; Lada & Lada, 2003) situated at a distance of 2.0 0.5 kpc (Arquilla & Goldsmith, 1984) and having a total luminosity of 2 104 L⊙ (Weintraub & Kastner, 1996). The cluster is associated with an optical reflection nebula and contains at least four embedded sources called AFGL 437N, S, E and W (Cohen & Kuhi, 1977). Rainer & McLean (1987) and later Weintraub & Kastner (1996) resolved a highly embedded source known as WK 34, 2.5 arcsec to the South-East of AFGL 437N. The bright sources in the cluster suffer a large extinction of A 7 mag (Cohen & Kuhi, 1977). Radio observations revealed that AFGL 437W and S, identified as early B type ZAMS stars, are associated with Ultra-Compact (UC) H II regions (Wynn-Williams et al., 1981; Torrelles et al., 1992; Kurtz, Churchwell & Wood, 1994). Wynn-Williams et al. (1981) and Torrelles et al. (1992) have detected water masers towards AFGL 437N and W, which indicate the youth of the region of star formation. Gomez et al. (1992) found a compact, poorly collimated bipolar CO outflow oriented in North-South direction. Studies of the cluster in near-IR polarimetry (Weintraub & Kastner, 1996) and diffraction-limited imaging in 3.8 m (Weintraub et al., 1996) have attributed the outflow to the highly-embedded, low-luminosity source WK 34; this was later confirmed by the HST polarimetric imaging study (Meakin et al., 2005). HST results showed further that the reflection nebulosity is due to the source WK 34. Davis et al. (1998) found H2 emission ‘wisps’ towards the south-west of the compact cluster, but not associated with the outflow. Recent high-resolution C18O study of the region by Saito et al. (2006, 2007) revealed a few dense cores/clumps around the central cluster in AFGL 437, indicating the activity of star formation in the region. de Wit et al. (2009) provided spatially resolved 24.5 m observation on the main sources of the cluster. Sub-mm/mm observations of the cluster were made by Dent et al. (1998) using beam sizes of 16-19 arcsec which do not resolve the cluster members. Devine et al. (2008) determined the age of the cluster to be 1-5 Myr. In the background of a number of these important observations and inferences made already on this interesting massive star forming region, our motivation for the present study has been to look into the available (space) infrared imaging observations beyond 3 m, which are not studied so far, in order to understand the evolutionary stages of the highly embedded cluster members as well as the regions beyond the cluster and compare with the earlier results.
Spitzer Infra-red Array Camera (IRAC) provides an opportunity with an unprecedented high spatial resolution in thermal infrared wavelength regime that is very useful in identifying embedded sources in massive star forming regions. IRAC has four wavelength bands (with , 3.55/0.75, 4.49/1.0, 5.73/1.43 and 7.87/2.91 m) which include molecular emissions such as those from H2 and Polycyclic Aromatic Hydrocarbon (PAH) molecules. The aims of the present study are to identify the embedded sources using the IRAC bands in order to classify the different stages of their evolution; to use ratio maps of the four IRAC bands in order to identify possible H2 emission regions (or PAH regions) following the suggestion of Smith & Rosen (2005) and Povich et al. (2007); and to present the nebulosity associated with the cluster in all the IRAC bands. Further, we construct spectral energy distributions (SEDs) of the identified embedded sources in the cluster using not only the IRAC channels but also observations in JHK bands (Weintraub & Kastner, 1996; Meakin et al., 2005) and mid-IR (de Wit et al., 2009) and sub-mm/mm (Dent et al., 1998) regions; and model the SEDs using the on-line tool developed by Robitaille et al. (2006).
In Section 2, we describe the data used for the present study and the analysis tasks utilised. Section 3 presents the results on Spitzer IRAC photometry of 21 embedded sources associated with the dense young cluster. In the same section, we discuss our results in the light of what is already known about AFGL 437. Further in Section 3, we present the results and discussion on the ratio maps and on the SED modelling of the YSOs. In Section 4, we give the conclusions.
2 Spitzer IRAC Data on AFGL 437 and Data Reduction
The Spitzer Space Telescope (SST) IRAC archival images were obtained from the Spitzer public archive, using ‘leopard’ software (see Fazio et al. (2004), for details on the IRAC instrument). The observations relevant for AFGL 437 were taken in High Dynamic Range (HDR) mode with 12s integration time in all filters. These observations were a part of the project entitled, “The Role of Photo-dissociation Regions in High Mass Star Formation” (Program id 201; PI: G. Fazio). Basic Calibrated Data (BCDs) images were processed for ‘jailbar’ removal, saturation and ‘muxbleed’ correction before making the final mosaic using Mopex and IDL softwares. A pixel ratio (defined as the ratio of the area formed by the original pixel scale, 1.22 arcsec/px, to that of the mosaiced pixel scale) of 2 was adopted for making the mosaic (giving a mosaic pixel scale of 0.86 arcsec/pixel) 111see http://ssc.spitzer.caltech.edu/postbcd/doc/mosaiker.pdf. Using these procedures, a total number of 60 BCD images of 5.2 5.2 arcmin2 were mosaiced to make a final image of 17.4 14.2 arcmin2 in each of the four bands. Aperture photometry was performed on the mosaic with 2.8 pixel aperture and sky annuli of 2.8 and 8.5 pixels using APPHOT task in IRAF package. The zero points for these apertures (including aperture corrections) were, 17.08, 17.30, 16.70 and 15.88 mag for the 3.6, 4.5, 5.8, 8.0 m bands, here onwards called as Ch1, Ch2, Ch3 and Ch4 respectively. The photometric uncertainties vary between 0.01 to 0.22 for the four channels, with Ch3 and Ch4 on the higher side. Ratio maps were produced from the IRAC channel images by using the standard procedure, with a pixel ratio of 8 that reveals the features prominently.
For the purpose of SED modelling, the JHK photometric data were taken from Weintraub & Kastner (1996) and Meakin et al. (2005) as well as from 2MASS archives (Skrutskie et al., 2006). The 24.5m photometric fluxes were obtained from de Wit et al. (2009) (at a diffraction-limited resolution of 0.6 arcsec), for the three main sources, WK34, S and W, in the compact central cluster. In addition, the sub-mm/mm data from Dent et al. (1998) were used as upper limits on the central sources, being unresolved in the large beam sizes. The details of the data compiled on individual sources are given in section 3.3. We modelled the SEDs so constructed using the on-line SED-fitting tool due of Robitaille et al. (2006). A criterion - 3 was chosen to obtain weighted means and standard deviations of individual physical parameters from sets of models for each object. For the SED modelling, we followed a similar procedure as described by Grave & Kumar (2009).
3 Results and Discussion
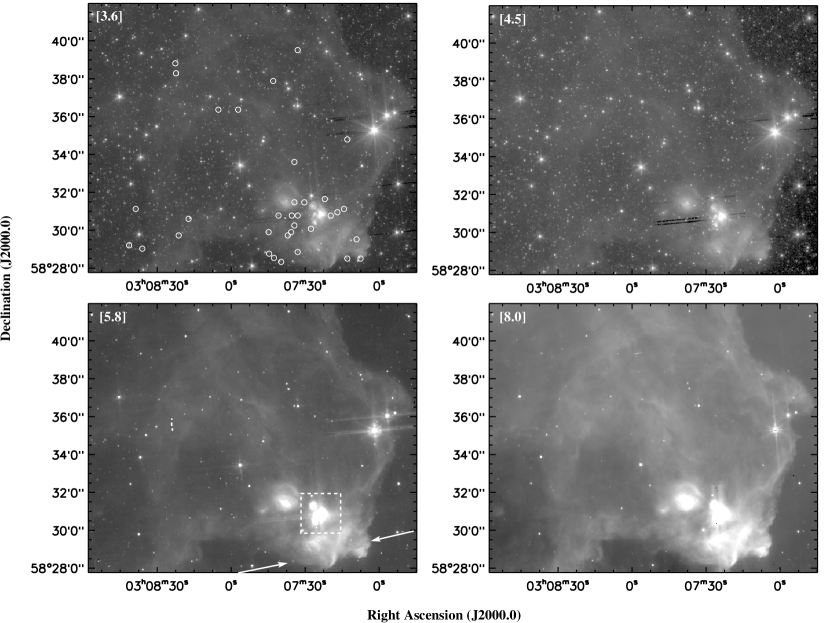
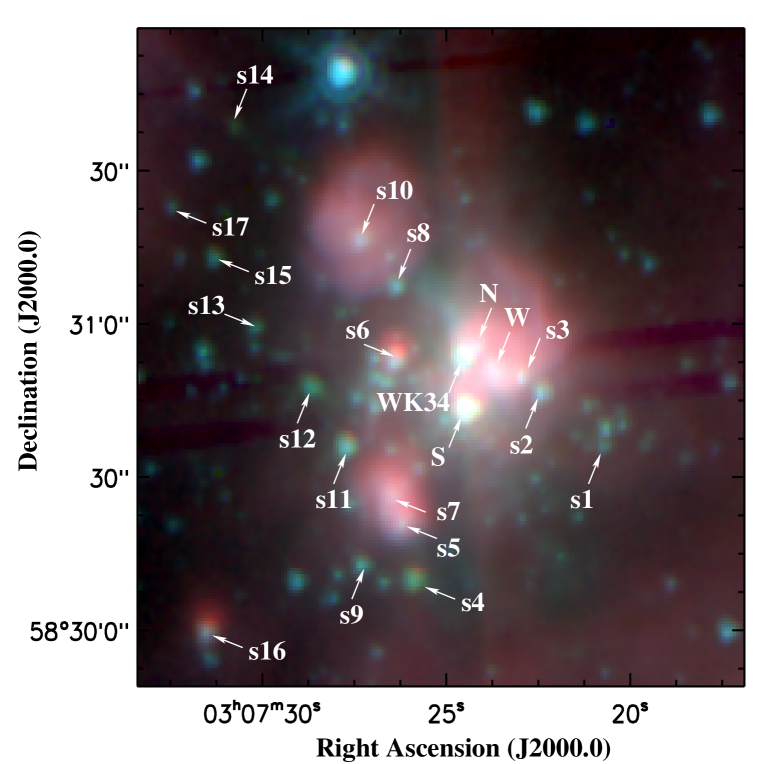
Fig 1 shows the IRAC images of the entire extent of AFGL 437 in all four bands. The central compact cluster is shown marked by a square box in the Ch3 image (bottom left). As shown in Fig 1, the IRAC 8.0 m band image (bottom right) reveals a diffuse bubble-/fan-like nebulous structure associated with and extended from the compact cluster in the south-west to the north-east direction (with a size of 8.0 pc). We find that brightness of the nebulosity gradually increases from 3.6 to 8.0 m (Ch1-Ch4), as seen in Fig 1. One can also notice in Fig 1, several filamentary structures probably due to the UCHII regions associated with AFGL 437S and W in the compact cluster. Just below the box in the south-west in Fig 1 (between the two arrows in Ch3 image in bottom left), one can notice a dense cross-/boxcar-shaped structure that seems to be expanding into the surrounding interstellar medium (ISM). It has bright components in NE & SW (separated by 1.70 pc) and in SE & NW (separated by 1.5 pc) directions. The corners of this boxcar-like structure are seen faintly (as ‘wisps’) in the narrow band H2 image by Davis et al. (1998). We find that this feature becomes more prominent in longer wavelengths (see Fig 1). It may be possible that this was generated through interaction of stellar wind from the sources AFGL 437W & S with the surrounding dense material. The compact cluster (inside the box in Fig 1: Ch3) is shown enlarged in Fig 2 (in a colour composite of three images: Ch1 (blue), Ch2(green) and Ch4 (red)), in which we have marked the central main sources namely AFGL 437 N, S, W and WK34 (E is not detected in IRAC) as well as other YSOs identified in the region (see Section 3.1).
The compact cluster appears very nebulous in all the four bands. As shown by the earlier authors (e.g., Wynn-Williams et al. (1981)), the source AFGL 437W is associated with a blister HII region. It appears like a diffuse source with its brightness increasing progressively in the four IRAC channels Ch1-4 (and is also seen in the 24.5 m image by de Wit et al. (2009)). A dense filamentary structure, seen to the right of AFGL 437W in all the bands, is probably associated with the source and extends to about 38.3 arcsec (0.4 pc) in NE-SW direction (see Section 3.2).
3.1 Cluster Sources
IRAC [3.6]-[4.5] vs [5.8]-[8.0] colour-colour diagram is shown to be a very powerful tool to classify proto-stellar objects into their evolutionary stages, such as Class 0/I, Class II and Class III (Allen et al., 2004). Such a colour-colour diagram for the sources is shown in Fig 3, along with divisions for various pre-main-sequence classes, shown by boxes for Class 0/I, Class II and Class III sources. The criteria for Class I/II, which shares the properties of Class I and Class II, are taken from Megeath et al. (2004). Based on the above criteria, we identify 13-14 sources (including AFGL 437S and WK34) as Class 0/I and 4-5 as Class I/II including AFGL 437W, in the vicinity (within 90 arcsec) of the central compact cluster (see Fig 2). Table 1 gives the photometric magnitudes of these sources, marked as s1, s2 etc. in Fig 2. It may be noted that only 18 sources were detected in all the four channels. We have included in Table 1 three sources (s2, s3 and AFGL 437N) that were not detected in all the four bands, but satisfied one of the two colour criteria for Class I/II or Class II. In the Object column in Table 1, the numbers in parentheses correspond to the sources identified earlier by Weintraub & Kastner (1996) (see their Table 1 and Fig 2). Some of these sources are seen in the K band image of Weintraub & Kastner (1996), but are not detected in J and H bands. From IRAC photometry, we have identified a number of new YSOs, apart from the sources AFGL 437W, S, WK34, s2, s5-s8 and s10 that are classified earlier by Weintraub & Kastner (1996). A large number of these sources are highly embedded and suffer large extinction. We have determined the visual extinction Av for the sources that have JHK photometry (Weintraub & Kastner, 1996; Meakin et al., 2005) and found that WK34 is the most embedded of all, with Av = 30-35 mag. In addition to the Class I and Class I/II cluster sources, about 35 Class II sources (from Fig 3) are also identified outside the cluster, spread over the nebular bubble. These are shown as open circles in Ch1 image in Fig 1 (top left). Most of these sources occur within a distance of about 1.6 pc (165.4 arcsec) southeast of the cluster. For about 23 of these sources, good quality 2MASS JHK photometric colours provide confirmation of their low mass Class II nature. This supports our conjecture that the filamentary structures and the expanding boxcar-like nebula are possibly driven by the central cluster sources.
| Object | RA [2000] | Dec [2000] | Ch1 | Err-Ch1 | Ch2 | Err-Ch2 | Ch3 | Err-Ch3 | Ch4 | Err-Ch4 | class |
|---|---|---|---|---|---|---|---|---|---|---|---|
| s1 (22) | 3:07:20.81 | 58:30:35.60 | 12.65 | 0.03 | 11.97 | 0.01 | 11.56 | 0.19 | 10.02 | 0.12 | I |
| s2 (23) | 3:07:22.53 | 58:30:45.58 | 9.65 | 0.01 | 8.97 | 0.01 | 7.97 | 0.04 | — | — | — |
| s3 (29) | 3:07:23.04 | 58:30:48.90 | 8.86 | 0.04 | 8.16 | 0.03 | — | — | — | — | — |
| W (28) | 3:07:23.88 | 58:30:50.25 | 8.34 | 0.05 | 7.77 | 0.05 | 5.50 | 0.05 | 3.52 | 0.05 | I |
| N (35) | 3:07:24.29 | 58:30:54.84 | — | — | — | — | 5.23 | 0.04 | 3.34 | 0.04 | — |
| S (20) | 3:07:24.53 | 58:30:42.90 | 6.72 | 0.01 | 5.46 | 0.01 | 4.11 | 0.00 | 2.68 | 0.01 | I |
| WK34 (34) | 3:07:24.55 | 58:30:52.76 | 7.24 | 0.03 | 6.05 | 0.01 | 4.98 | 0.03 | 3.51 | 0.05 | I |
| s4 | 3:07:25.94 | 58:30:08.90 | 12.36 | 0.02 | 10.55 | 0.01 | 9.26 | 0.01 | 8.35 | 0.04 | I |
| s5 (7) | 3:07:26.21 | 58:30:20.96 | 9.71 | 0.02 | 9.54 | 0.02 | 6.52 | 0.02 | 4.73 | 0.02 | I/II |
| s6 (31) | 3:07:26.45 | 58:30:52.62 | 9.47 | 0.01 | 8.89 | 0.02 | 6.63 | 0.01 | 4.53 | 0.01 | I |
| s7 (11) | 3:07:26.50 | 58:30:25.42 | 9.60 | 0.02 | 9.40 | 0.02 | 6.63 | 0.02 | 4.85 | 0.05 | I/II |
| s8 (36) | 3:07:26.53 | 58:31:08.32 | 10.76 | 0.03 | 10.24 | 0.02 | 8.98 | 0.02 | 7.32 | 0.04 | I |
| s9 | 3:07:27.38 | 58:30:12.28 | 11.97 | 0.02 | 11.16 | 0.01 | 10.51 | 0.06 | 9.36 | 0.09 | I |
| s10 (40) | 3:07:27.40 | 58:31:15.76 | 10.05 | 0.02 | 9.66 | 0.02 | 8.36 | 0.06 | 6.46 | 0.06 | I/II |
| s11 (17) | 3:07:27.76 | 58:30:35.32 | 10.66 | 0.02 | 9.69 | 0.01 | 8.87 | 0.04 | 7.66 | 0.05 | I |
| s12 | 3:07:28.69 | 58:30:47.39 | 12.68 | 0.03 | 11.22 | 0.01 | 10.81 | 0.08 | 10.30 | 0.22 | I |
| s13 | 3:07:30.22 | 58:30:58.88 | 13.43 | 0.02 | 12.65 | 0.02 | 12.06 | 0.09 | 10.81 | 0.12 | I |
| s14 | 3:07:30.83 | 58:31:37.84 | 15.62 | 0.07 | 14.03 | 0.02 | 12.99 | 0.14 | 11.49 | 0.16 | I |
| s15 | 3:07:31.32 | 58:31:12.45 | 13.20 | 0.01 | 12.53 | 0.01 | 11.74 | 0.03 | 10.35 | 0.03 | I |
| s16 | 3:07:31.56 | 58:29:59.03 | 11.86 | 0.01 | 11.67 | 0.01 | 9.22 | 0.01 | 7.18 | 0.01 | I/II |
| s17 | 3:07:32.60 | 58:31:23.03 | 13.94 | 0.02 | 13.72 | 0.02 | 12.70 | 0.13 | 11.11 | 0.22 | I/II |
3.2 IRAC Ratio Maps
As mentioned earlier, the IRAC bands contain a number of prominent molecular lines/features. Ch1 contains H2 vibrational-rotational lines while Ch2-4 mostly contain pure rotational lines. Ch1, 3 and 4 also contain the PAH features at 3.3, 6.2, 7.7 and 8.6 m; but Ch2 does not include any PAH features. de Muizon et al. (1990) have detected some of the above mentioned PAH features in AFGL 437. As mentioned earlier, Davis et al. (1998) have reported some ‘wisp’-like features of H2 emission (in 2.121 m narrow band filter that contains the 1-0S(1) line) at a few locations in AFGL 437. Several authors have utilised the ratios of IRAC bands to identify some of the molecular diagnostics mentioned above (e.g., Smith & Rosen (2005); Povich et al. (2007); Neufeld & Yuan (2008)). Since it is difficult to assess the contribution of different molecular transitions to different channels, the ratio maps are only indicative; until/unless supplemented by spectroscopic evidence.
The Ch2 is more sensitive to H2 lines of high excitation temperatures while the Ch4 represents rotational lines of low excitation temperatures (Neufeld & Yuan (2008)). Likewise, the Ch2 does not have any PAH features while Ch4 has. Thus, in the ratio image of Ch2/Ch4, the brighter regions indicate emission regions from higher excitations from H2 and the darker regions indicate PAH emission. This trend is reversed in the image of Ch4/Ch2 (i.e., bright regions show PAH emission and dark regions the H2 emission).
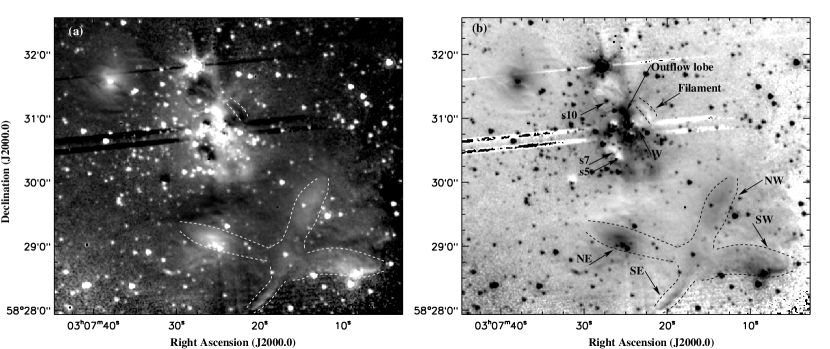
Fig 4 shows the ratio maps of Ch2/Ch4 (a) and Ch4/Ch2 (b) in a region surrounding the central cluster. The bright regions in Fig 4a probably correspond to H2 emission; and those in Fig 4b correspond to PAH emission. The ratio map Ch2/Ch4 (Fig 4a) brings out well the cross-like features towards the south-west edge of the cluster; positions of which match well with the faint ‘wisps’ seen in Davis et al. (1998). These emission features could be the result of the expansion of HII regions or stellar winds interacting with the local ISM. We have looked for PAH features by examining the ratio images of Ch4/Ch2; Ch3/Ch2 and Ch1/Ch2 (since Ch2 does not have any PAH features). Fig 4b shows the ratio map of Ch4/Ch2. The ratio map shows bright regions around AFGL 437W, s5, s7 and s10; as well as towards north of the NE corner of the boxcar nebula. The ratio Ch3/Ch2 (possible indicator for the 6.2 m PAH feature) does not show any bright features. The requisite UV photon flux for exciting the PAH features possibly comes from the source AFGL 437W. The ratio map shows the boxcar/cross shaped feature in dark, probably because of lack of PAH emission. The bright narrow linear filament seen to the right of AFGL 437W (between the dashed lines in Fig 4b) indicates probably the ionization front from the massive star in the wake of which the PAH is excited (Povich et al. (2007)). The detection of the ‘PAH filament’ corroborates the blister model for AFGL 437W presented by Wynn-Williams et al. (1981).
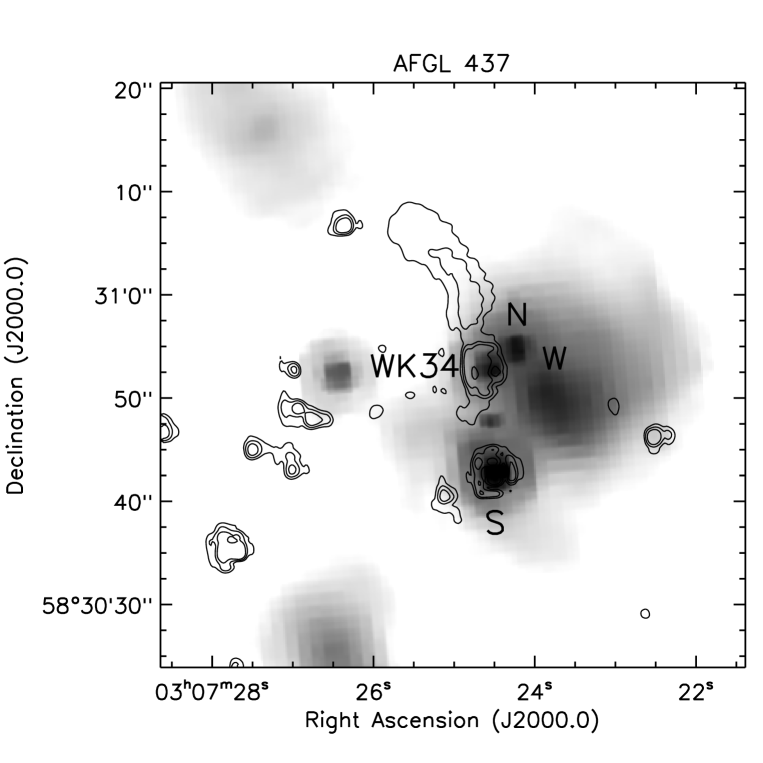
We have examined more closely the ratio map of Ch2/Ch4 to look for the infrared counterpart of molecular outflow originating from the highly embedded YSO WK34. Fig 5 shows a zoomed-in image of Ch2/Ch4 ratio contours over-laid on the Ch4 image. One can notice the prominent lobe/outflow stretched northwards of WK34 and slightly bent towards NE, with a total extension of 0.16 pc. The outflow direction and size are consistent with the earlier reports. The bending itself is attributed to the presence of the nearby source AFGL 437N (Weintraub & Kastner (1996)).
| Source | Age | Degeneracy/ | ||||||
|---|---|---|---|---|---|---|---|---|
| Name | log(yr) | M⊙ | log(T(K)) | log(L⊙) | log(M⊙ yr-1) | log(M⊙ yr-1) | mag | No. of models |
| W | 5.360.19 | 8.281.48 | 4.280.11 | 3.550.23 | -4.840.17 | -7.011.16 | 4.00.7 | 16 |
| S | 4.350.90 | 7.791.72 | 3.860.31 | 3.140.39 | -4.121.30 | -5.841.12 | 9.21.8 | 72 |
| N | 4.820.46 | 9.361.62 | 3.990.19 | 3.480.30 | -3.960.94 | -6.020.84 | 18.08.0 | 132 |
| WK34 | 3.940.57 | 7.231.91 | 3.710.10 | 3.000.30 | -4.060.55 | -4.690.39 | 23.05.6 | 3 |
3.3 SED modelling of Cluster Sources
By modelling the SEDs of the identified YSOs, we derive physical parameters of both their photospheres and mass accreting disks/envelopes. For this purpose, we constructed the SEDs for all the 21 sources listed in Table 1, from the optical to sub-mm data depending upon the availability in the archives and published literature. The optical data222from http://vizier.u-strasbg.fr/viz-bin/VizieR are available only for the sources W (B,V bands), s7 (V upper limit) and s16 (B,V,R upper limits). In fact, the lack of optical data is indicative of the large extinction that most of the sources suffer. The JHK fluxes for the sources s10, s16 and s17 are taken from 2MASS and for s2, s3, s5-s8 and s11 from Weintraub & Kastner (1996). While the source s1 has only K band flux from Weintraub & Kastner (1996), s4, s9, and s12-s15 do not have near-infrared counterparts. The JHK photometric fluxes for WK 34 are taken from Meakin et al. (2005). We have used sub-mm/mm data (Dent et al. (1998)) as upper limits for WK34, S, W and N (because of the large beam sizes that nearly encompass the entire central region of the cluster), only to constrain the models. The rest of the sources listed in Table 1 are outside the field of view of the sub-mm observations. The SEDs are then modelled using an on-line 2D-radiative transfer tool due of Robitaille et al. (2006), which assumes an accretion scenario with a central star surrounded by an accretion disk, an in-falling flattened envelope and bipolar cavities. This tool was successfully tested by Robitaille et al. (2007), on a sample of low mass YSOs and by Grave & Kumar (2009) on high mass protostars. The SED model tool requires a minimum of three data points that are of good quality. In our sample all the 21 sources have at least three such data points. For a source that has meager number of data points, clearly the tool picks out a large number of solutions that can fit the data well, within the specified limit on . If the SED has larger data, spread over the wavelength region of 0.5 to 1000 m, then the model would be better constrained to yield results with least standard deviations (Robitaille et al., 2007). The distance to the source and visual extinction are to be given as input parameters, usually as a range of values. This leads to a further degeneracy of the models. In our case, however, the cluster distance is fairly well-determined and the extinctions were estimated from the available JHK data on individual sources. But, in order to avoid ‘over-interpretation’ of SEDs (Robitaille et al., 2007), we have provided a range of visual extinction values for each object to account for the uncertainties in their determination from JHK photometry. Only those models are accepted which satisfy the criterion of - 3.
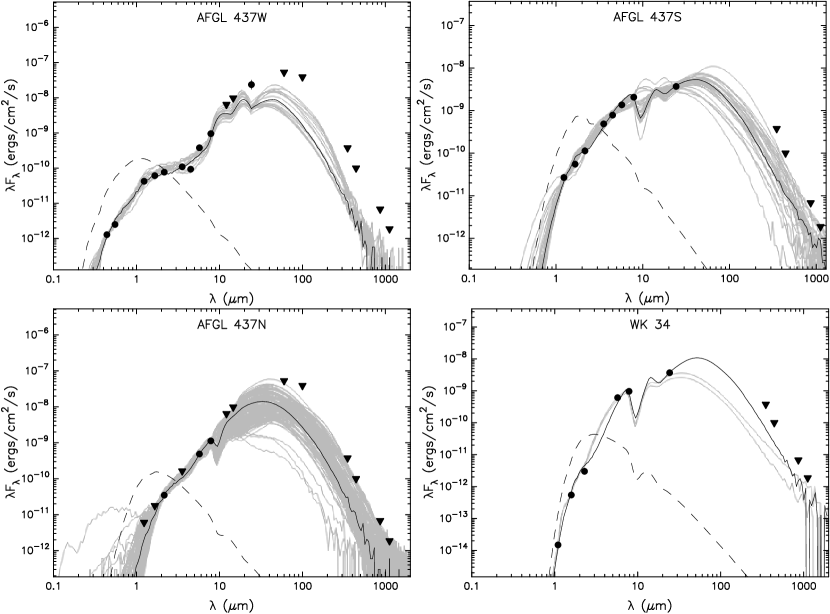
We show in Fig 6 the SED modelling results for the sources AFGL 437W, S, N and WK34. Table 2 gives the weighted mean values of the derived physical parameters for the four sources along with the standard deviations. The table also lists the model-derived weighted mean values of Av with standard deviations and the degeneracy of the models (i.e., the number of solutions that satisfy the criterion mentioned above). The model-derived parameters listed in Table 2 indicate that all the four sources are likely to be massive (early B type). This is consistent (within the standard deviations) with the observations on W and S that are associated with UCHII regions. It may be noted that observationally very little is known about the spectral type of the source N.
The model parameters for WK34 suggest that the source is massive but of young age with effective temperature still not sufficient to create an HII region (see Table 2). Its low luminosity is suggested by earlier workers also. This is also reflected in its outflow, which shows emission in H2 (as revealed by the ratio map in Fig 5) but not in PAH; indicating that WK34 is still not hot enough to produce sufficient UV flux. The modelling suggests that the source AFGL 437W and S are also massive stars but more evolved to attain sufficiently large effective temperature to excite an HII region. Qin et al. (2008) derived a CO outflow entrainment rate of 7.4 M⊙/yr for the outflow source (WK34), which agrees with that observed for massive stars (e.g., Beuther et al. (2002)). In comparison, the low mass stars show much less entrainment rates (Wu et al. (1996)). In a study of the molecular outflows from high mass YSOs, Ridge & Moore (2001) have concluded that these outflows are often poorly collimated, which again points to the possibility that WK34 is a massive protostellar object.
From the SED modelling of the 21 sources, we infer that the weighted mean values of the masses and ages of the YSOs in the central cluster (for the 21 sources listed in Table 1) are in the ranges 1 - 10 M⊙ and 104.1-6.4 yr respectively; while the luminosities are in the range of 100.47-3.48 L⊙.
4 Conclusions
The important conclusions of this work are as follows:
-
1.
Spitzer IRAC imaging photometry is presented on the massive star forming region AFGL 437;
-
2.
Several new embedded YSOs are identified within 90 arcsec of the central compact cluster;
-
3.
The IRAC ratio maps indicate molecular outflow corresponding to WK34 which is possibly due to H2;
-
4.
The SED modelling of the outflow driving source WK34 indicates that it is a massive but very young protostar not yet able to drive a HII region;
-
5.
SED modelling of the 21 sources gives their masses in the range 1-10 M⊙, ages 104.1-6.4 yr and luminosities 100.47-3.48 L⊙.

Acknowledgments
The research work at PRL is supported by the Department of Space, Government of India. This work is based (in part) on observations made with the Spitzer Space Telescope, which is operated by the Jet Propulsion Laboratory, California Institute of Technology under a contract with NASA. We acknowledge the use of data from the 2MASS, which is a joint project of the University of Massachusetts and the Infrared Processing and Analysis Center/California Institute of Technology, funded by the NASA and the NSF. We thank the anonymous referee for constructive comments.
References
- Allen et al. (2004) Allen L. E. et al., 2004, ApJS, 154, 363
- Arquilla & Goldsmith (1984) Arquilla R., and Goldsmith P. F., 1984, ApJ, 279, 664
- Beuther et al. (2002) Beuther H., Schilke P., Sridharan T. K., Meuten K. M., Walmsley C. M., Wyrowski F., 2002, A&A, 383, 892
- Cohen & Kuhi (1977) Cohen M., and Kuhi L. V., 1977, PASP,89,829
- Davis et al. (1998) Davis C. J.,G. Moriarty-schieven G., Eisloffel J., Hoare M. G., and Ray T. P., 1998, AJ,115,1118
- de Muizon et al. (1990) de Muizon Jourdain M., d’Hendecourt L., Geballe T. R., 1990, A&A, 227, 526
- de Wit et al. (2009) de Wit W. J. et al., 2009, A&A, 494, 157
- Dent et al. (1998) Dent W. R. F., Matthews H. E., and Ward-Thompson D., 1998, MNRAS, 301,1049
- Devine et al. (2008) Devine, K.E., Churchwell, E.B., Indebetouw, R., Watson, C., and Crawford, S.M., 2008, AJ, 135, 2095
- Fazio et al. (2004) Fazio G. G. et al., 2004, ApJS, 154, 10
- Flaherty et al. (2007) Flaherty K. M., Pipher J. L., Megeath S. T., Winston E. M., Gutermuth R. A., Muzerolle J., Allen, L. E., and Fazio, G. G., 2007, ApJ, 663, 1069
- Gomez et al. (1992) Gomez J. F., Torelles J. M., Estalalella R., Anglada G., Vades-Montenegro L., and Ho P. T. P., 1992, ApJ, 397, 492
- Grave & Kumar (2009) Grave J. M. C. and Kumar M. S. N., 2009, A&A, 498, 147
- Kleinmann et al. (1977) Kleinmann S. G., Sargent D. G., Gillet F. C., Grasdalen G. L., and Joyce R. R., 1977, ApJ (Letters), 215, L79
- Kurtz, Churchwell & Wood (1994) Kurtz S., Churchwell E., and Wood D. O. S., 1994, ApJS, 91, 659
- Lada & Lada (2003) Lada, C.J., and Lada, E.A., 2003, ARA&A, 41, 57
- Meakin et al. (2005) Meakin C. A., Hines D. C., and Thompson R. I., 2005, ApJ, 634, 1146
- Megeath et al. (2004) Megeath S. T. et al., 2004, ApJS, 154, 367
- Neufeld & Yuan (2008) Neufeld D. A., Yuan Y., 2008, ApJ, 678, 974
- Povich et al. (2007) Povich M. S. et al., 2007, ApJ, 660, 346
- Qin et al. (2008) Qin, S.-L., Wang, J.-J., Zhao, G., Miller, M., and Zhao, J.-H., 2008, A&A, 484, 361
- Rainer & McLean (1987) Rainer J., and McLean I., 1987, in Infrared Astronomy with Arrays, ed. C. G. Wynn-Williams, E. E. Becklin & L. H. Good (Honolulu: Univ. of Hawaii), 272
- Ridge & Moore (2001) Ridge, N.A., & Moore, T.J.T., 2001, A&A, 378, 495
- Robitaille et al. (2006) Robitaille T. P., Whitney B. A., Indebetouw R., Wood K., and Denzmore P., 2006, ApJS, 167, 256
- Robitaille et al. (2007) Robitaille T. P., Whitney B. A., Indebetouw R., and Wood K., 2007, ApJS, 169, 328
- Saito et al. (2006) Saito H., Saito M., Moriguchi Y., and Fukui Y., 2006, PASJ, 58, 343
- Saito et al. (2007) Saito H., Saito M., Sunada K., and Yonekura Y., 2007, ApJ, 659, 459
- Skrutskie et al. (2006) Skrutskie, M. F. et al., 2006, AJ, 131, 1163
- Smith & Rosen (2005) Smith, M. D., and Rosen, A., 2005, MNRAS, 357, 1370
- Torrelles et al. (1992) Torrelles J. M., Gomez J. F., Anglada G., Estalella R., Mauersberger R., and Eiroa C., 1992, ApJ, 392, 616
- Weintraub et al. (1996) Weintraub D. A., Kastner J. H., Gatley I., and Merrill K. M., 1996, ApJ, 468, L45
- Weintraub & Kastner (1996) Weintraub D. A., and Kastner J. H., 1996, ApJ, 458, 670
- Wu et al. (1996) Wu, Y., Huang, M., and He, J., 1996, A&AS, 115, 283W
- Wynn-Williams et al. (1981) Wynn-Williams C. G., Becklin E. E., Beichman C. A., Capps R., Shakeshaft J. R., 1981, ApJ, 246, 801