Significant in-medium mass reduction in GeV Au+Au collisions at the BNL Relativistic Heavy Ion Collider
Abstract
In high energy heavy ion collisions a hot and dense medium is formed, where the or chiral symmetry may temporarily be restored. As a consequence, the mass of the (958) mesons may be reduced to its quark model value, and the abundance of mesons at low may be enhanced by more than a factor of 10. The intercept parameter of the charged pion Bose–Einstein correlations provides a sensitive observable of the possibly enhanced abundance. We have analyzed data from central Au+Au reactions measured at the BNL Relativistic Heavy Ion Collider (RHIC), using extensive Monte Carlo simulations based on six popular models for hadronic multiplicities. Based on the combined STAR and PHENIX data set, and on various systematic investigations of resonance multiplicities and model parameters, we conclude that in central Au+Au reactions the mass of the meson is reduced by , at the 99.9% confidence level in the considered model class. Such a significant mass modification may indicate the restoration of the symmetry in a hot and dense hadronic matter and the return of the ninth “prodigal” Goldstone boson. A similar analysis of NA44 S+Pb data at top CERN Super Proton Synchrotron (SPS) energies showed no significant in-medium mass modification.
pacs:
21.65.Jk,25.75.Gz,14.40.BeI Introduction
In terms of the quark model, one can observe a spontaneous symmetry breaking of the approximate symmetry, resulting in nine pseudo-Goldstone bosons, that are usually associated with the light mesons formed as quark-antiquark bound states. This naïve picture is, however, complicated by the fact that the meson has a large mass of the order of 1 . As early as 1970, Kobayashi and Maskawa concluded that the large mass of the meson (formerly known as ) is a serious problem that is difficult to understand in a chiral model with an explicit symmetry breaking term between singlet and octet states Kobayashi:1970ji . They found that the existence of an effective six-quark determinantial vertex is necessary. As shown by ’t Hooft in 1976, this vertex is contained in instanton-induced quark interactions 'tHooft:1976fv . An interesting aspect of this Kobayashi-Maskawa-’t Hooft or KMT term Kunihiro:2009ds is that it can give rise to a flavor mixing in the scalar as well as in the pseudoscalar channels. The coupling between the pseudoscalar singlet and octet states and arises both from the breaking and the anomaly terms, assuming isospin symmetry. The physical and mesons are given by the mixing of the and modes, and the mass of the singlet state turns out to be sensitive to the strength of the KMT vertex. An explicit calculation for the general case gives the mixing angle Kunihiro:2009ds .
The and mesons change their masses as a function of the temperature , due to both the dependence of the quark condensate, and the possible decrease of the KMT coupling constant with increasing . The mixing angle also becomes dependent: as the temperature increases, mixing between and approximates the ideal one, and the component in the physical decreases. On the other hand, with increasing , the tends to play the role of the ninth Nambu-Goldstone boson of the symmetry, and loses its mass rapidly. At low temperatures, the part of the symmetry is broken by instantons, invoking distinct vacuum states. Tunneling between these vacuum states is only possible “at a cost”, giving extra mass to the meson. However, as the transition amplitude is dependent on the strong coupling constant , it follows that the effect of instantons rapidly decreases with increasing energy density. This is an effective restoration of the symmetry at finite , first suggested in Ref. Pisarski:1983ms . Thus in high energy heavy ion collisions, where a hot and dense medium is created, the symmetry may temporarily be restored kunihiro ; kapusta ; huang .
In Refs. Vertesi:2009ca ; prl we reported the first observation of a significant reduction of the mass, based on an analysis of PHENIX and STAR data phnxpub ; starpub from =200 GeV central Au+Au collisions at the BNL Relativistic Heavy Ion Collider (RHIC). The subject of the present manuscript is to detail and systematically explore these experimental signatures of a partial symmetry restoration at RHIC.
In thermal models, the production cross sections of the light mesons are exponentially suppressed by the mass. Since the mesons are heavy, by default one expects the number of mesons to be about two orders of magnitude less than the number of pions. However, as a consequence of the mass reduction, this suppression would be moderated, and the mesons would show up in an enhanced number. Once produced, the is expected to be decoupled from other hadronic matter, since its annihilation cross section is very small. At the same time, the low- mesons are trapped in the medium due to energy conservation reasons, forming a condensate. Due to expansion, the medium cools down and freezes out, emitting asymptotic particles that propagate in vacuum. By this time, the mesons regain their original mass, hence the enhancement will mostly appear at low kunihiro ; kapusta ; huang . It is to be noted that the lifetime is much longer than the lifetime of the hot and dense medium, therefore a direct observation of the mass shift seems to be extremely difficult.
A promising channel of observation is the dileptonic decay , because a low- enhancement would give extra lepton pairs to the low invariant mass region. The paper of Kapusta, Kharzeev and McLerran on the return of the prodigal Goldstone boson kapusta was in fact motivated by the dilepton enhancement seen in CERN Super Proton Synchrotron (SPS) laboratory energies in S+Pb reactions. Recent interpretations of CERES ceresll and NA60 data na60ll indicate that the approach to a chiral symmetry restored state could proceed through resonance broadening and eventually subsequent melting, rather than by dropping masses or mass dependency or mass degeneracy between chiral partners Tserruya:2006ht . Recent PHENIX findings also show a definite excess in the dielectron invariant mass region in Au+Au collisions Afanasiev:2007xw . Unlike at lower beam energies, in this case the contribution from a hot hadronic phase without mass shifts seems to be insufficient to account for the enhancement seen in the data Drees:2009xy .
In the present work we search for the mass modification and the related restoration of the chiral symmetry in a different channel, using already published like-sign Bose–Einstein correlation (BEC) measurements as proposed by Ref. vance . We report on a detailed systematic study of the presently available published data sets. Future high precision data points in the low- region will help to reduce the uncertainties of the measurements, and hopefully will provide a more precise estimation of the mass reduction, compared to our current analysis.
II Bose–Einstein Correlations
Correlations between pions carry important information about the space-time structure of the medium created in heavy ion collisions. The widths of and are and , corresponding to large decay times: they produce pions at and , which are huge compared to the characteristic HBT radii of 4–6 fm. Among the decay channels of the , the channel has the largest branching ratio of about 45%. Furthermore, the mesons decay into charged pions: The and processes together have a branching ratio of approximately 27% pdg .
The Bose–Einstein correlation function of pion-pion pairs can be expressed in terms of the relative and the mean four-momenta, and , respectively:
| (1) |
where are the three-momenta of particles 1 and 2, and are the one- and two-particle invariant momentum distribution functions.111The usual notation is used here, where and is the three-momentum.
It has been shown that the source can be handled in the core–halo picture, where the “core” consists of primordially created pions and those ones coming from fast-decaying resonances, while the other pions, coming from more slowly decaying resonances, make the “halo” Csorgo:1994in ; Bolz:1992ye . The core region is resolvable by BEC, while the halo is not.222This has been tested numerically in Nickerson:1997js . In fact, the core–halo separation always depends on the experimental two-track resolution. For example in PHENIX and STAR, two tracks are separable with a momentum difference of larger than 4 to 5 MeV, corresponding to a spatial separability that dies off at about 40–50 fm Adler:2006as ; Sumbera:2007ir . Long tails extending to this region were recently observed by the PHENIX and NA49 collaborations at RHIC and CERN SPS energies Adler:2006as ; Alt:2008fq . Note that these long tails are also seen in kaon imaging, while the bulk production is well described with characteristic scales of 4–6 fm Afanasiev:2009ii .
In the core–halo picture Csorgo:1994in ; Bolz:1992ye the correlation function can be measured with the so called extrapolated intercept parameter as
| (2) |
where is defined by the Fourier transform of the one-pion emission function of the core as
| (3) |
and the intercept parameter is derived from the extrapolation of the correlation value to , as . However, this extrapolation does not include the correlation between halo–halo and core–halo particle pairs, supposed to be unresolvable by our detectors.333For fully thermal particle emitting sources, the exact value of intercept is . Generally, .
The intercept parameter can also be expressed directly with the fraction of the core pions to the total number of pions:
| (4) |
where
| (5) |
and it is per se sensitive to the core vs. halo ratio. (In the above formulae denotes the transverse mass of the s, and the ’s are the distributions of the corresponding decays.) If one does a one-dimensional investigation characterized by the invariant momentum difference , and assuming a Gaussian approximation of the source, one will have Eq. (2) in the form
| . | (6) |
In this case .
As is defined in Eq. (2) as an extrapolation of the experimental data to , it is essential that it does not depend strongly on the method of the extrapolation. The Gaussian assumption for the shape of the source is a model hypothesis that has been shown not to be precise Adler:2006as . Instead, one can choose an experimental procedure independent of theoretical assumptions, and get a description of arbitrary precision with the Edgeworth expansion by completing the Gauss shape with an infinite series in the space of Hermite polynomials csh . In this case,
| (7) |
where is an overall normalization parameter, the is a weight factor to the th Hermite polynomial
| , | (8) |
and and are the Edgeworth radius and intercept parameters. In practice, an expansion up to the sixth order is sufficient starpub . Note that, as the even order Hermite polynomials have non-vanishing values at , is different from here:
| . | (9) |
A straightforward generalization of these approximations to the three (out, side, long) dimension case is given in Eggers:2006uq .
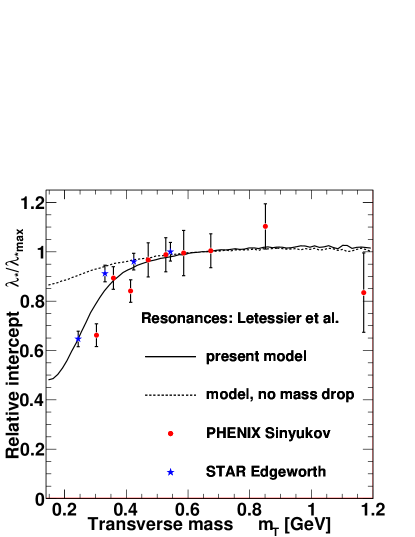
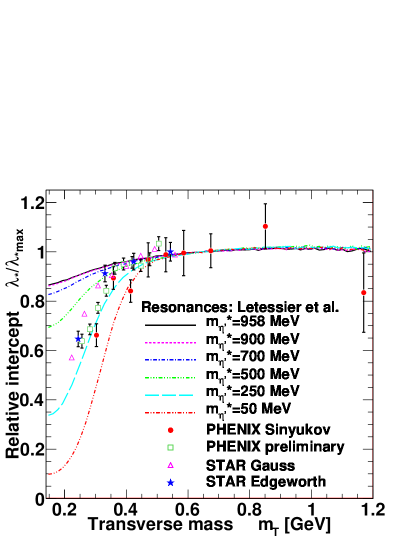
In the following we will show that the phenomenon of a partial restoration and a connected mass reduction of the meson is able to explain the behavior of measured in RHIC experiments. A previous analysis, based on the same idea, was carried out on NA44 data, and showed that a reduction of the mass should result in a dip of the at low- values. However, no significant signal of such a mass modification was seen in S+Pb collisions at CERN SPS (Fig. 1 of vance ).
III Data sets
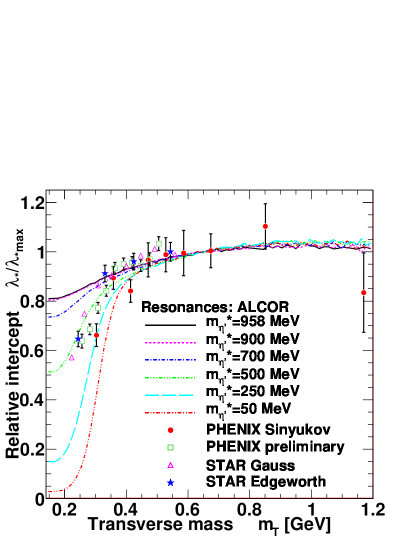
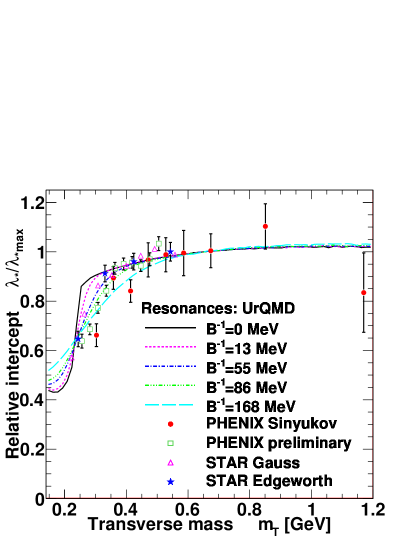
In contrast to the SPS data, a low- dip of the was measured in Au+Au collisions at RHIC by both the STAR and the PHENIX experiments phnxpub ; starpub . The points were extracted from the measured correlation function of like-sign pions, using different methods. A comparison of the measurements to the FRITIOF frirqmd calculation including variation of the mass was presented in Fig. 4. of Ref. Csanad:2005nr . It is important to note that, although the Gaussian fit typically has 1–2% error on the value, this does not reflect the real error on the intercept caused by the extrapolation. For example, exponential fits yield larger values for than the Gaussian fits do, and the difference between and is larger than several (sometimes more than 5) standard deviations Hegyi:1992vc . A reasonable range of errors can be estimated with the help of an Edgeworth fit Csanad:2005nr . In the detailed presentation of Ref. Csanad:2005nr it was suggested to utilize the normalized quantity in order to remove sensitivity to the extrapolation technique, and to reduce other systematic errors. Note that is defined as the value of the extrapolated intercept parameter in an region where its value is saturated; according to simulations as well as the presently used PHENIX and STAR measurements, this corresponds to 0.5 GeV 0.7 GeV region.444Here is the value taken at , with the exception of the STAR data, where the data point at the highest is considered. Note that the dependency of the measurements in the 0.5–0.7 GeV region is very weak. One should also note that the data may depend on the goodness of the particle identification too: other particles misidentified as pions will reduce correlation and will push the measured data down.
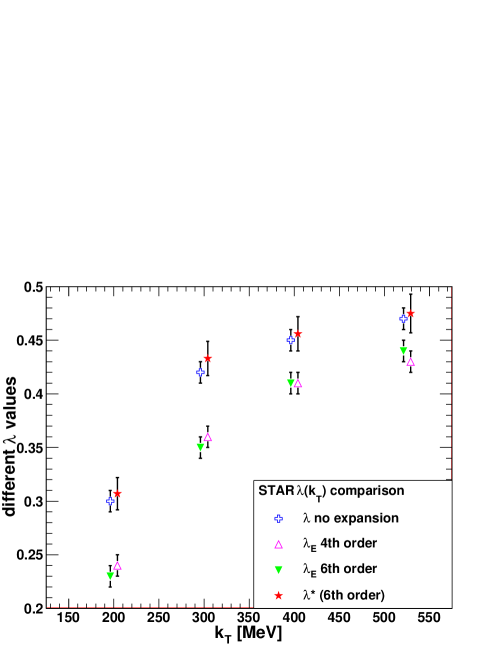
The PHENIX data set was derived using the Bowler-Sinyukov method sinyukov , while the STAR data set was obtained from a sixth order Edgeworth fit. Here we apply the method of Ref. csh using the values and errors of the Gaussian and the Edgeworth fit parameters taken from starpub in order to compute the sixth order values using Eq. (9). We use complete error propagation in order to determine the corresponding uncertanities of . Although the Gaussian and the Edgeworth parameters are significantly different, the extrapolated intercept parameter is similar to within errors (see Table 5 and Fig. 12 in Appendix A). However, the error bars on are significantly larger than the naïve errors on . As emphasized before, the Edgeworth gives a more realistic estimation of both the value and the error of the intercept parameter, hence of the core-halo ratio.
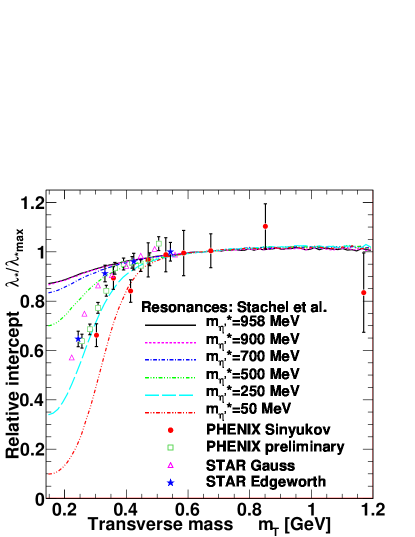
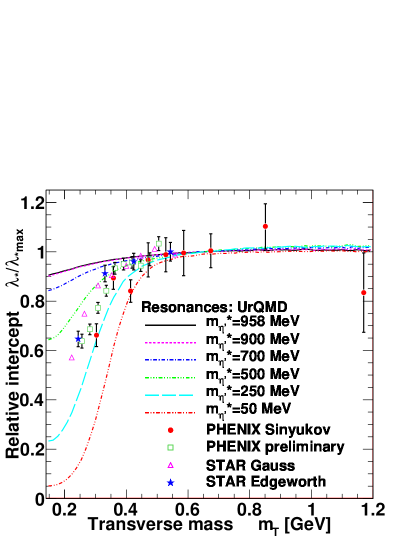
Another data set on from STAR was obtained with a Gaussian fit using the Bowler-Sinyukov method, and it shows a good agreement with the STAR Edgeworth data (Fig. 14 of starpub ). We do not use this data set in our analysis, since the error bars do not include all the relevant systematic effects, being in the order of , which is way smaller than the systematic error coming from the choice of the extrapolation. PHENIX preliminary data Csanad:2005nr are also shown, for comparison purposes only, as their systematic errors are not yet finalized. The data sets for are detailed in Fig. 1 before and after normalizing with . Each of these data sets indicate the dip of in the low- region.
Given that we are interested in obtaining final errors that include all relevant systematic effects, we decided to analyze simultaneously the PHENIX final Sinyukov-corrected data set together with the STAR Edgeworth data set, both normalized to their values. One can note that these two data sets are not in perfect overlap with each other, although they are consistent within their errors, and it is possible to fit both data sets simultaneously with good confidence levels. The Gaussian data set of STAR has errors that apparently do not include systematics from the Gaussian ansatz, thus a quantitative comparison to our model was not reasonable. However, the best fits to the other data sets qualitatively agree with the Gaussian points. We have also checked that separate analysis of the STAR and PHENIX data sets yields results which are consistent with the presented results, as part of the systematic studies. However, the combined PHENIX and STAR data set provided a more precise estimate for the allowed regions of the model parameters.


The difference between the selected PHENIX and STAR data sets possibly reflects the systematic error from different experimental conditions, for example, PHENIX data were measured in the 0-30% centrality class, while STAR Edgeworth results were published for the 0–5% centrality selection, and the particle identification in the two experiments is also different. These differences resulted in a systematic uncertainty of our analysis, too, however, as we shall demonstrate at the end, these systematic errors are still of the order of the statistical uncertainties and the dominant error in estimation of the in-medium modified mass of the mesons comes from the choice of the resonance model and its parameters. The relative systematic error from the difference in centrality selection is estimated in Appendix B to be not larger than 9.8%.
IV Modeling and simulation
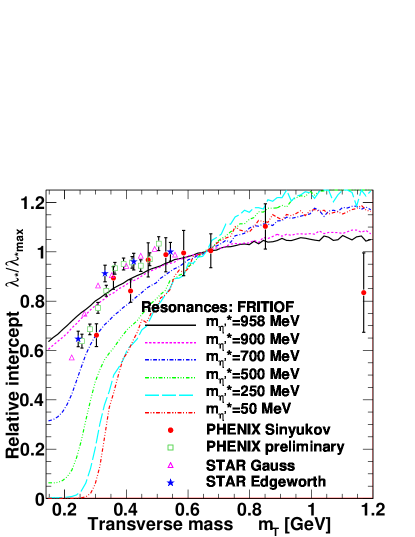
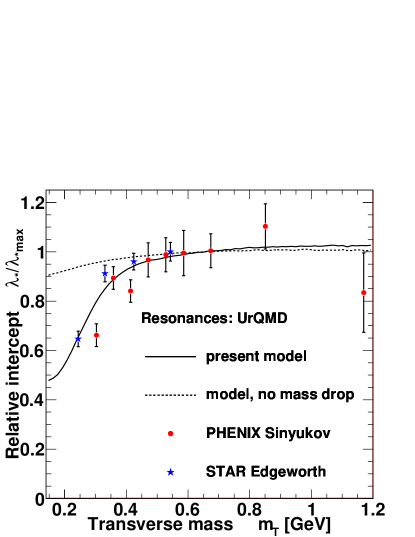
First simulations of the restoration at SPS S+Pb collisions at bombarding energy had predicted a dip of at values below 0.25 vance . It was found that the depth of this dip was governed by the value of as an input parameter for the simulations. In those simulations, the mesons from the condensate had been assumed to have no transverse momenta at all, resulting in a very steep hole-like structure of the low- part of the vance . Such an oversimplification is not adequate for the description of the dip in the RHIC data. To improve on it, we introduce here an effective thermal spectrum for the mesons from the condensate, characterized by an inverse slope parameter . As we demonstrate below, this parameter controls the steepness of the dip of , while controls its depth. Also, instead of relying on a given model of resonance production (as on FRITIOF frirqmd in Ref. vance ), here we utilize six different models, in order to estimate the systematic error related to the choice of the theoretical model for resonance production. In particular, the six models we use here are ALCOR alcor , FRITIOF frirqmd , Kaneta et al. kaneta , Letessier et al. rafelski , Stachel et al. stachel and UrQMD urqmd . (See Appendix C for more details on the individual models.) We have also considered the AMPT 2.11 simulation with string melting Lin:2004en that report on a non-thermal scenario without an mass modification. AMPT results show an interesting, although genuinely different dropping structure of at low values. Comparison of this model to the data, as tersely overviewed in prl , indicate that AMPT cannot describe these data in a statistically acceptable manner, characterized by a corresponding to . We attribute the behavior seen in AMPT to a lower effective of the high mass halo resonances prl ; vance .
In earlier simulations in vance , the resonance production was generated by an exponential spectrum , the effective freeze-out temperature defined as , with and being the freeze-out temperature and the average transverse flow, respectively. This has also been generalized, and a polynomial prefactor had been introduced in order to achieve a more realistic description of the direct production of resonances. We have fixed and to RHIC measurements Adler:2003cb . Thus the distribution will follow the form of
| (10) |
where is a normalization constant, and , where is the number of spatial dimensions of the expansion (hence and falls between and ) Csorgo:1995bi ; Csorgo:1994in . The choice of corresponds to the case of Ref. vance .
In order to compare to RHIC data at mid-rapidity, we compute the effective intercept parameter of the – correlations, , with the definition of Eq. (4). All the contributions of Eq. (5) to the distribution were simulated in the mid-rapidity region, given by the pseudorapidity555In this work, pseudorapidity is denoted by . In other manuscripts is usually denoted by the variable which in the current work is reserved for the pseudoscalar mesons and . cut of of the PHENIX acceptance. In the systematic checks we took into account that the STAR analysis starpub used a different pseudorapidity cut of .
For each model the fractions of the particles were computed by normalizing the multiplicities to the total density
| (11) |
The halo of pion production always had the same ingredients (from the decays of the , , and )666Other long-lived resonances, such as the meson, are checked to give a negligible contribution to the ratio, which translates to less than 2% uncertainty to the ., while the core was composed of all the other resonances that were available in each particular model. The charged pion spectra were obtained from a complete kinematic simulation of the decays above resonances using JETSET v7.4 Sjostrand:1995iq . The estimated systematic error arising from assigning each decay product to the halo is given in Sec. V.
The mechanism of the partial restoration implies that the would have a decreased effective mass in the hot and dense medium vance . The number of the created particles would then follow Eq. (10) with the modified mass and the freeze-out temperature respective to the mesons, and the fraction of mesons in the condensate is modeled with the
| (12) |
formula, where the is the temperature of the condensate.
As the escaping bosons are regaining their mass, they must lose momentum in order to fulfill the principle of energy conservation, i.e.,
| . | (13) |
(In the above equation the quantities with an asterisk denote the properties of the in-medium , while the ones without an asterisk refer to the free . According to the kinematical setup of both PHENIX and STAR measurements phnxpub ; starpub , the longitudinal component of the momentum is considered to be negligible here.) As a consequence, while bosons with will follow the above distribution (with the effective mass plugged in), the ones moving with a momentum less than this limit will be “trapped” in the medium until this medium is dissolved. Afterwards, -s from the condensate are given a random transverse momentum, following Maxwell-Boltzmann statistics with a characteristic temperature :
| (14) |
with . Note that is a systematically varied model parameter, and its best value is determined by the analysis of the data.
V The mass drop—results and systematics
Out of the six parameters of the spectrum and simulation, the two most important ones are and . They directly determine the shape of the observed dip (depth and width, respectively). These parameters were considered as “fit variables,” and a fine grid scan was carried out. The most probable values of the and were looked for by the simulation of the spectrum and then determining the from the fits to the data of the PHENIX and STAR measurements at each individual setup. The other four parameters were treated as “constants,” although their variation played a role when determining systematic errors.
As a default setup, the freeze-out temperature was taken from PHENIX inverse slope parameter fit777Note that the values for and only include the statistical errors. The systematics were taken into account in our systematic studies that involved a wide range of different predictions on , . to be MeV Adler:2003cb , and the conservative assumption of was made.888The temperature of the condensate majorates the freeze-out temperature. As can be seen from our systematic checks, a freeze-out temperature that is lower than the condensate temperature will move downward, i.e., toward “safety” for our conclusion. The average transverse flow velocity was measured by PHENIX to be (in relativistic units) Adler:2003cb . This was cross-checked in our simulations with a scan with steps at the best value of and , and it was found that the most probable values were around , in agreement with the PHENIX measurement. The polynomial exponent corresponds to a 2D expansion Csorgo:1994in ; Csorgo:1995bi , that had been proved to give a good description of data, used by PHENIX when obtaining and . However the (1D) and (3D) cases were also examined as systematic checks.
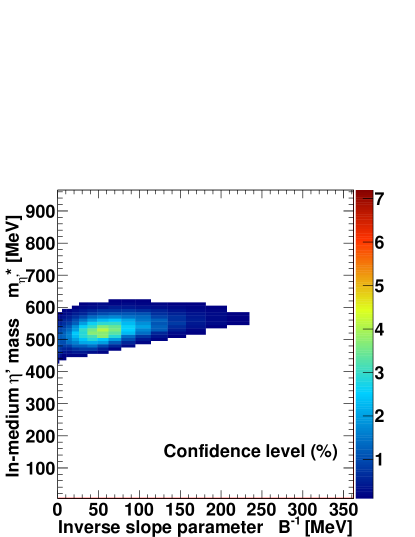
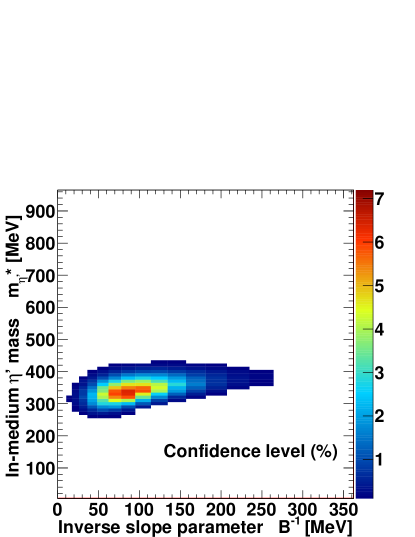
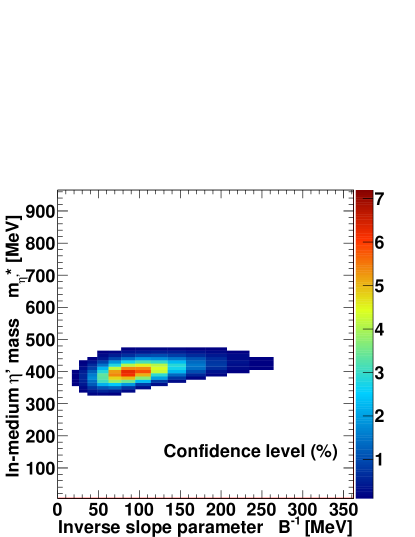
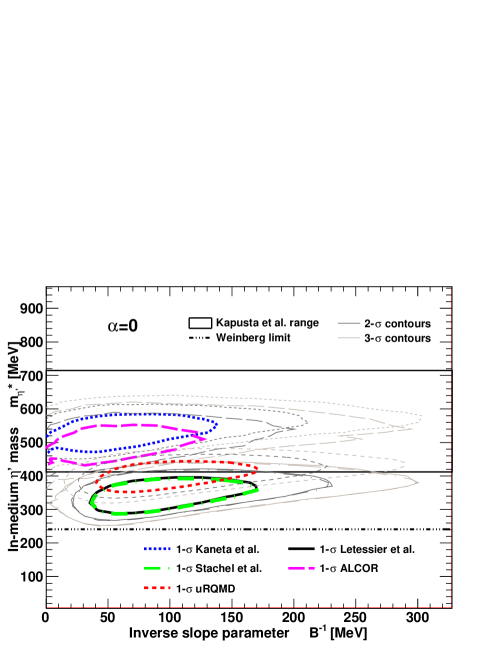
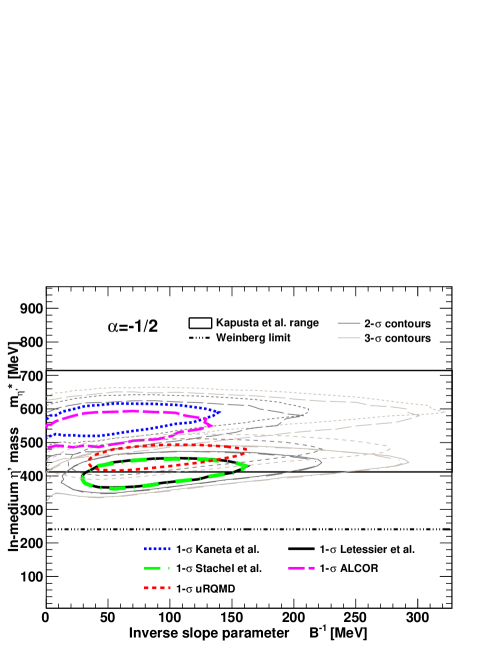
The (, ) plane was mapped on a grid of 21 non-equidistant steps999In fact, was mapped in 21 equidistant steps between 0 and 600 . for , and by 10 MeV equidistant steps101010Thus all the values are given with the resolution of throughout the manuscript. for the region. A good simultaneous description of PHENIX and STAR data was obtained by certain values of and in the case of five out of the six models, as demonstrated in Figures 2–7. For each model, we show the confidence level () map, the best result, the result without the mass modification, and the effect of and scans around the best result. The standard deviation contours on (, ) plain for the best fits of simulations to data are summarized for different models in Figs. 8, and 9 for and respectively.


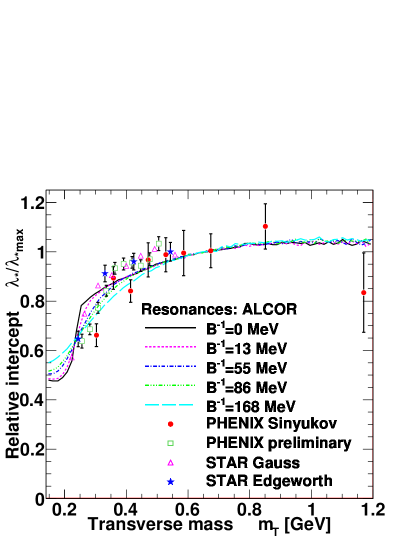


As expected, a strongly reduced mass results in a dip in the low- part of the distribution (and the smaller the mass, the deeper the dip is), while steers the width of this dip through smearing the momentum, while the parameter influences the overall slope of the spectrum at higher . Such a role of was already observed in vance , and it is not detailed here.
The systematic uncertainties resulting from the lack of precise knowledge of model constants were mapped by varying these constants within the range that is given by different measurements: Spectra with values of and were investigated as well as MeV, MeV and MeV, representing the boundaries of the theoretically or experimentally acceptable region of these parameters.
Besides the choice of the model parameters, there are systematic uncertainties resulting from uncertainties on ():
-
•
The STAR Edgeworth values were extracted from data of 0–5% centrality, compared to the 0–30% rapidity range of the PHENIX Sinyukov data set. We estimate that this relative error does not exceed 9.8%. See details in Appendix B.
-
•
Although the may give part of its contribution to the tail at the resolution available in STAR and PHENIX, we considered it as part of the halo. This introduces a relative systematic error of 7% on the measured Nickerson:1997js .
-
•
Moving the pseudorapidity cutoff from to adds another error, that is measured to be 3%.
These errors are considered independent and are added up quadratically. The relative error on corresponds to the same amount of relative error on in the worst-case scenario.111111This relation was obtained from the STAR Edgeworth data set with the Kaneta et al. kaneta multiplicities: when the lowest datapoint was moved by 10% first up and then down, the fitted value changed by the same relative error.
The best fit values and their error determinations are summarized in Table 1, while Table 2 shows the limits of acceptability, defined on the region, where . The combined PHENIX and STAR data cannot be described unless a significant mass modification is assumed, . Although this value includes the systematics from the model uncertainties, it is also subject to the uncertainties coming from the other sources listed above.121212We have determined these errors at the best mass fits, and applied the same absolute value in case of the mass limits. This is a conservative method since the higher the mass value is, to the lesser extent it is influenced by the same effect. On the basis of model simulations, studies and systematic checks, we find that a description of the combined PHENIX and STAR data set is possible with only if an in-medium mass modification of is utilized. In other words, MeV at the 99.9% confidence level, corresponding to a more than 5- effect, in the considered broad model class.
| Data set | Acceptability boundaries of model fits | Parameters | ||||||
|---|---|---|---|---|---|---|---|---|
| ALCOR | Kaneta | Letessier | Stachel | UrQMD | ||||
| alcor | et al. kaneta | et al. rafelski | et al. stachel | urqmd | ||||
| (MeV) | 0 | 177 | 177 | |||||
| (MeV) | 42 | 55 | 86 | 86 | 86 | |||
| CL (%) | 4.29 | 4.12 | 6.35 | 6.38 | 6.28 | |||
| 1.83 | 2.07 | 1.72 | 1.71 | 1.72 | ||||
| (MeV) | 177 | 177 | ||||||
| (MeV) | 55 | 55 | 86 | 86 | 86 | |||
| CL (%) | 2.80 | 3.35 | 6.07 | 5.97 | 6.14 | |||
| 1.96 | 2.07 | 1.73 | 1.73 | 1.73 | ||||
| (MeV) | 470 | 210 | 0.5 | 177 | 177 | |||
| (MeV) | 55 | 86 | ||||||
| CL (%) | 4.58 | 6.54 | ||||||
| 1.82 | 1.71 | |||||||
| (MeV) | 620 | 460 | 0 | 140 | 177 | |||
| (MeV) | 42 | 69 | ||||||
| CL (%) | 2.26 | 5.86 | ||||||
| 2.02 | 1.74 | |||||||
| (MeV) | 440 | 200 | 0 | 220 | 177 | |||
| (MeV) | 69 | 104 | ||||||
| CL (%) | 5.61 | 6.33 | ||||||
| 1.75 | 1.72 | |||||||
| (MeV) | 410 | 240 | 0 | 177 | 100 | |||
| (MeV) | 145 | 145 | ||||||
| CL (%) | 1.63 | 1.80 | ||||||
| 2.11 | 2.09 | |||||||
| Data set | Acceptability boundaries of model fits | Parameters | |||||||
| ALCOR | FRITIOF | Kaneta | Letessier | Stachel | UrQMD | ||||
| alcor | frirqmd | et al. kaneta | et al. rafelski | et al. stachel | urqmd | ||||
| PHENIX | 0–750 | 680–958 | 0–720 | 0–510 | 0–500 | 0–530 | 0 | 177 | 177 |
| STAR | 380–600 | none | 430–630 | 190–450 | 190–450 | 260–500 | |||
| combined | 380–590 | none | 420–620 | 260–430 | 260–430 | 330–470 | |||
| PHENIX | 30–770 | 420–958 | 50–730 | 0–540 | 0–540 | 0–560 | 177 | 177 | |
| STAR | 470–630 | none | 500–650 | 300–500 | 300–500 | 360–540 | |||
| combined | 450–620 | 670–760 | 490–640 | 340–480 | 340–480 | 400–510 | |||
| PHENIX | 0–690 | 0–450 | 0.5 | 177 | 177 | ||||
| STAR | 320–610 | 0–390 | |||||||
| combined | 340–590 | 0–390 | |||||||
| PHENIX | 0–760 | 0–450 | 0 | 140 | 177 | ||||
| STAR | 560–690 | 0–390 | |||||||
| combined | 540–680 | 0–360 | |||||||
| PHENIX | 0–680 | 0–410 | 0 | 220 | 177 | ||||
| STAR | 270–580 | 0–350 | |||||||
| combined | 290–560 | 100–320 | |||||||
| PHENIX | 220–470 | 30–310 | 0 | 177 | 100 | ||||
| STAR | 360–470 | 190–300 | |||||||
| combined | 370–440 | 200–280 | |||||||
Note that the validity of our analysis relies on the correctness of published STAR and PHENIX data. These data, however, were not measured with the definite purpose to serve as a base for the search for the in-medium mass modification, where particular attention has to be payed to the momentum dependence of the particle identification purity and efficiency, especially at low- regime. More detailed dedicated measurements together with additional analysis of the dilepton and photon decay channels of could help consolidate the findings reported here.
VI The enhanced and spectrum
The dilepton spectrum has been measured recently in minimum bias Au+Au collisions at = 200 GeV, and a large enhancement was observed in the low-invariant mass region Adare:2009qk . Low transverse mass enhancement of the and production results in dilepton enhancement just in the considered kinematic range kapusta . PHENIX recently reported a two-component transverse momentum spectrum in dilepton channel direct photon measurements Adare:2009qk . The and spectra reconstructed here may serve as an input, e.g., for the simulations and evaluations of the dilepton spectra instead of the currently utilized spectra, based on scaling and hence not providing the possibility of taking into account an mass reduction.
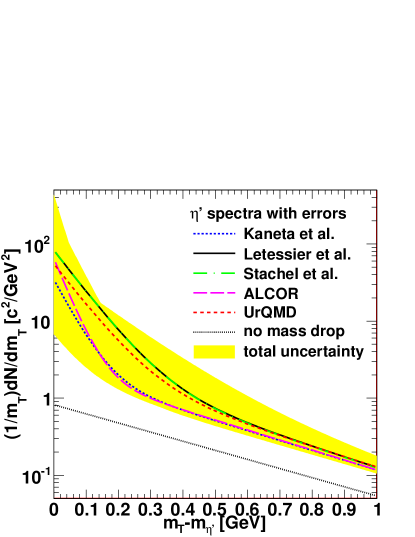
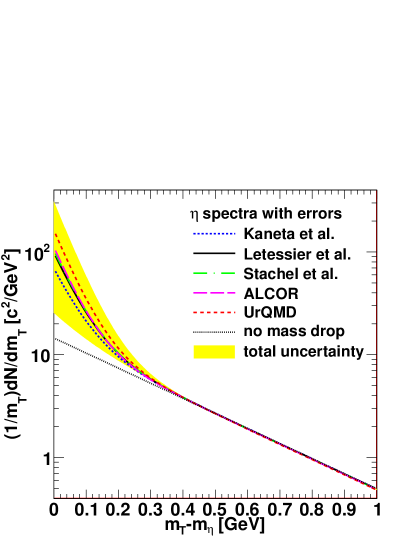
In order to make a cross-check possible with measurements that are based on the non-pionic decay channels of the , we extract the transverse momentum spectra of the and mesons from the Bose–Einstein correlation measurements at mid-rapidity in the reduced scenario, for each of the successful resonance models.
We compute the spectra two times for each model. First we use the original value. The obtained spectra clearly show the scaling. Then we use the reduced mass, and the corresponding value that provides the best description of the data in the frame of a given resonance model. These spectra break the scaling with an additional, steeper exponential-like part over the original spectrum, and produce most of the enhancement in the low- region. The original “non-enhanced” spectra is normalized to the multiplicity131313 The normalization of the original spectra is performed the following way: First the numerical integral of the unmodified distribution is computed. Then the average number of mesons per event is divided by this integral, and the histogram is scaled by the resulting number. predicted by Kaneta et al. kaneta , and then the enhanced spectra is scaled relative to it. Left panel of Fig. 10 shows both the original, -scaling spectra, and the enhanced version with for the resonance ratios of Ref. kaneta . A comparison of enhanced spectra of all resonance models is given on the right panel of Fig. 10, and the fitted spectrum parameters are listed in Table 3 together with the enhancement factors for each particular model of resonance ratios.

| Resonance model | |||||
|---|---|---|---|---|---|
| No enhancement | 0.82 | 2.72 | 0 (fixed) | 0 (fixed) | - |
| ALCOR alcor | 2.30 | 2.98 | 62.4 | 23.5 | 43.4 |
| Kaneta et al. kaneta | 2.21 | 2.94 | 32.4 | 18.7 | 25.6 |
| Letessier et al. rafelski | 2.91 | 3.14 | 80.1 | 12.8 | 67.6 |
| Stachel et al. stachel | 2.85 | 3.13 | 80.0 | 12.8 | 67.6 |
| UrQMD urqmd | 2.75 | 3.07 | 52.5 | 12.7 | 45.0 |
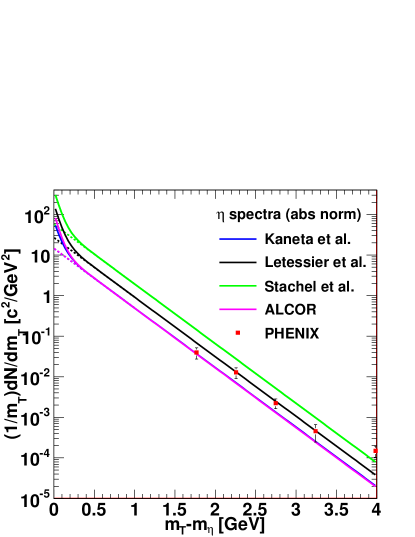
Since the spectrum of the mesons can be directly compared to measured data, it also serves as a consistency check. A comparison of enhanced spectra of all resonance models is given on Fig. 11 (left), and the fitted spectrum parameters are listed in Table 4. A connection between the enhancement and the enhancement can be expressed as
| (15) |
with the last term, the total to branching ratio being approximately 65.7%. For models alcor ; kaneta ; rafelski ; stachel we have also plotted the absolutely normalized spectra in Fig. 11 (right) compared to the measured PHENIX spectra. It is obvious from the plot that the computed enhancement affects only the part of the spectrum.
| Resonance model | |||||
|---|---|---|---|---|---|
| No enhancement | 14.6 | 3.38 | 0 (fixed) | 0 (fixed) | - |
| ALCOR alcor | 14.6 | 3.40 | 97.0 | 17.8 | 5.25 |
| Kaneta et al. kaneta | 14.6 | 3.38 | 54.9 | 16.2 | 3.47 |
| Letessier et al. rafelski | 14.6 | 3.38 | 84.1 | 16.9 | 4.75 |
| Stachel et al. stachel | 14.5 | 3.38 | 89.2 | 17.0 | 4.97 |
| UrQMD urqmd | 14.6 | 3.41 | 148 | 17.9 | 7.49 |
Considering all errors, and .141414The upper bounds on and were calculated the following way: The (, ) values of all above mentioned setups of input model, , , were considered along the 1- contour, and then the value was shifted upward with the corresponding non-model-dependent systematic error. Then the (or ) spectra were plotted for these (, ) pairs, and the one corresponding to the maximum enhancement was considered. The lower bound was computed similarly, with the values shifted downward and the spectra with the minimal enhancement taken. The maximal enhancement is given by Ref. rafelski , while the minimal is by Ref. kaneta . (Ref. frirqmd is not considered as FRITIOF fails to describe the STAR and the combined PHENIX and STAR data sets.) Estimations using these enhancement factors indicate that the observed in-medium mass drop is indeed a promising candidate prl to explain the dilepton excess reported by PHENIX in Ref. Afanasiev:2007xw .
VII Conclusion
The best simultaneous description of STAR and PHENIX HBT data is achieved with an mass that is dramatically reduced from 958 MeV to MeV in the medium created in central Au+Au collisions at RHIC. The first error here is the statistical one from the fit, the second error is from the model and parameter choices, while the third is the systematics from the centrality selection, the resolvability of decay products and the pseudo-rapidity cutoff. Note that the dominant error corresponds to the selection of the model for the hadronic multiplicities.
Note that the best estimated value for the modified mass does not differ significantly from the range of , predicted by the quark model calculations for the symmetry restoration kapusta . In fact, it is slightly below this range, but above the lower limit of by Weinberg Weinberg:1975ui . Hence the mass reduction effect seems to be already at maximum at central Au+Au collisions. As a consequence, one may expect a saturation of this effect if the bombarding energy is further increased up to LHC energies of . In Appendix B we also noted an interesting centrality dependence of the order of 9.8%, that suggests that the in-medium mass decrease is slightly larger in more central collisions and suggests that more detailed centrality and transverse mass dependent measurements of the Edgeworth and other model-independent estimates of the extrapolated intercept parameter are necessary to pin down this effect, which at present is part of the above given 42 MeV systematic error.
Not only did we investigate the best value for the in-medium mass of , but also the minimum mass modification that is required to describe the data. Based on the combined STAR and PHENIX data, and from the systematic investigation of various resonance multiplicities and model parameters, we conclude that in central Au+Au reactions the mass of the meson is reduced by more than 200 MeV, at the 99.9 % confidence level in the considered model class. This result was briefly summarized and published in Ref. prl . A similar analysis of NA44 S+Pb data at top CERN SPS energies provided no evidence of an in-medium mass modification vance . For further details on the extrapolation techniques and on a summary of earlier results on a correlation search for partial symmetry restoration we recommend the review paper Csorgo:1999sj . Theoretical results and earlier experimental searches for in-medium mass modifications of hadrons were summarized recently in Ref. Hayano:2008vn .
Our positive results on a significant, indirectly observed in-medium mass modification should revitalize theoretical interest in other signatures of partial and chiral symmetry restoration in heavy ion reactions and also should be cross-checked against other observables like the enhancement of low-mass dileptons and photons in the same reactions. More detailed and more precise experimental data are needed on the intercept parameter of Bose–Einstein correlations of pions at low at various bombarding energies, system sizes and centralities to fully understand the nature of partial symmetry restoration. Detailed analyses of other decay channels of the and mesons, e.g. dilepton measurements are required to confirm our observations on the onset of this effect.
Acknowledgements.
T. Cs. is grateful to Professor R. J. Glauber for his kind hospitality at Harvard University and acknowledges financial support from HAESF. We thank professor R. J. Glauber, M. I. Nagy, S. Vainstein and Gy. Wolf for useful discussions. Our research was supported by OTKA grant nos. T49466 and NK 73143.Appendix A STAR Edgeworth
STAR used a sixth order Edgeworth expansion with the even order terms only, assuming that the source is a symmetric and analytic function. The STAR measurements for the and values are given in Table 5. Plotted values of the Gauss and the fourth and sixth order , compared to our calculations, are shown in Fig. 12. In this Appendix we outline the computation of , using the notation of STAR starpub . Although the Hermite polynomials were defined differently from Eq. (8) of Ref. starpub , the difference cancels from the equations quoted below. The , , indices denote the out, side and long directions as defined at the same place. Then the is computed as
| (16) |
and its error is given as
| (17) | |||||
The result of the numerical computations are summarized in Table 5.
| (MeV/c) | ||||||||||||
|---|---|---|---|---|---|---|---|---|---|---|---|---|
Appendix B System size, energy and centrality dependence
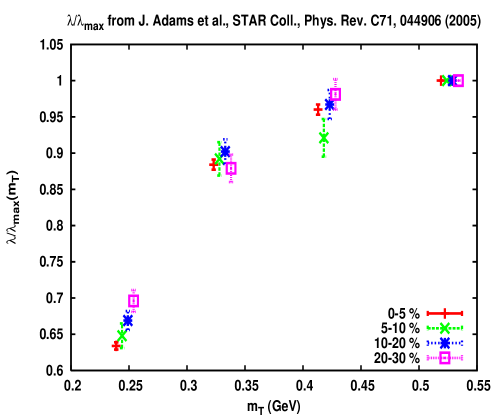
The STAR Edgeworth () data are given for the 0–5% most central data, while PHENIX carried out the pion correlation analysis on the 0–30% centrality range. The behavior of the () curve is not necessarily the same for different centrality classes, resulting in a systematic error in our analysis. Fortunately, STAR provided a centrality dependent Gaussian measurement, that we could use to estimate this error. The values for the centrality classes between 0% and 30% are summarized in Fig. 13. The relative error is determined to be less than 9.8 % given by the the difference of the first datapoints of the 0–5% with respect to the 20–30% centrality classes. This is a conservative estimation of the difference between 0–5% and 0–30% centrality data.
According to this centrality and transverse mass dependent Gaussian STAR data on the intercept parameter, the depth of the low- dip deepens in the case of more central collisions. This suggests that the restoration of the symmetry is more complete in case of more central collisions. Therefore it may be useful to measure also the more relevant Edgeworth () data in different centrality classes too.
System size and energy dependence is shown in Fig. 14, where the values are compared for NA44 S+Pb collisions, and STAR Au+Au and Cu+Cu collisions. The plot indicates that the mass modification effect seems to be maximal in 200 GeV Au+Au collisions, followed by 62 GeV Au+Au collisions, 200 GeV Cu+Cu and 62 GeV Cu+Cu in that order. Although in each of the STAR cases a positive signal is apparent, we also observe the lack of saturation of at higher momenta, which we attribute to the changing (decreasing) amount of the radial flow with decreasing energy and system size. Such a dependence on the amount of the radial flow has been first pointed out in Ref. vance .

Appendix C Models
| Particles | Fractions from model | ||||||
|---|---|---|---|---|---|---|---|
| ALCOR | FRITIOF | Kaneta | Letessier | Stachel | UrQMD | ||
| alcor | frirqmd | et al. kaneta | et al. rafelski | et al. stachel | urqmd | ||
| primordial | 0.4910 | 0.2095 | 0.7396 | 0.3059 | 0.3333 | 0.2395 | |
| short lived | 0.1100 | 0.3058 | 0.0651 | 0.0259 | 0.0370 | 0.0045 | |
| 0.0846 | 0.0088 | 0.0080 | 0.0069 | ||||
| 0.1351 | 0.0124 | 0.0143 | 0.0014 | ||||
| 0.0153 | 0.0040 | 0.0017 | 0.0066 | ||||
| 0.0098 | 0.0054 | 0.0016 | |||||
| long lived | 0.1104 | 0.1023 | 0.0209 | 0.0233 | 0.0296 | 0.0073 | |
| 0.0453 | 0.0516 | 0.0602 | 0.0383 | 0.0360 | 0.0233 | ||
| 0.0067 | 0.0577 | 0.0089 | 0.0032 | 0.0031 | 0.0050 | ||
| 0.0717 | 0.0283 | 0.0746 | 0.0601 | 0.0513 | 0.0287 | ||
In this section we provide a brief description—both general and analysis specific—of the six different models used to simulate the number of each important resonance that decays into pions, as well as the number of primordial pions. The fractions of pions from different sources are compared to the total number of particles in Table 6. These values are fed into our simulations as an input. Note that not all core resonances are listed. With the assumption of a fixed , the is solely determined by the number of the halo resonances (, , , ), and by the total number of pions. The primordial pions can replace those pions that come from fast decays without any effect on . Generally, if a model contains a large number of exotic short lived resonances, it predicts less primordial pions.
ALCOR alcor : Hadron multiplicities—especially for strange particles—are calculated in the framework of this algebraic coalescence rehadronization model, which counts for redistribution of quarks into hadrons for relativistic heavy-ion collisions. Resonance ratios were taken from recent calculations for the RHIC collisions Levai:2008me . Since the mass eigenstates of the strange-antistrange mesons are not directly pinned down, the Kaneta-Xu kaneta predictions were used to fix the ratio for the ALCOR model.
FRITIOF frirqmd is a Monte Carlo program that implements the Lund string model for hadron-hadron, hadron-nucleus and nucleus-nucleus collisions. Resonance ratios were computed with the FRITIOF model by simulating of 1000 events using RHIC central Au+Au GeV parameters. FRITIOF was excluded from examination when drawing the conclusions of this analysis, since it was unable to describe the STAR data set, nor the combined STAR + PHENIX data set, to a at any setup of the model parameters.
Kaneta-Xu kaneta : In the case of this model, Eq. (1). of kaneta was used the following way:
| (18) |
where is the mass, is the spin of the particle. denotes the second order modified Bessel function. For the sake of simplicity the temperature of the chemical equilibrium , the strangeness saturation factor , the quark potentials and were considered, all in consistency with the published PHENIX and STAR measurements in Au+Au collisions Adcox:2004mh . (The relative minuteness of guarantees that the charge factor is negligible for even those rare particles, where it is not exactly 0).
Letessier-Rafelski rafelski : The model of these two authors studied soft hadron production in relativistic heavy ion collisions in a wide range of reaction energy, , and made predictions about yields of particles using the statistical hadronization model. Particle yields of the central events were taken from Table 4 of rafelski .
Stachel et al. stachel : This statistical “fireball” model treats the system as a grand canonical ensemble with the temperature and the baryon chemical potential as free parameters. Particle yields of the central events were taken from Sec. 2.2. Table 1 of stachel .
UrQMD urqmd : The ultra-relativistic quantum molecular dynamics model is a microscopic model used to simulate (ultra)relativistic heavy ion collisons in the energy range from Bevalac and Heavy Ion Synchrotron (SIS) up to Alternating Gradient Synchrotron (AGS), SPS and RHIC. Resonance ratios were computed with the UrQMD model by simulating 1000 events using RHIC central Au+Au GeV parameters.
References
- (1) M. Kobayashi and T. Maskawa, Prog. Theor. Phys. 44, 1422 (1970).
- (2) G. ’t Hooft, Phys. Rev. D 14, 3432 (1976) [Erratum-ibid. D 18, 2199 (1978)]; Phys. Rept. 142, 357 (1986).
- (3) T. Kunihiro, Prog. Theor. Phys. 122, 255 (2009).
- (4) R. D. Pisarski and F. Wilczek, Phys. Rev. D 29, 338 (1984).
- (5) T. Kunihiro, Phys. Lett. B 219 363 (1989); ibid. 245 687(E) (1990).
- (6) J. Kapusta, D. Kharzeev and L. McLerran, Phys. Rev. D 53 5028 (1996).
- (7) Z. Huang and X.-N. Wang, Phys. Rev. D53 5034 (1996).
- (8) R. Vértesi, T. Csörgő and J. Sziklai, Nucl. Phys. A 830, 631C (2009).
- (9) T. Csörgő, R. Vértesi and J. Sziklai, Phys. Rev. Lett. 105, 182301 (2010).
- (10) S. Adler et al. [PHENIX Collaboration], Phys. Rev. Lett. 93 152302 (2004).
- (11) J. Adams et al. [STAR Collaboration], Phys. Rev. C 71 044906 (2005).
- (12) A. Marin et al. [CERES Collaboration], PoS CPOD07, 034 (2007).
- (13) E. Scomparin [NA60 Collaboration], PoS CPOD07, 033 (2007).
- (14) I. Tserruya, Nucl. Phys. A 774, 415 (2006).
- (15) S. Afanasiev et al. [PHENIX Collaboration], arXiv:0706.3034 [nucl-ex].
- (16) A. Drees, arXiv:0909.4976 [nucl-ex].
- (17) S. E. Vance, T. Csörgő and D. Kharzeev, Phys. Rev. Lett. 81 2205 (1998).
- (18) C. Amsler et al. (Particle Data Group), Phys. Lett. B 667, 1 (2008) and 2009 partial update for the 2010 edition.
- (19) T. Csörgő, B. Lörstad and J. Zimányi, Z. Phys. C 71, 491 (1996).
- (20) J. Bolz, U. Ornik, M. Plumer, B. R. Schlei and R. M. Weiner, Phys. Lett. B 300, 404 (1993).
- (21) S. Nickerson, T. Csörgő and D. Kiang, Phys. Rev. C 57, 3251 (1998).
- (22) S. S. Adler et al. [PHENIX Collaboration], Phys. Rev. Lett. 98, 132301 (2007).
- (23) M. Sumbera [STAR Collaboration], Braz. J. Phys. 37 925 (2007).
- (24) C. Alt et al. [NA49 Collaboration], arXiv:0809.1445 [nucl-ex].
- (25) S. Afanasiev et al. [PHENIX Collaboration], Phys. Rev. Lett. 103, 142301 (2009).
- (26) T. Csörgő and S. Hegyi, Phys. Lett. B489, 15 (2000).
- (27) H. C. Eggers and P. Lipa, Braz. J. Phys. 37, 877 (2007).
- (28) B. Nilsson-Almqvist and E. Stenlund, Comput. Phys. Commun. 43, 387 (1987).
-
(29)
M. Csanád [PHENIX Collaboration],
Nucl. Phys. A 774, 611 (2006).
For details, see also the corresponding talk:
http://www.kfki.hu/events/hun/qm2005/parallel/Csanad/1500_csanad_qm05.ppt. - (30) S. Hegyi, T. Csörgő, Budapest Central Research Institute for Physics—KFKI-1993-11/A, 47p.
- (31) Y.M. Sinyukov, R. Lednicky, S.V. Akkelin, J. Pluta, B. Erazmus, Phys. Lett. B 432, 248 (1998).
- (32) T. S. Bíró, P. Lévai and J. Zimányi, Phys. Lett. B 347, 6 (1995).
- (33) M. Kaneta and N. Xu, arXiv:nucl-th/0405068.
- (34) J. Letessier and J. Rafelski, Eur. Phys. J. A 35, 221 (2008).
- (35) S. A. Bass et al., Nucl. Phys. A 661, 205 (1999).
- (36) M. Bleicher et al., J. Phys. G 25, 1859 (1999).
- (37) Z. W. Lin, C. M. Ko, B. A. Li, B. Zhang and S. Pal, Phys. Rev. C 72, 064901 (2005).
- (38) S. S. Adler et al. [PHENIX Collaboration], Phys. Rev. C 69, 034909 (2004).
- (39) T. Csörgő and B. Lörstad, Phys. Rev. C 54, 1390 (1996).
- (40) T. Sjöstrand, Comput. Phys. Commun. 82, 74 (1994), arXiv:hep-ph/9508391.
- (41) A. Adare et al.,Phys. Rev. C 81, 034911 (2010).
- (42) S. Weinberg, Phys. Rev. D 11, 3583 (1975).
- (43) S. S. Adler et al. [PHENIX Collaboration], Phys. Rev. C 75, 024909 (2007).
- (44) T. Csörgő, Heavy Ion Phys. 15, 1 (2002).
- (45) R. S. Hayano and T. Hatsuda, Rev. Mod. Phys. 82, 2949 (2010).
- (46) P. Lévai, J. Phys. G 35, 044041 (2008).
- (47) K. Adcox et al. [PHENIX Collaboration], Nucl. Phys. A 757, 184 (2005).
- (48) B. I. Abelev et al. [STAR Collaboration], Phys. Rev. C 80, 024905 (2009).
- (49) H. Beker et al. [NA44 Collaboration], Phys. Rev. Lett. 74, 3340 (1995).