22institutetext: Astronomy Department, Padova University, Vicolo dell’Osservatorio 2, 35122 Padova, Italy
22email: antonella.vallenari@oapd.inaf.it; emanuela.chiosi@oapd.inaf.it; rosanna.sordo@oapd.inaf.it
Pre-main sequence stars in the stellar association N11 in the Large Magellanic Cloud
Abstract
Context. Magellanic Clouds are of extreme importance to the study of the star formation process in low metallicity environments.
Aims. In this paper we report on the discovery of pre-main sequence candidates and young embedded stellar objects in N11 located in the Large Magellanic Cloud to cast light on the star formation scenario. We would like to remind that this comparison is complicated by the presence of a large age dispersion detected in the fields.
Methods. Deep archive HST/ACS photometry is used to derive color-magnitude diagrams of the associations in N 11 and of the foreground field population. These data are complemented by archive IR Spitzer data which allow the detection of young embedded stellar objects. The spatial distribution of the pre-main sequence candidates and young embedded stellar objects is compared with literature data observed at different wavelengths, such as Hα and CO maps, and with the distribution of OB and Herbig Ae/Be stars. The degree of clustering is derived using the Minimal Spanning Tree method and the two point correlation function to get insights about the formation process.
Results. A large population of pre-main sequence candidates is found in N 11. Their masses are in the range of 1.32 M⊙ for ages from 2 to 10 Myr. Young embedded stellar objects having ages of 0.11 Myr are found to be intermixed with the candidate pre-main sequence stars. The spatial distribution of the stars shows that this region is the product of clustered star formation. No significant difference is found in the clustering degree of young blue main sequence stars and faint pre-main sequence candidates, suggesting that they might be part of the same formation process.
Conclusions. The data suggest that the star formation in the region is a long-lasting process where stars from 0.1 to 10 Myr are widely distributed.
Key Words.:
Galaxies: Magellanic Clouds, stars: star formation, stars: pre-main sequence1 Introduction
Several plausible scenarios are presented in the literature to explain how isolated stars form (e.g Bonnell et al., 2004; McKee & Tan, 2003). A detailed understanding of how a molecular cloud is converted into stars is still missing (see among others Elmegreen, 2000; Dib et al., 2007; Krumholz et al., 2007). Interstellar turbulence is found to be very efficient in sweeping up molecular gas-forming massive structures which in turn can undergo a large-scale gravitational collapse. Supersonic turbulence can counterbalance gravity on a global scale, but provokes collapse locally (Sasao, 1973; Klessen, 2003; Larson, 2003). As a consequence, clusters are formed in a hierarchical fashion with subclusters which eventually merge to build up the final condensed object (Schmeja et al., 2009). Stellar feedback is expected to strongly influence the process. Young massive stars inject energy into the nearby interstellar medium, heating and compressing the surrounding gas. This process can have destructive or constructive effects, depending on the balance between heating and gravity, but it is still not clear what regulates it. The presence or absence of turbulent feedback directly relates to the physical mechanism of star formation and determines whether stars are generated by the formation and collapse of discrete protostellar cores (Krumholz et al., 2005; Padoan & Nordlund, 2002) or by competitive accretion (Bonnell et al., 2004).
To analyze entire star-forming regions including different components (molecular clouds, ionized gas, stars.. ) can cast light on the formation scenario. Clustering properties of the young population can give information about the structure of the interstellar medium from which it formed. The Magellanic Clouds are ideal laboratories to study the process of star formation in detail, due to their proximity. In the Large Magellanic Cloud (LMC) several regions of active star formation are found. N11 is the second largest nebula of the LMC after the 30 Doradus Nebula. It is located at the North-Western corner of the LMC.
This region is often presented as one of the best examples of triggered star formation (Walborn & Parker, 1992; Rosado et al., 1996; Hatano et al., 2006; Mokiem et al., 2007). The basic idea is that the association LH 9 has triggered star formation in LH 10 and LH 13 (see discussion in the following).
Here we discuss the stellar content in the region of N 11 using HST ACS/WFC archive data.
These observations are complemented by Spitzer archive data: while HST observations can give information about faint, exposed pre-main sequence candidates (PMSs), IR data allow to detect embedded young stellar objects(YSOs).
Regions of active star formation can be detected, pointing out the differences between the areas where the nebulae are located and the surrounding fields.
This paper is part of a project aimed to cast light on the process of field and cluster star formation in the Magellanic Clouds. We quote among others Chiosi et al. (2006a) where the cluster and field star formation in the central part of the Small Magellanic Cloud (SMC) is studied and the correlation between young objects and their interstellar environment is discussed. In Chiosi & Vallenari (2007) the star formation rate in the SMC is found to be quiescent at ages older than 6 Gyr.
This paper is organized as follows: in Sect. 2 the cluster and association content of the area is presented; in Sect. 3 the HST ACS/WFC and Spitzer archive data are presented; in Sect 4 the methods used to analyze the region are discussed; in Sect 5 the field population is studied and the star formation history is derived. In Sect 6 an estimate of the interstellar extinction is given; in Sect 7 the CMDs of the most relevant associations and clusters are presented and their stellar contents and ages are discussed; in Sect 8 the degree of clustering of the stellar populations at different ages is derived. Concluding remarks are drawn in Sect 9.
2 Presenting the region: clusters and associations in N11
This section summarizes literature information about the cluster and associations in N11.
The complex has a diameter of 45′, corresponding to a linear
extent of 655 pc, if the distance modulus (Keller & Wood, 2006).
This region has a peculiar morphology: a central hole with no emission is
surrounded by several bright nebulae and filaments.
These structures are observed at the H and [OIII] 5007 Å wavelengths and in the radio (Rosado et al., 1996; Israel et al., 2003).
The different emission areas are classified according to the emission brightness starting from N11 A
to B,C,D,E,F and I. The central cavity has been evacuated by the OB stars in the association LH 9, located near the center of N11. The OB association LH 10 in N11B is to the north of LH 9, while LH 13 in N11C is to the east of LH 9. LH 14 in N11E is situated to the northeast of LH 10 and is outside the studied region.
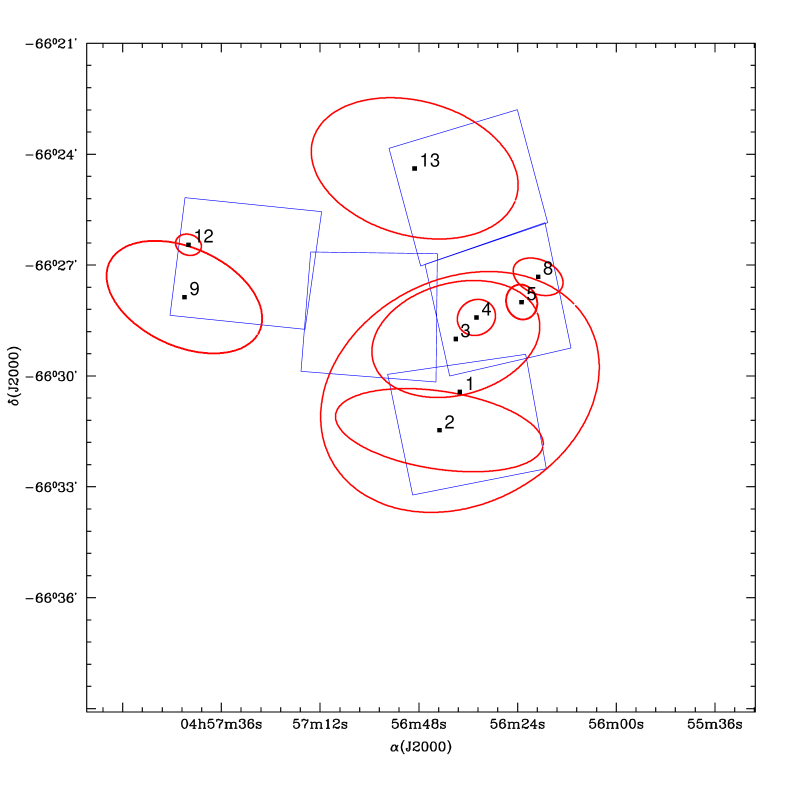
The Bica et al. (1999) Catalog lists 49 clusters and associations in the whole region of N11. This catalog collects and cross-identifies stellar and non-stellar objects (nebulae, supernova remnants) out of more than 30 catalogs. In our observed region, 13 objects are detected. Table 1 lists the associations and clusters in the observed region from the catalog of Bica et al. (1999) together with their minimum and maximum diameter, and the Bica et al. (1999) classification. For clarity, we recall it. The sequence C (Clusters) to A (Associations) refers to the density, where high density objects are classified as C, and low density objects as A. Objects NA and NC are stellar systems clearly related to emission. Figure 1 presents a map with the location of clusters and associations of interest. Hatano et al. (2006) find 127 Herbig Ae/Be star candidates from near-infrared photometry, mainly in the periphery of LH 9. Herbig Ae/Be star are intermediate mass pre-main sequence stars (37 M⊙) having an age range of 13 Myr.
| ID | Ra | Deg | Class | D | D | Name | Location |
| (arcmin) | (arcmin) | ||||||
| Max | Min | ||||||
| 1 | 04 56 38 | -66 30 26 | NA | 7.30 | 5.90 | LH 9 | LMC-N11 |
| 2 | 04 56 43 | -66 31 28 | NA | 5.10 | 2.10 | NGC 1760, | LH 9 |
| LMC-N11F, | |||||||
| ESO85EN19 | |||||||
| 3 | 04 56 39 | -66 29 00 | A | 4.20 | 3.00 | NGC 1761, | LH 9 |
| SL 122, | |||||||
| ESO85SC18 | |||||||
| 4 | 04 56 34 | -66 28 25 | C | 1.00 | 0.90 | HD 32228, | NGC 1761 |
| KMHK 307 | |||||||
| 5 | 04 56 23 | -66 28 00 | NA | 0.95 | 0.75 | BSDL 270 | NGC 1761 |
| 6 | 04 56 30 | -66 26 40 | NA | 26.00 | 23.00 | LMC-N11, | LMC-N10 |
| LMC-DEM34 | |||||||
| 7 | 04 57 44 | -66 28 30 | NC | 0.30 | 0.25 | HNT1 | NGC 1769 |
| 8 | 04 56 19 | -66 27 19 | A | 1.30 | 0.90 | BCDSP 1 | LH 9 |
| 9 | 04 57 45 | -66 27 52 | NA | 4.10 | 2.60 | NGC 1769,LH 13, | LMC-N11 |
| LMC-N11C | |||||||
| ESO85SC23 | |||||||
| 10 | 04 56 09 | -66 31 25 | NA | 1.50 | 0.90 | BSDL 264 | LH9 |
| 11 | 04 57 17 | -66 24 56 | NA | 0.80 | 0.70 | HT3 | LMC-N11 |
| 12 | 04 57 44 | -66 26 27 | NA | 0.65 | 0.55 | BSDL 324 | NGC 1769 |
| 13 | 04 56 49 | -66 24 23 | NA | 5.20 | 3.60 | NGC 1763, | LMC-N11 |
| IC 2115, | |||||||
| LMC-N11B, | |||||||
| SL 125, LH 10 |
3 The data
Here we first present the HST ACS/WFC archive data we use together with the data reduction and calibration. Then we discuss the infrared Spitzer archive data.
3.1 HST ACS/WFC photometry of the stellar population
Data for six fields in N11 were taken from the ACS/WFI HST archive (PI Maíz-Apellániz, Proposal ID=9419). The studied fields are partially covering the associations LH 9, LH 10, and LH 13. In Fig. 1 we sketch the position of the ACS fields in the N11 complex. The control field to sample the background and foreground population is located outside the N 11 boundaries and is not plotted. Observations are made in the filters F435W and F814W with long exposures of 496 s and short exposures of 12 s. We make use of drizzled files which already account for image distortion. The data are then reduced by means of the packages DAOPHOT/ALLSTAR by Stetson (1994).
The correction for charge transfer efficiency is applied following Sirianni et al. (2005). The instrumental magnitudes are transformed to the ACS-Vega system using the zero points derived by Bohlin (2007).
Figure 3 presents the CMD of the background population.
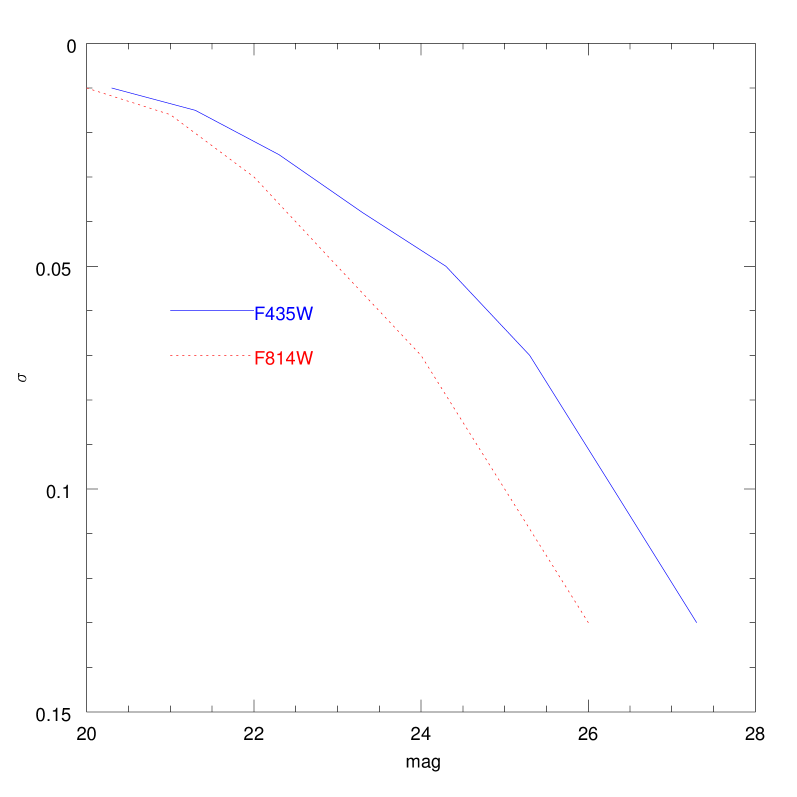
Photometric errors. Photometric errors are estimated in the usual way by means of artificial star experiments, which consists of the injection of a large number of artificial stars of known magnitude into the original image: stars are then recovered through the whole reduction pipeline, and recovered magnitudes are compared to the original ones. The mean magnitude difference between injected and recovered stars, which is taken as an estimate of the mean photometric error, is plotted in Fig. 2 as a function of the magnitude.
Completeness factor. The completeness factors are calculated for each field from crowding tests as the ratio between the recovered stars in a given magnitude interval and the number of original stars in the same interval.
In the field population region the completeness is 90% at F435W and F814W. In the associations, the mean completeness is better than 90% for F814W 24.5 and F435W mag, it becomes 80% at F814W 25.0 and F435W mag, and then steeply declines. At a changing field, the completeness varies by about 7% around the mean value, being slightly worse for the field including LH 13. In the following, the analysis of the luminosity functions (LFs) is limited to F435W mag (or F435W mag), where the completeness correction is quite negligible.
3.2 Infrared Spitzer data
The region was observed by the infrared survey SAGE (Surveying the Agents of a Galaxy’s Evolution) using the Infrared Array Camera IRAC (3.6, 4.5, 5.8 and 8 m) and MIPS (24 m) instruments on board of the Spitzer Space Telescope (Meixner et al., 2006, 2007). All relevant information concerning those archive data, data reduction, and the catalog can be found in Meixner et al. (2006, 2007). Infrared CMDs and color-color plots will be discussed in the following sections.
4 The methods
This section discusses the methods used to study the stellar population in N 11. First, we summarize the Downhill Simplex procedure used to derive the star formation history (SFR) of the field population. Second, we describe how we subtract the field star contamination from HST CMDs of the associations and how we derive the extinction. Finally, we discuss how the two-point correlation function is used to derive the degree of clustering of the stellar population.
4.1 Field population SFR: Downhill Simplex method
A detailed description of the use of the Downhill Simplex method to derive the SFH of the field population can be found in Chiosi et al. (2006b), Chiosi & Vallenari (2007). Here we recall a few points:
(1) To infer the SFR, theoretical CMDs in different age ranges are simulated. The simulations include the spread which is due to the observational photometric errors, reddening, and the effect of photometric incompleteness. In each age bin, 10000 to 15000 synthetic stars are generated down to the photometric completeness limit set at the magnitude where the incompleteness factor is 50%. The synthetic CMDs stand on the sets of stellar tracks, isochrones and single stellar populations by Girardi et al. (2002). We assume the chemical enrichment history in agreement with Pagel & Tautvaišienė (1999), Carrera et al. (2008). Table 2 lists the ages and metallicities of the synthetic stellar populations used in the simulations.
(2) The extinction along the line of sight of the field population is estimated by means of the fit of the CMD with a set of synthetic stellar populations.
(3) The relative contribution of different populations to the total CMD and luminosity/color functions to be compared with the observational ones, in other words the SFR, is derived from a minimization algorithm which makes use of the Downhill Simplex method (Harris & Zaritsky, 2004).
(4) To provide the required constraints to the minimization procedure, we split the observational CMD into a number of suitable magnitude-color bins. Recent work concerning the determination of the SFR from the CMDs has pointed out the importance of using a binning that takes the various stellar evolutionary phases into account, as well as the uncertainties of the stellar models (Rizzi et al., 2002; Chiosi et al., 2006a). To avoid spurious solutions, the fit is mainly based on the main sequence magnitude. To properly sample the age of the population, the magnitude bin is variable, being 0.5 mag from 16 to 19 mag, and 0.25 mag from 19 mag to 25 mag.
| Age (Gyr) | Z |
|---|---|
| 0.08 0.12 | 0.006 0.010 |
| 0.12 0.30 | 0.006 0.010 |
| 0.30 0.40 | 0.006 0.010 |
| 0.40 0.50 | 0.006 0.010 |
| 0.50 0.60 | 0.006 0.010 |
| 0.60 0.80 | 0.006 0.010 |
| 0.80 1.00 | 0.006 0.010 |
| 1.00 2.00 | 0.006 0.010 |
| 2.00 3.00 | 0.005 0.010 |
| 3.00 4.00 | 0.003 0.005 |
| 4.00 5.00 | 0.003 0.005 |
| 5.00 6.00 | 0.003 0.005 |
| 6.00 8.00 | 0.0017 0.003 |
| 8.00 10.00 | 0.0017 0.0017 |
| 10.00 12.00 | 0.0017 0.0017 |
4.2 Field star subtraction
Field subtraction is a critical issue to isolate the population of N 11. Field stars are statistically subtracted from the CMDs of the association. First, the CMDs of both association and field are divided in boxes of the size of and . The incompleteness correction is taken into account by dividing the field and association CMDs in magnitude-color bins and then adding on each bin having Nth stars, objects, where is the smallest of the and completeness factors. At each CCD area in both the association and in the field the appropriate completeness correction as calculated from artificial star experiments is applied. Then the closest cluster star is subtracted in each box of the N11 CMD for every field star. This procedure was already used in a number of papers where more detail can be found (Chiosi et al., 2006a; Chiosi & Vallenari, 2007).
4.3 Determination of the interstellar extinction in N 11
In order to study the stellar population in the association, it is necessary to derive a detailed map of the interstellar extinction which is expected to be highly variable. First, we select the main sequence stars brighter than F435W . The comparison between the CMDs of the field population and those of N11 shows that these stars have a high probability to belong to the association, since they are brighter than the youngest turnoff of the field population (see Figs. 5 and 3). About 1000 stars are found in this magnitude range. Then, assuming that the spread in color of the stars at a given magnitude is due to interstellar extinction only, their color is compared with the intrinsic color expected for main sequence stars having an age of 5 Myr (see discussion in Sect. 6), which allows the determination of the color excess E for each star. We assume the extinction law by Sirianni et al (2005). Then the E values are interpolated using the package GRIDDATA in IDL as a function of the coordinates. Finally, the extinction of each star in the field is calculated from the interpolated map.
4.4 Statistical analysis of the stellar spatial distribution
We present the methods used to study the degree of clustering of the stars and derive the spatial scale of the formation. First, we define the two-point correlation function, second we describe the minimal spanning tree method.
4.4.1 Two-Point correlation function
The probability of finding a neighbor in a shell element at a distance r from an object of the sample is
| (1) |
where is the two-point correlation function, is the number density of objects found in an annulus centered on the i-th object and having a radius between r and r+dr, N is the total number of objects, and finally, is the average number (Peebles, 1980). A Monte Carlo algorithm is used to derive the area covered by the data when the annulus extends outside the studied region. Using the above definitions, a random distribution of stars will produce a flat correlation, with . A peaked at small radii indicates a positive correlation, and the full width half maximum of the peak itself represents the spatial scale of the clustering. The distribution of the nearest neighbor distance might reflect the structure of the interstellar medium from which the stars formed. The absolute value of is a measure of the concentration of the objects at a given distance r relative to the average distribution (Peebles, 1980).
4.4.2 Minimal Spanning Tree
The Minimal Spanning Tree (MST) is a powerful method used in literature for a statistical analysis of the spatial distribution of the stars in a cluster (see Cartwright & Whitworth, 2004; Schmeja & Klessen, 2006, for a detailed discussion). The MST is the unique network of straight lines joining a set of points (vertexes), so that it minimizes the total length of all the lines (called edges) without creating closed loops. In this paper, we make use of the routine mst (Haymond et al., 1984), based on Prim’s algorithm (Prim, 1957) to construct the MST. Starting from an arbitrarily chosen first point, an edge is created joining that point to its nearest neighbor. The tree is then calculated constructing the shortest link between one of its nodes and the unconnected points, until all the points are connected. Once a MST is calculated, its mean edge length is directly defined. The is dependent on the total number of stars in the cluster, in the sense that as increases, shorter edges are created and decreases. For this reason, Cartwright & Whitworth (2004) normalize to when comparing clusters that have a different object number and/or areas . Cartwright & Whitworth (2004) and Schmeja & Klessen (2006) demonstrate that the structure of a cluster can be derived comparing the of the MST describing it, to the normalized correlation length defined as the mean separation between the stars normalized to the radius of the region.
This defines the parameter Q as .
Cartwright & Whitworth (2004) show that decreases more quickly than as the degree of the central concentration becomes more severe (indicating the presence of a radial gradient), while decreases more quickly than as the degree of subclustering is getting higher. Q can be used to distinguish between subclustering ( ) and the presence of a large scale radial density gradient (). It should be remembered that Q cannot give any information about the fractal nature of the sub-clustering, i.e. it cannot say whether the subclustering is hierarchically self-similar.
5 Results: the SFR history of the field population
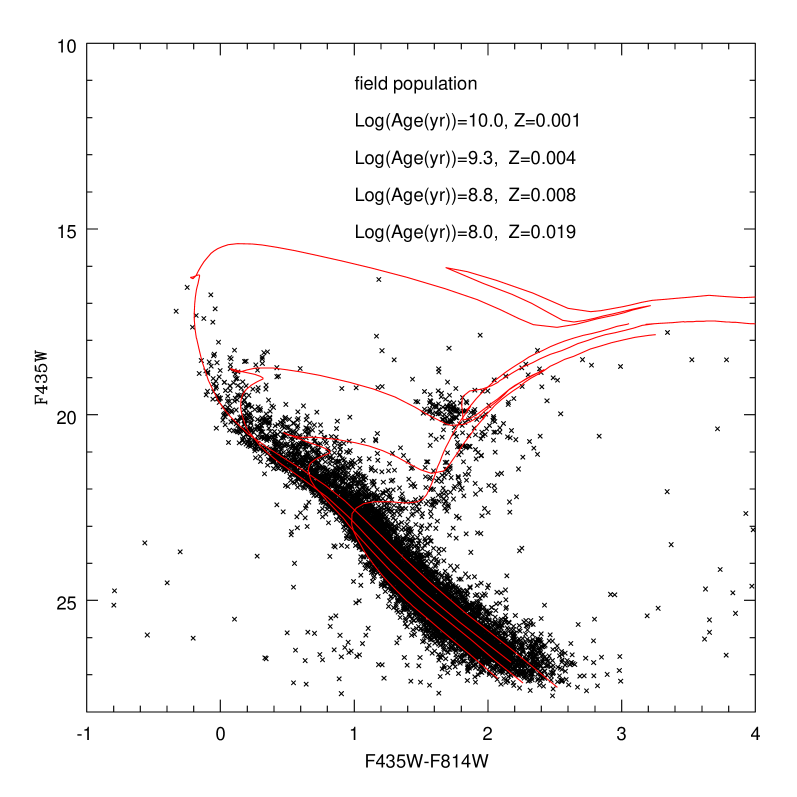
Fig. 3 presents the CMD of the field population where isochrones of different ages are superposed. The youngest field population shows a turnoff at about F435W 1719, and the stars burning He in the core are located at F435W . The CMD suggests the presence of an intermediate age and young population.
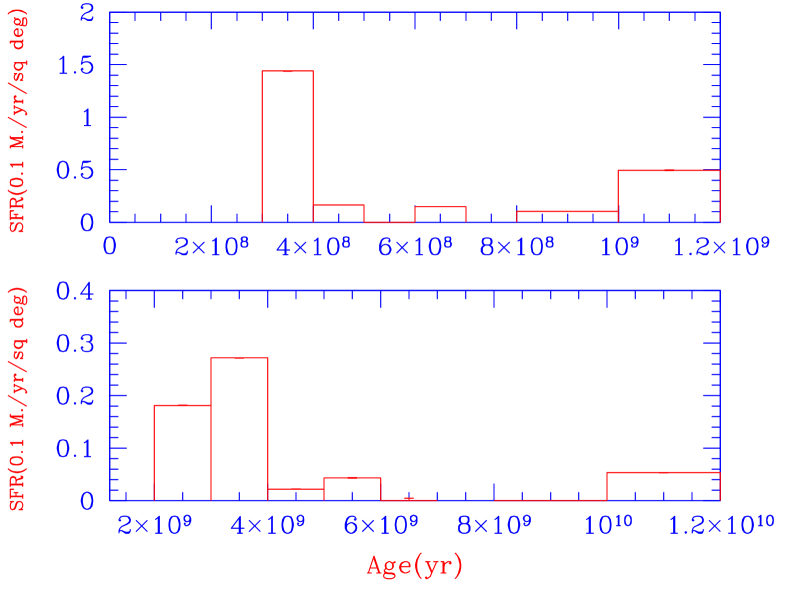
The detailed determination of the star formation rate is presented in Fig. 3 (lower panel) and reveals the presence of a small component of a very old population (1012 Gyr), an intermediate age component in the range 26 Gyr, and several bursts of a younger population, up to 0.4 Gyr. This result agrees with previous determinations by Dolphin et al. (2001); Harris & Zaritsky (2004); Javiel et al. (2005).
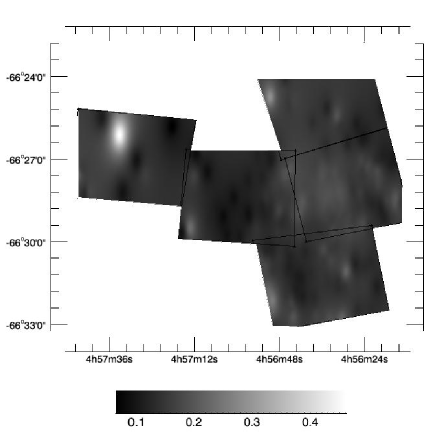
6 Results: the interstellar extinction
The map of the interstellar extinction in E is presented in Fig. 4. The interstellar extinction E(F435W-F814W) is found to be in the range of 0.20.5. This corresponds with A- using the relations by Sirianni et al. (2005) and agrees with the values derived by means of the spectroscopy of bright stars by Mokiem et al. (2007). The main source of uncertainty on our determination of the extinction is due to the presence of an age spread inside the young main sequence stars. We derive the extinction using main sequence isochrone with an age of 5 Myr, while ages as young as 2 Myr are found for the blue population (see discussion in the following Section). At F435W=12.5, the expected MS color difference between an age of 2 Myr and 5 Myr is of 0.07 mag, while at F435W=14 is 0.01 mag. These values can be regarded as an estimate of the uncertainty on E.

7 Results: Ages and stellar content of the associations inside N 11
Here we analyze the CMDs of the most relevant associations inside N 11 with the aim of deriving the age of the stellar population.
We assume a mean value of Z=0.19 for the metal content of the association, in agreement with Pagel & Tautvaišienė (1999), Dirsch et al. (2000).
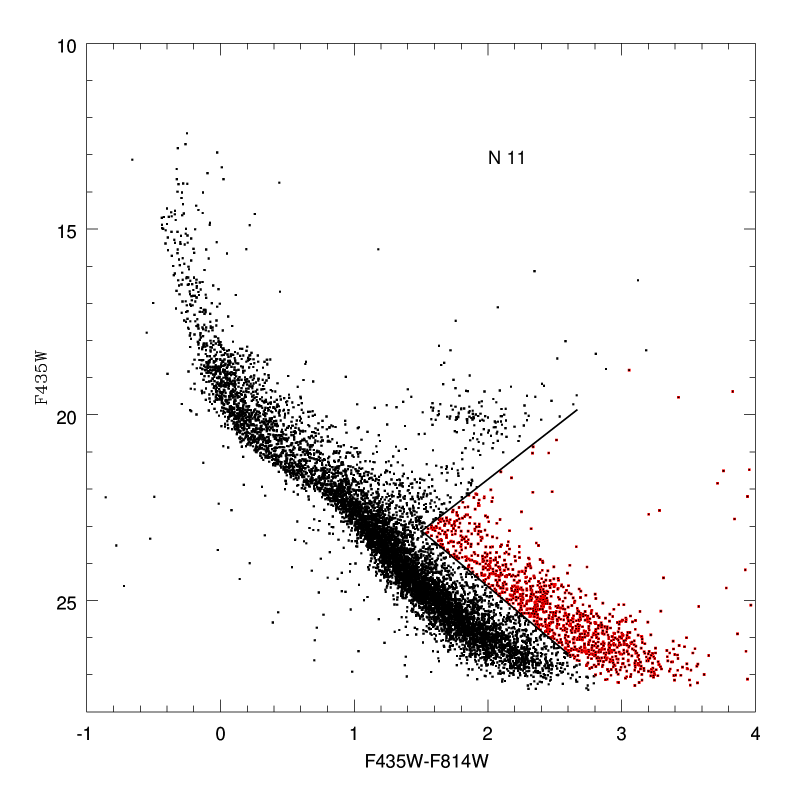
Figure 5 present the CMD of the N11 region covered by the HST/ACS photometry. A well-defined upper main sequence of young blue stars is present.
Below the turnoff, moving to fainter magnitudes, the main sequence in
the CMDs of the associations and of the field population is
increasingly densely populated. A striking difference at faint magnitudes between field and association
CMDs is evident in the region redder than the MS, where a well-populated sequence almost parallel to the MS itself
is found in the associations, but is completely absent in the field region (see Figs.3 and 5).
These stars fit the location of the PMSs previously discovered in other MC associations very well (Gouliermis et al., 2007, 2006).
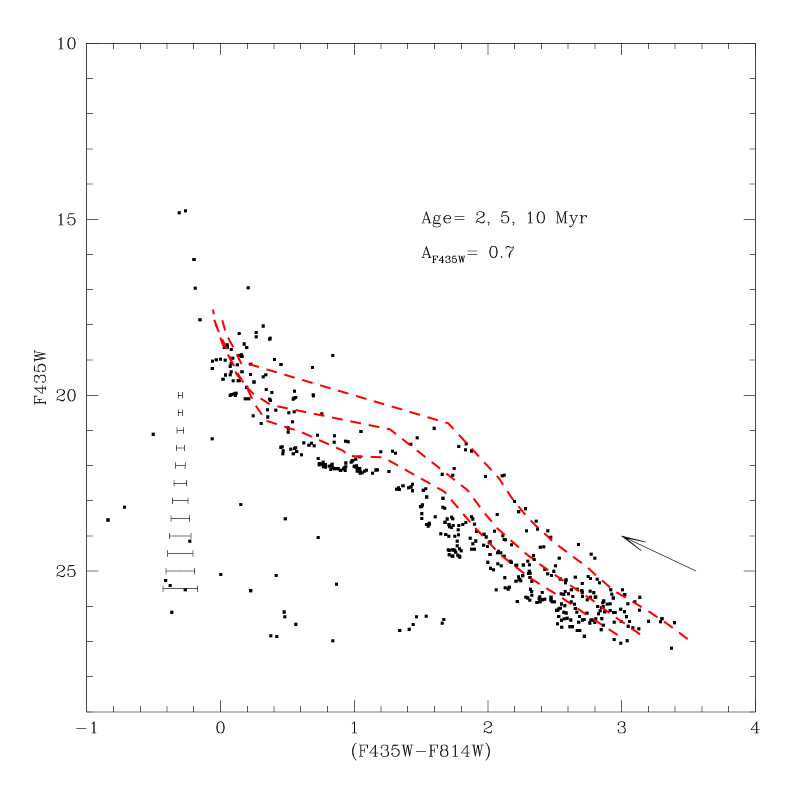
Suspicion might arise that the stars we identify as PMSs are instead highly reddened MS objects.
However, the fact that the interstellar extinction vector in the passbands F814W-F435W is almost parallel to the PMS sequence(see Figs. 6, 7, 10) means that the interstellar extinction has only a small effect on the age of the PMSs.


7.1 The stellar population in LH 9
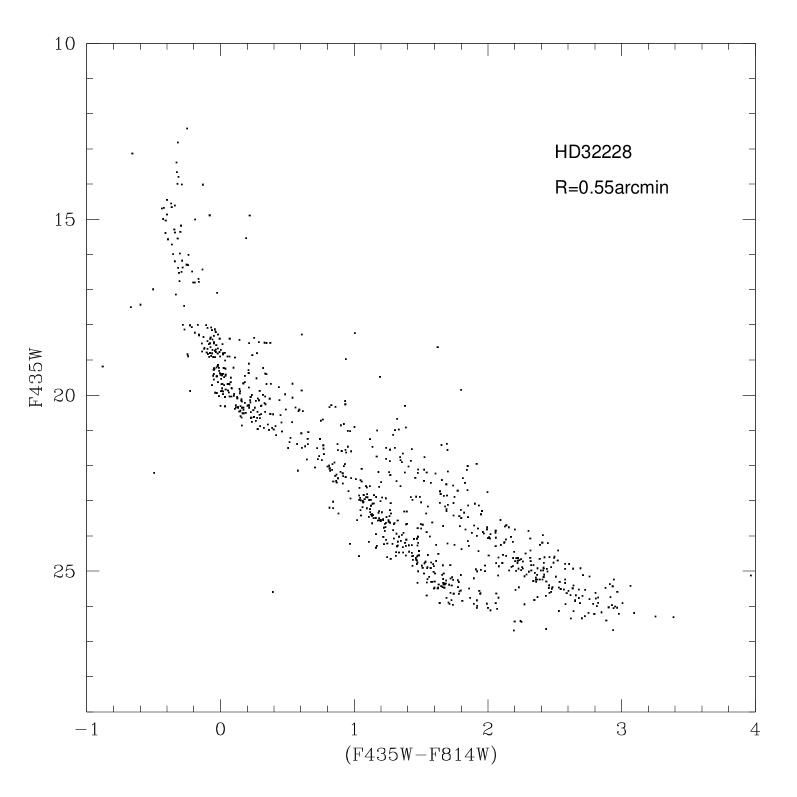
The most relevant associations/clusters in LH 9 in the region observed by HST are NGC 1760, NGC 1761, HD 32228, BCDSP 1, BSDL 270.
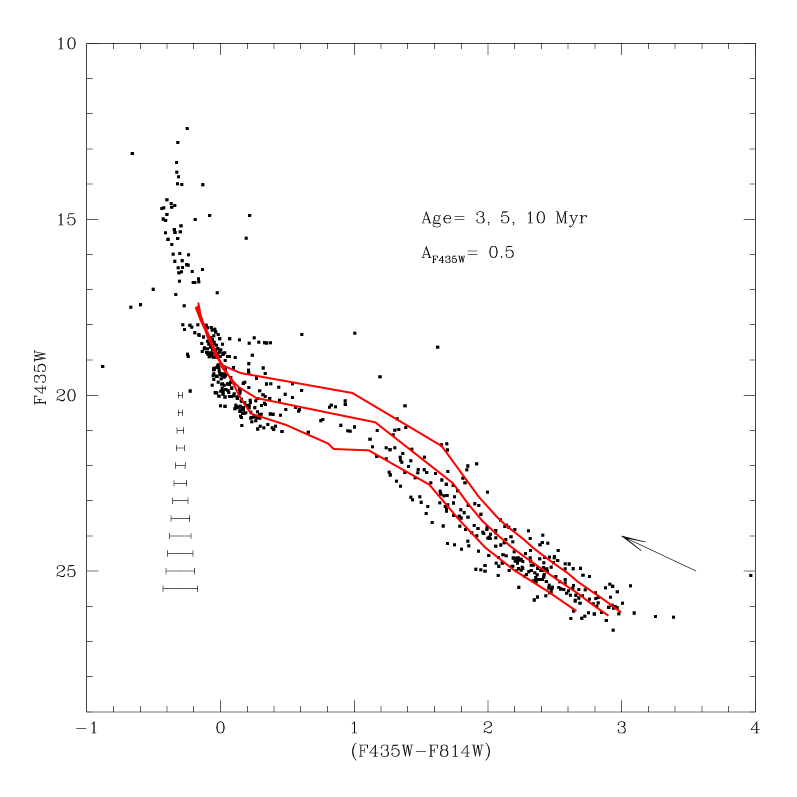
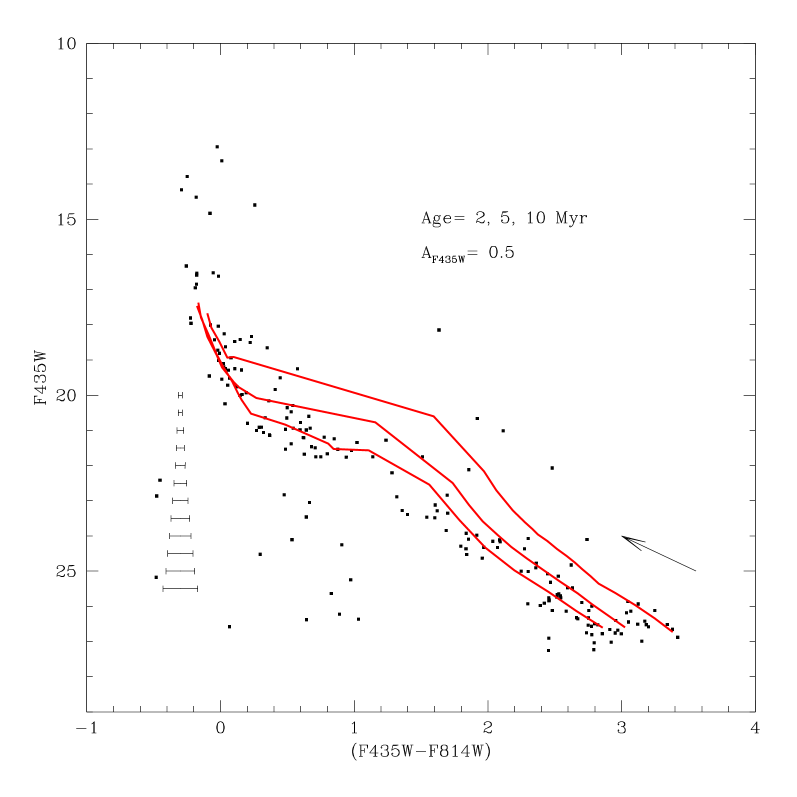
Figures 6 and 7 present the CMDs of these objects before and after the field star subtraction. The PMS population is clearly visible in all the fields. The CMDs after the field star subtraction are compared with pre-main sequence isochrones by Siess et al. (2000) converted from the Johnson-Cousins pass-bands to the HST/ACS pass-bands using the transformations by Sirianni et al. (2005). Below we discuss the age determination of each object. As a general remark, we remind that it is difficult to derive a precise age determination of the PMSs on the basis of the CMDs only. Several effects such as photometric errors, binarity, differential extinction across the field and age spread in the population cannot be disentangled (see for a detailed discussion Hillenbrand et al., 2008). This holds for all the objects studied here. This problem will be discussed in the following sections.
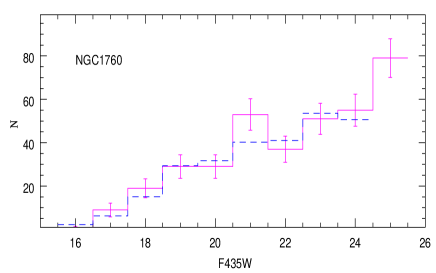
NGC 1760. Comparing the location of the PMSs with isochrones, we derive a tentative estimate of the age in the range of 210 Myr. (see Fig. 6). More stringent constraints can be derived on the basis of the luminosity function. The observational LF after incompleteness correction, field star subtraction and extinction correction is compared with the theoretical one expected from the Siess et al. (2000) PMS isochrones. We make use of an authomatic procedure to find the best fitting solution. The LF of the PMSs (see Fig. 8) is suggesting a prolonged formation from 2 to 10 Myr (for single stars) with a IMF slope (when the Salpeter value is ). In the best-fit solution, the majority of the stars (about 75% of the objects brighter than F435W 24.5) are however older than 6 Myr, while the youngest population (2 Myr) can account for less than 1% of the population. The mass range of the PMSs is from 1.5 to 3.5 M⊙ and 1.38 to 1.7 M⊙ for 2 and 10 Myr, respectively. The lower mass limit corresponds to F435W . Our value of the IMF slope agrees with Parker et al. (1992) who find for masses higher than 89 M⊙.
The question at hand is how reliable the age and age spreads are which we find from the CMD and LF analysis. With regard to the age spread, photometric errors and binarity can complicate the analysis. Binarity can be distinguished from age spread only when empirical luminosities are known with high accuracy (Hillenbrand, 2009). For single stars, taking into account photometric errors, we can say that the percentage of stars older than 6 Myrs is ranging from 65% to 83%. On the basis of this discussion, it would be unrealistic to reach a more precise conclusion concerning the age distribution. Multiplicity surveys found a relatively high binary frequency ( 60%) for masses higher than solar in young associations in the Galaxy (among others Duquennoy & Mayor, 1991). If we impose that 60% of stars are in binary systems, we do not derive a significantly different age spread.
In addition to these effects, it is well known that systematic trends are found in the literature using various sets of pre-main sequence tracks. This holds in particular at sub-solar masses, while at solar masses the agreement is better. In addition, an age-with-mass trend is found, i.e. higher stellar masses are predicted to be older than lower mass stars in the same objects using the same set of stellar tracks. All this can easily account for 20% to 100% of the age difference when comparing the ages we derive with values taken from various literature sources (see among others Hillenbrand et al., 2008; Hillenbrand, 2009). Taking these uncertainties into account, we find a remarkably good agreement of our PMS ages with the literature spectroscopic determination of the ages of blue stars. OB stars are found in NGC 1760 by Mokiem et al. (2007). This sets a limit to the age at 7.0 Myr. These authors find that the age range is broad in the whole association, going from about 7 to 12 Myr.
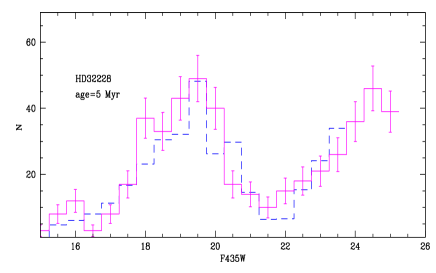
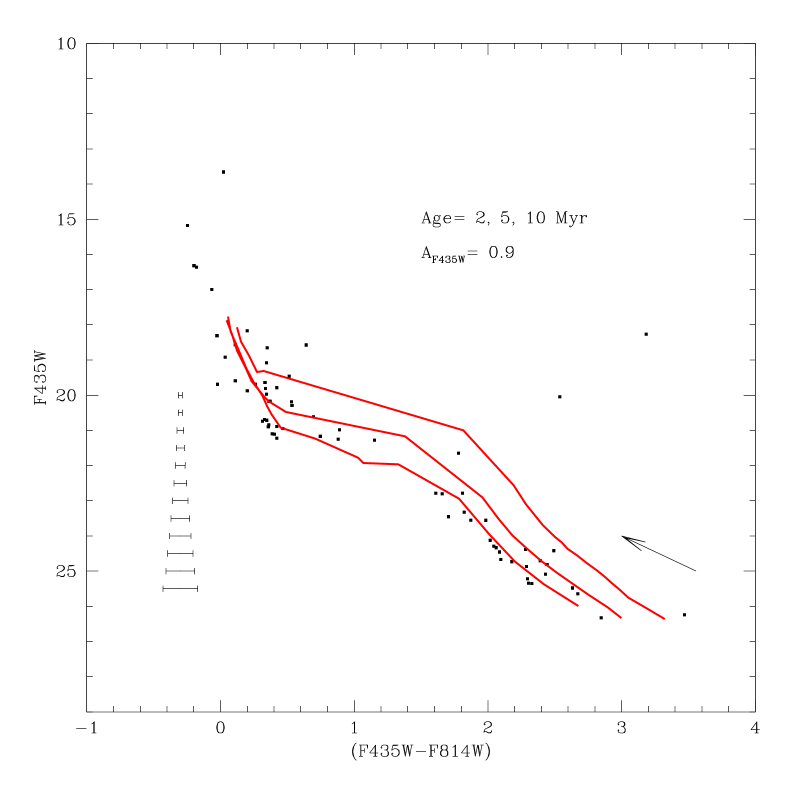
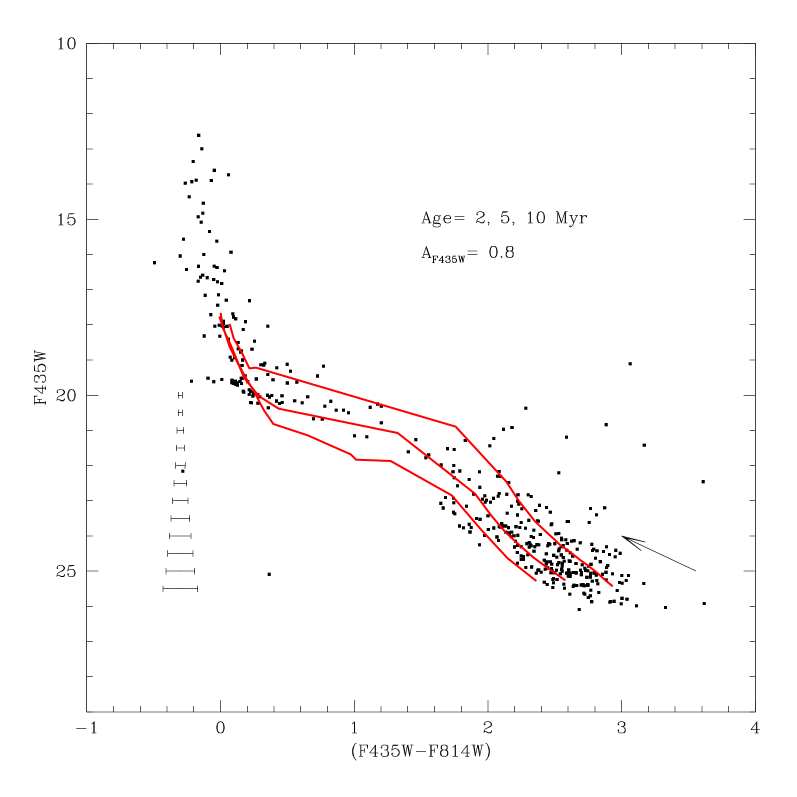
HD 32228. A high concentration of PMSs is found in HD 32228 located at the periphery of the association LH 9. Comparing the location of the PMSs with isochrones we find that the age of the PMS is in the range of 310 Myr (see Fig. 6). If we assume that no binary stars are present, the LF of HD 32228 PMS after field star subtraction and extinction correction suggests that the dominant population has an age of 5 Myr and a IMF slope (see Fig. 9). The mass range of the PMSs reaches from 1.5 to 2.5 M⊙ when F435W . However, a small age spread cannot be ruled out: solutions including, in addition to the main population of 5 Myr, about 25% of the stars are as old as 7 Myr, and a small fraction younger than 5 Myr cannot be ruled out. Assuming that about 60% of the stars are in binaries, we derive a slightly older age of the dominant population (6 1 Myr), with a Salpeter IMF. The age of the cluster HD 32228 derived from spectroscopic of bright stars is of about 34 Myr (Walborn & Parker, 1992) based on the presence of a WC star.

BSDL 270 and BCDSP 1. A small population of PMSs is found in these two small objects located at the periphery of LH 9. Comparing the location of the PMSs with isochrones in BSDL 270 and BCDSP 1, we find that a reasonable estimate of the age is in the range of 510 Myr (see Fig. 7). Due to the scarcity of the PMS number, the LF cannot reliably give information about the age of the stars. Several B stars are found in these clusters, and one O6.5V (N11-065) is in BCDSP1 (Mokiem et al., 2007). N11-065 has a location on the HRD compatible with an age of about 1 Myr. However, Mokiem et al. (2007) find that this object has high He abundance. Using the appropriate isochrones for the surface He abundance, they derive an age of 6 Myr. It is quite remarkable that in the whole region inside the uncertainties there is a good agreement between the ages of young blue stars and of the red PMSs.
7.2 The stellar content of LH 10
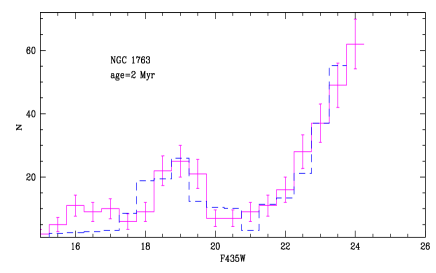
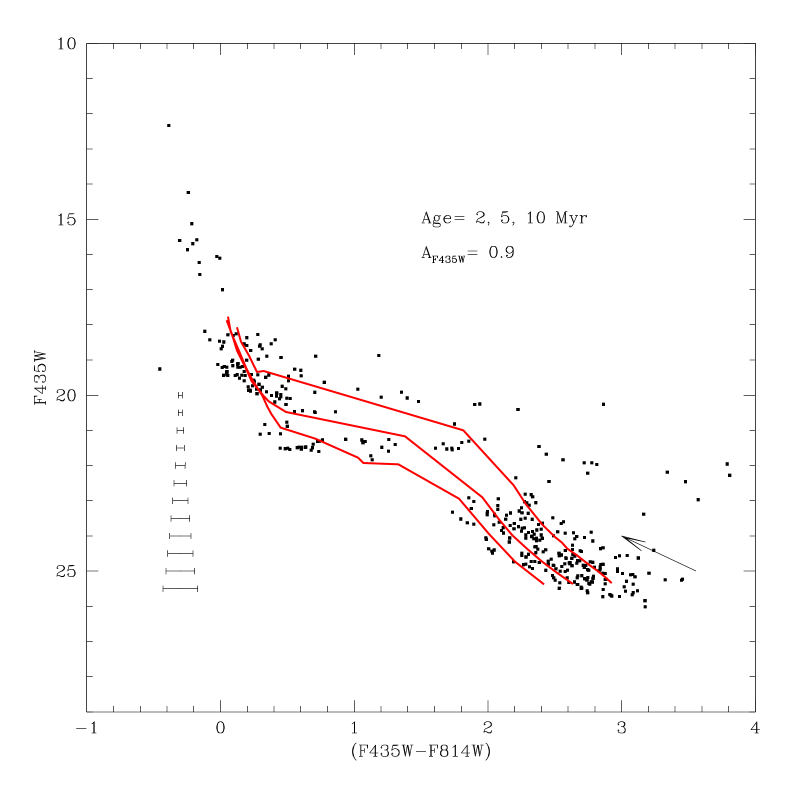
The CMD of NGC 1763 in LH 10 before and after the field population is subtracted is shown in Fig. 10. The CMDs refers to a small region near the center of a radius . PMSs are clearly identified in the CMD. The LF for single stars is presented in Fig. 11 after incompleteness correction, field star subtraction and extinction correction. The comparison of the observational models with the theoretical one calculated using Siess et al. (2000) models suggests that the dominant population has an age of 23 Myr, using a IMF slope . The PMS mass range is 1.53.5 M⊙. As we discussed in the previous section, it is difficult to completely discard solutions having a small percentage of older objects. This result agrees with Parker et al. (1992) who find that the slope of the initial mass function of the young blue MS stars in LH 10 is , significantly flatter than that of LH 9. If we account for 60% of binaries, we derive an age of 3 Myr, with a steeper IMF (). Using bright blue star spectroscopy, Heydari-Malayeri et al. (2000) estimate that LH 10 in N11B is 3 Myr old. Mokiem et al. (2007) derive a broad age spread in LH 10 from 1 to 6 Myr. But the majority of the stars are younger than 4.5 Myr, and only one object (N11-087) in the cluster core is older than this age. These authors conclude that the mean age is 3 Myr. Herbig Ae/Be stars are found inside the association, together with a methanol maser (Hatano et al., 2006).


7.3 The stellar population in LH 13
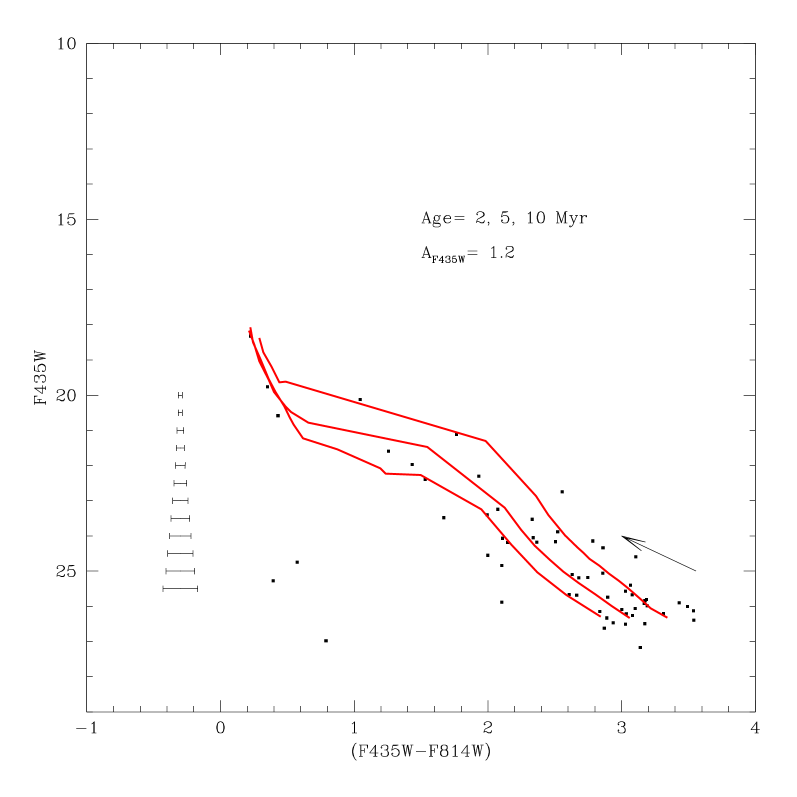
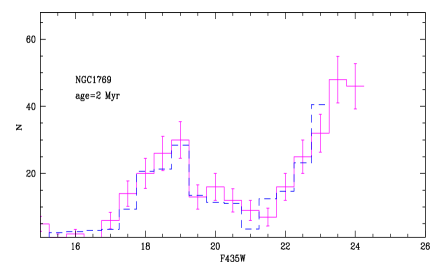
Our HST data in LH 13 include NGC 1769 and BSDL 324. The CMDs of the association before and after the field population is removed are shown in Fig. 12. The comparison of the location of PMS on the CMD of NGC 1769 with isochrones suggests an age in the range of 25 Myr. Analyzing the PMS LF (see Fig. 13) we find that the dominant population (about 85% of the stars) have an age of 23 Myr with a Salpeter IMF when only single stars are considered. The PMS mass range is 1.53.5 M⊙. Including of binaries, we derive an age of 34 Myr, with a steep IMF slope . No information about the age of the PMS in BSDL 324 can be derived from the CMD, due to the small number of stars detected. Spectroscopic determination of the age of OB stars in LH 13 are in the range of 35 Myr (Heydari-Malayeri et al., 2000). A small concentration of Herbig Ae/Be stars is found here (Hatano et al., 2006).
7.4 YSOs from near-IR archive data: data selection and object distribution
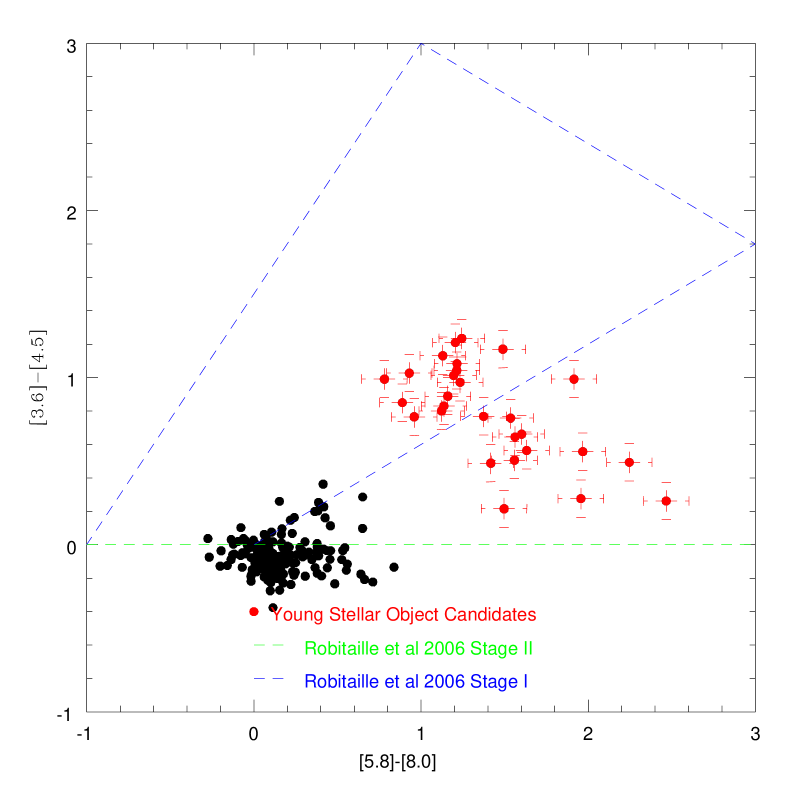
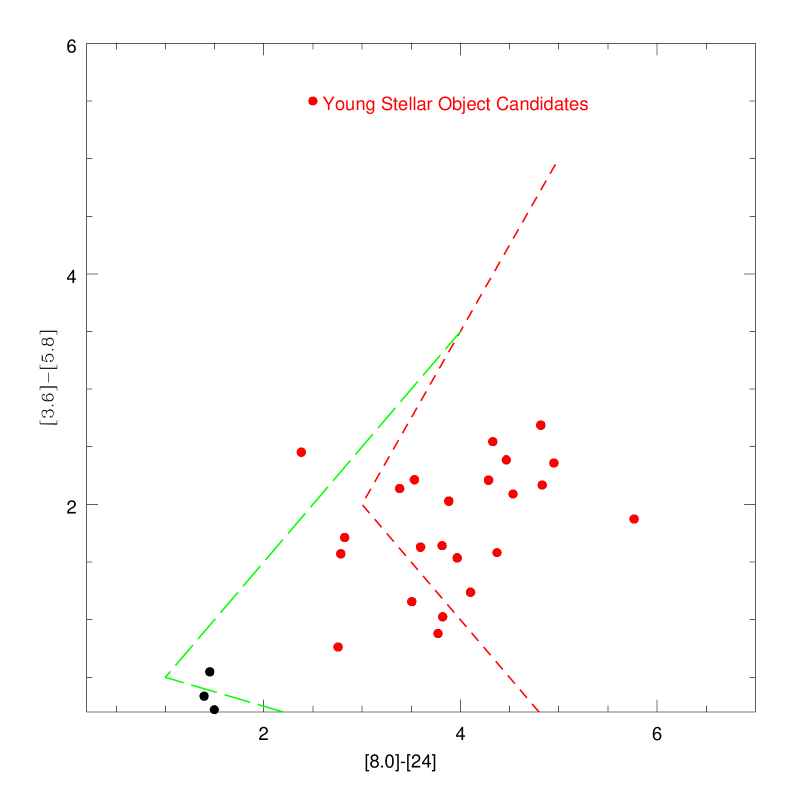
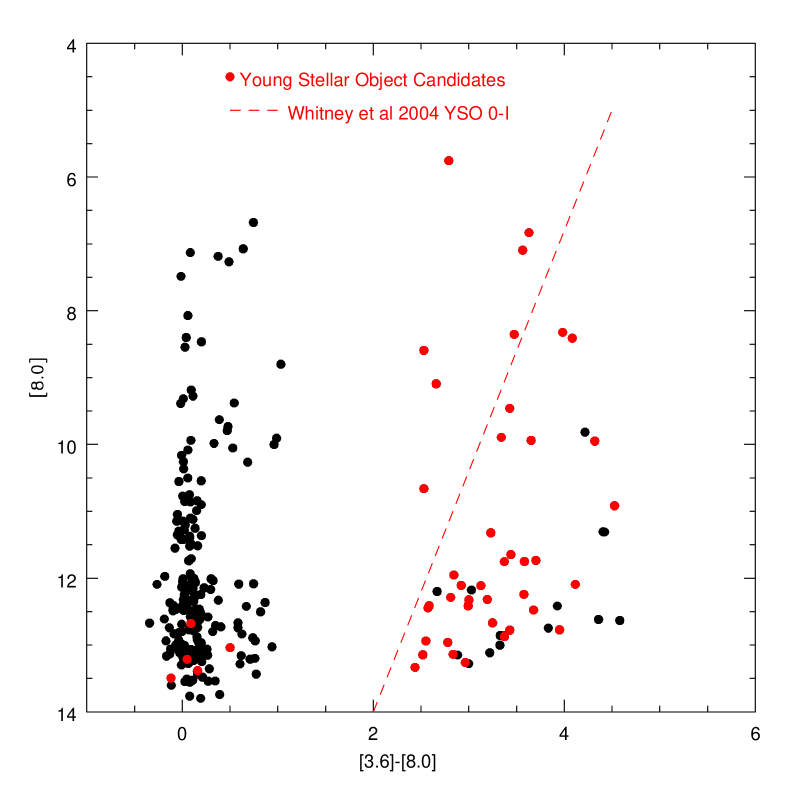
In this section the detection of YSOs on the basis of IR Spitzer archive data is presented. The comparison of the observational color-color plots in the infrared passbands with the models by Robitaille et al. (2006) allows us to select candidate YSOs of Stage 0-I (presenting significant infalling envelope , and having ages of 0.1 Myr) and Stage II (showing a thick disk source, having 0.1 age a few Myr) and finally, Stage III YSOs sources (with an optically thin disk or no disk). Here we adopt the classification by Robitaille et al. (2006), which is analogous to the traditional Class scheme (Lada, 1987). On the basis of 200,000 YSO models computed at ten viewing angles, Robitaille et al. (2006) point out that the IRAC color-color plot ([5.8][8.0])-([3.6][4.5]) contains a large region where the fraction of Stage 0-I/all YSOs is close to 100%, a small intermediate region where the fraction of Stage II/all sources is higher than 80%. IRAC-MIPS ([8.0][24])-([3.6][5.8]) are effective in separating stars with no circumstellar material from Stage 0-I and Stage II objects. Here we restrict ourselves to study Stage 0-I and Stage II objects. In Figs.14 and 15 the SAGE archive data in the N 11 region are plotted in the IRAC color-color plot ([5.8][8.0])-([3.6][4.5]) and IRAC-MIPS color-color ([8.0][24])-([3.6][5.8], respectively to identify the YSOs. Finally YSOs candidates selected on the basis of previous plots are examined in the [8.0]-([3.6]-[8.0]) color-magnitude diagram and compared with the Whitney et al. (2004) models (see Fig. 16). About 30 objects are identified as YSO candidates. Background galaxies and foreground Milky Way stars are known to contaminate the IRAC and MIPS CMDs and color-color plot. In order to derive the expected contribution in the studied region, we select a control field located outside the star forming region, namely at =4h 58m 40s, -660 34 47′′, which has an area comparable to the area of the whole N 11 field. Using the same diagnostic plots we find six objects in the control field redder than ([3.6]-[8.0]) in the [8.0]-([3.6]-[8.0]) color-magnitude diagram and only 3 (over 30 in total) in the region occupied by YSO candidates in the ([5.8][8.0])-([3.6][4.5]) color-color plot. Only 10% of the YSO candidates having [8.0] are expected to be background objects. The percentage of background galaxies agrees with the statistics by Meixner et al. (2006).
The YSO spatial distribution is shown in Fig. 18: type I and II objects having ages from 0.1 to 1 Myr are found at the same location as the PMSs, indicating that several generations of stars are present in the region. The youngest candidates (type I) are found in NGC 1760 (LH 9), north of BCDSP1 (LH 9) and NGC 1769 (LH 13).
7.5 Toward a coherent picture: the PMS, YSOs, OBs, Herbig Ae/Be and their age distribution
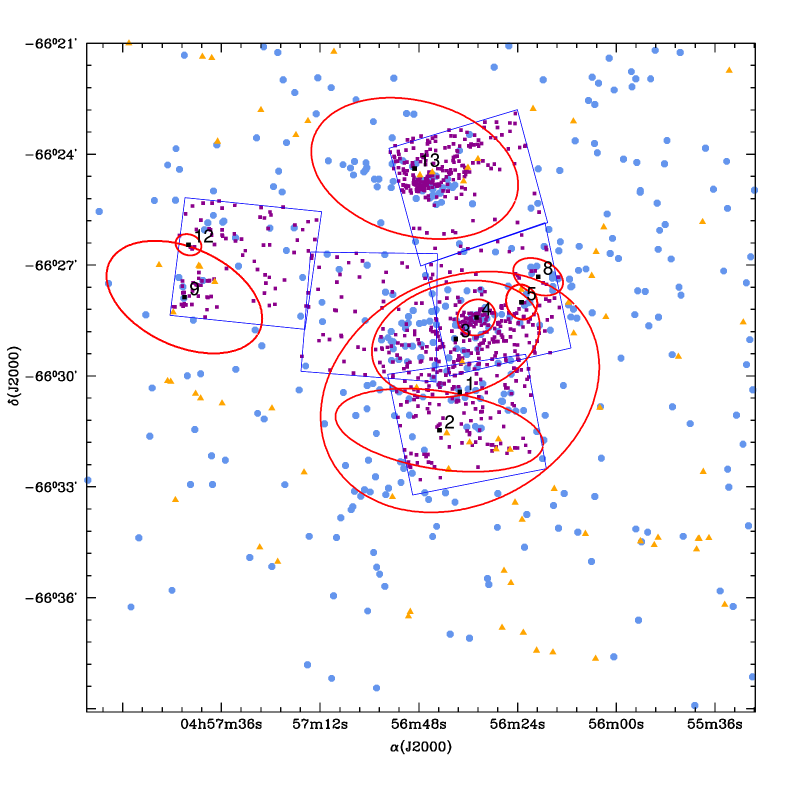
In Fig. 17 we compare the spatial location of the PMSs with the location of Bica et al clusters and associations in the area and with the distribution of the OB stars and Herbig Ae/Be candidates (Hatano et al., 2006). Summarising the results of the previous sections, the ages derived in literature from spectroscopy of blue stars and from PMS analysis are quite consistent in the whole area. The analysis of HST data implies that PMSs in LH 9 South the majority of the stars are slightly older than the remaining part of N 11, while LH 9 North, LH 10(center) and LH 13 seem to be younger (with ages of 5, 2, 2 Myr). A large age spread from 1 to 6 Myr is found from the spectroscopy of blue stars in these regions and is confirmed by our analysis. The presence of YSOs in LH 9 South, LH 13 (type I) and LH 9 (North), LH 10 (Type II) suggests that the star formation in the region is still going on. The most conspicuous concentrations of PMSs correspond to the location of OB stars. Herbig Ae/Be stars are found in all these locations, confirming the presence of a population of ages in the range of 13 Myr. All the indicators present a coherent picture of the star formation in the region. Mokiem et al. (2007) estimate that the time needed for a supernova shock to cross the distance between LH 9 and LH 10 is of the order of 0.1 Myr. Since the lifetime of a massive star is of the order of 3 Myr, the age difference agrees with the idea that LH 9 has triggered the formation of a first star generation in LH 10. This cannot be excluded on the basis of our discussion, even if more generations of stars are found in the region.
We compare the location of PMSs and YSOs with Hα emission (Mac Low et al 1998) and CO emissions (Israel et al 2003) (see Fig. 18). We find that PMSs and YSOs are located near the maxima of the Hα emission and at the border of the CO clouds in N11B and N11C. PMSs are found at the border of the cavity surrounding LH 9.
8 Results: clustering of PMS stars
In this section we discuss the clustering degree of the PMSs, first using the two-point correlation function and then the MST method. Only the stars selected as PMSs on the basis of the HST/ACS photometry are considered.
The correlation function for the PMSs shows a well defined peak, while in the case of the whole star sample it is considerably flatter, implying a weaker correlation (see Fig. 19). The maximum value of the correlation function of the PMSs is comparable to the peak values found in Galactic star forming regions such as Rosetta Molecular cloud (Li & Smith, 2005) or M16 (Indebetouw et al., 2007) and reflects the strong degree of clustering of the population.
The full width half maximum of the peak for PMSs is of pc, of the order of the typical size of molecular clouds in the SMC and LMC which is going from about 10 to 100 pc (Israel et al., 2003). This reflect the structure of the interstellar medium from which the stars formed. This result may however be affected by a potential bias due to the fact that the ACS pointings are not covering the whole region, but are mainly centered on well-known star forming regions, where higher concentrations of young stars are expected.
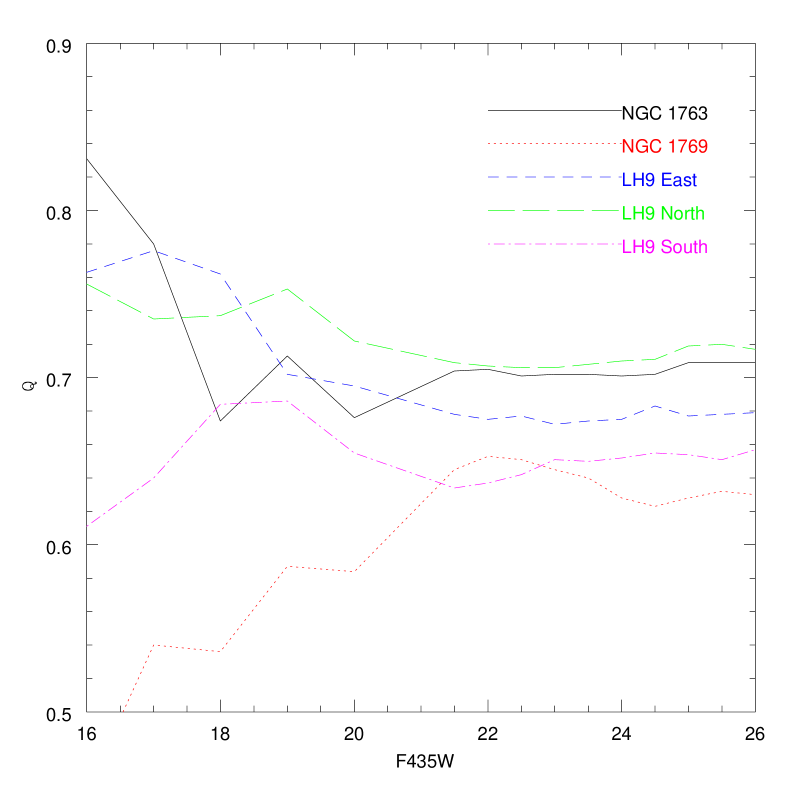
In Fig. 20 we present the MST graphs of some of the clusters and associations in the region. In Table 3 we give the values of the Q parameter, calculated selecting the stars inside the elliptical areas described by the Bica et al. cluster parameters. Although in principle Q is not expected to depend on the selected area, Bastian et al. (2009) found a degeneracy in the sense that highly elongated structure like these show a lower Q value. The values in Table 3 include the ellipticity correction derived by Bastian et al. (2009). To avoid the uncertainties due to the shape, we calculate Q using the quadrilateral areas which correspond to the observational CCD fields.The results are presented in Table 4 for all the stars. No significant changes are found due to the area selection. To verify whether blue bright stars and fainter red PMSs have a similar clustering behavior, we calculate Q for PMSs fainter and brighter than F435W . Tables 5 and 6 respectively show the results. We use quadrilateral areas. Finally we derive Q for the OB star candidates taken from the Hatano et al. catalog in an area of 0.24 sq. deg. in the centre of the N11 star forming region. The corresponding graph is presented in Fig. 20. The Q parameter is derived for the whole area, without subdivision in smaller fields, due to the small number of OB candidates. Figure 21 shows the trend of Q with the magnitude of the population. Q is calculated for all the stars brighter than a given magnitude. The main results can be summarized as follows:
-
•
In all the fields related to N11, the values of Q 0.8 are typical of clustered substructures. Smaller objects have slightly scattered Q values in the range of 0.620.74. For comparison, we remind that Cartwright & Whitworth (2004) find that a value of Q corresponds to a projected fractal model with dimensions of 1.8,2.2, 2.4 respectively.
Table 3: Values of Q for the all the stars inside the cluster areas given by the Bica et al parameters. Object Q NGC 1769 0.86 1.33 0.65 NGC 1763 0.73 0.98 0.75 NGC 1761 0.77 1.18 0.66 NGC 1760 0.73 1.20 0.56 HD 32228 0.73 0.93 0.79 BSDL 324 0.80 1.11 0.73 BSDL 270 2.45 3.64 0.67 BCDSP 1 0.78 1.19 0.66 Table 4: Values of Q for all the stars in quadrilateral areas corresponding to the CCD fields (see text for details). Object Q NGC 1763 0.68 0.98 0.70 NGC 1769 0.70 1.13 0.62 LH 9 East 0.71 0.97 0.74 (NGC 1761 E) LH 9 North 0.71 0.97 0.74 (NGC 1761 W,HD 32228, BCDSP 1,BSDL 270) LH 9 South 0.71 0.97 0.74 (NGC 1760) Field stars 0.76 1.12 0.67 Table 5: Values of Q for PMS (fainter than F435W ) in quadrilateral areas corresponding to the CCD regions. Object Q NGC 1763 0.70 1.00 0.70 NGC 1769 0.71 1.15 0.62 LH 9 East 0.77 1.11 0.70 (NGC 1761 E) LH 9 North 0.75 1.04 0.72 (NGC 1761 W,HD 32228, BCDSP 1,BSDL 270) LH 9 South 0.75 1.12 0.67 (NGC 1760) Table 6: Values of Q for BMS (F435W20) stars (quadrilateral areas). Object Q NGC 1763 0.63 0.93 0.68 NGC 1769 0.67 1.12 0.58 LH 9 East 0.76 1.09 0.69 (NGC 1761 E) LH 9 North 0.70 0.97 0.72 (NGC 1761 W,HD 32228, BCDSP 1,BSDL 270) LH 9 South 0.76 1.16 0.65 (NGC 1760) 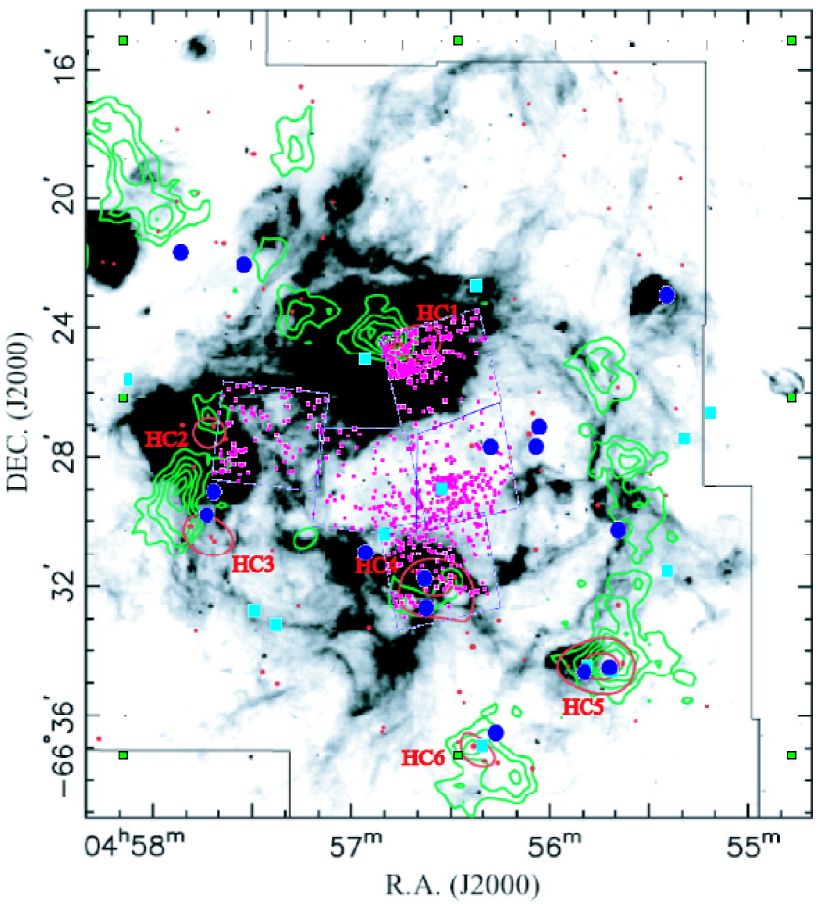
Figure 18: H emission map (inverted intensity scale) by McLow et al (1998). Large boxes show the ACS/WFC fields. Green contours indicate the CO clouds (Israel et al 2003), small red dots show the PMS candidates selected on the basis of ACS photometry, large green squares show the location of YSOs type II selected using IR Spitzer photometry, large blue dots represent the location of YSOs type I. Finally red circles (marked by HC1 to HC6) show the Herbig Ae/Be candidates by Hatano et al. (2006). -
•
OB candidate distribution has Q= 0.85. This indicates a diffuse population. Two main concentrations are found however, associated to HD 32228 (and in general to NGC 1761) and NGC 1763. In these objects, the positions of the concentration of OB stars are very close to the main concentration of PMS stars.
-
•
Inside N11 no significant difference is found in the clustering degree of brighter blue main sequence stars (F) and fainter red stars (F435W 20) which suggests that they are formed in the same process. A closer look reveals that the regions present a different behavior concerning the clustering degree as a function of magnitude (see Fig. 21). While in NGC 1763, LH 9 East and North bright stars are more concentrated, in NGC 1769 ad LH 9 South are quite dispersed. PMS fainter than F435W do not show any trend with regard to the magnitude.
-
•
Since young clusters are expected to evolve from hierarchical configurations to more concentrated ones (Schmeja et al., 2009), the fact that there is a range of structures with a scatter in Q may indicate that the objects are at different evolutionary stages.
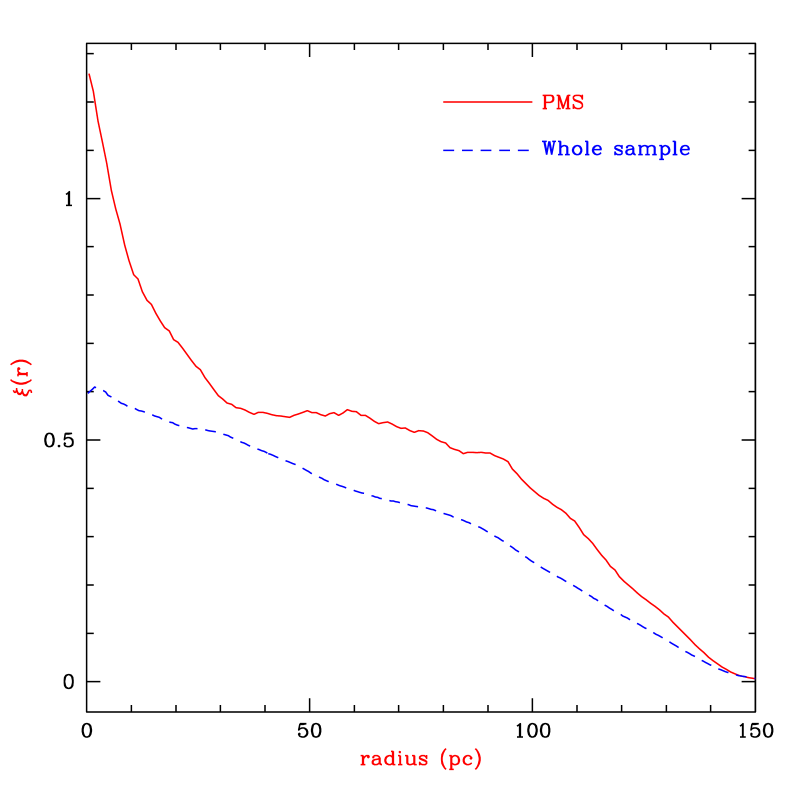
Figure 19: Two-point correlation function of the PMSs (solid line) and of the whole sample of stars (dashed line). 


Figure 20: The MST of the regions of NGC 1769,NGC 1763,NGC 1761, NGC 1760, HD 32228, BSDL 324, BSDL 270 and BCDSP 1 and for OB star candidates. -
•
Q is found to have no dependence on the age of the clusters, even if the oldest objects HD 32228 and in general LH 9 North have a slightly higher Q. It should be remembered that this comparison is complicated by the presence of a large age dispersion detected in the fields.
-
•
This is at odds with what we find in the star forming region in our Galaxy, where Q correlates with the age. Schmeja et al. (2009) find similar behavior in the region of NGC 346 in the SMC and suggest that this can be explained as the footprints of inhomogeneity in the original turbulent cloud. In fact Q is expected to depend on a variety of additional factors like the initial conditions or turbulent energy in the clouds.
-
•
The value of Q itself in the field population is rather low, around 0.67, meaning that the field still has substructures due to the original turbulent environment or showing the result of random motion configurations. The value we find is compatible with Q=0.7 derived by Bastian et al. (2009) as a reference value for the field of the LMC.
9 Conclusions
Young stars are well known to trigger star formation on a local scale by injecting energy in the surrounding interstellar medium. N 11 region in the LMC is often presented as one of the most promising candidates of a triggered star formation. In this paper we discussed the star formation process in N 11. We reported on the discovery of PMS and YSO candidates associated with N 11 from HST ACS/WFC photometry and archive Spitzer data. While HST observations can give information about faint, exposed pre-main sequence candidates, IR data allowed us to detect embedded young stellar objects. The main conclusions are as follows:
-
•
A large population of PMSs is found in this region. The comparison with the isochrones shows that PMSs have masses from 1.3 M⊙ to 2.0 M⊙, depending on their ages. YSOs (type I and II) having ages Myr are found at the same location as the PMSs.
-
•
The analysis of HST data implies that PMSs in LH 9 are slightly older than in the other regions of N 11. A prolonged star formation is detected in LH 9 South from 2 to 10 Myr. However, the majority of the stars are older than 6 Myr, while LH 9 North, LH 10(center) and LH 13 seem to be younger (having ages of 5, 2, 2 Myr respectively). A large age spread from 1 to 6 Myr is found from the spectroscopy of blue stars in these regions. Remarkably, the present age determinations of the PMSs agree (inside the errors) with the ages derived from literature spectroscopy of blue bright stars.
-
•
The presence of YSOs in LH 9 South, LH 13 (type I) and LH 9 (North), LH 10 (Type II) suggests that the star formation in the region is still going on. The most conspicuous concentrations of PMSs correspond to the location of OB stars. Concerning Herbig Ae/Be stars, they are found in all these locations, confirming the presence of a population with ages in the range of 13 Myr. All the indicators present a coherent picture of the star formation in the region.
-
•
PMSs present a higher degree of clustering in comparison with the whole star sample. The distribution of the nearest neighbor distance reflects the structure of the interstellar medium. The full width half maximum of the peak of the correlation function for PMSs is pc, which is the order of the typical size of molecular clouds in the SMC and LMC, which extends from about 10 to 100 pc.
-
•
In all the fields related to N11, the values of Q 0.8 are typical of the products of hierarchical star formation. Clusters are expected to evolve from hierarchical structures to more concentrated ones. Different clusters/associations show slightly different values of Q, suggesting that they might be in slightly different evolutionary stages. Inside N11, no significant difference is found in the clustering degree of brighter blue main sequence stars (F) and fainter red stars (F435W 20), suggesting that they might be part of the same formation process.
-
•
Q is found to have no dependence on the age of the clusters, even if the oldest objects HD 32228 and in general LH 9 North have a slightly higher Q. These results disagree with the behavior found in our Galaxy. These results are quite difficult to interpret. They can be explained as the footprints of inhomogeneity in the original turbulent cloud. It should be kept in mind that this comparison is complicated by the presence of a large age dispersion detected in the fields.
References
- Bastian et al. (2009) Bastian, N., Gieles, M., Ercolano, B., & Gutermuth, R. 2009, MNRAS, 392, 868
- Bica et al. (1999) Bica, E. L. D., Schmitt, H. R., Dutra, C. M., & Oliveira, H. L. 1999, AJ, 117, 238
- Bohlin (2007) Bohlin, R. C. 2007, ACS-ISR 07-06, 1
- Bonnell et al. (2004) Bonnell, I. A., Vine, S. G., & Bate, M. R. 2004, MNRAS, 349, 735
- Carrera et al. (2008) Carrera, R., Gallart, C., Hardy, E., Aparicio, A., & Zinn, R. 2008, AJ, 135, 836
- Cartwright & Whitworth (2004) Cartwright, A. & Whitworth, A. P. 2004, MNRAS, 348, 589
- Chiosi & Vallenari (2007) Chiosi, E. & Vallenari, A. 2007, A&A, 466, 165
- Chiosi et al. (2006a) Chiosi, E., Vallenari, A., Held, E. V., Rizzi, L., & Moretti, A. 2006a, A&A, 452, 179
- Chiosi et al. (2006b) —. 2006b, A&A, 452, 179
- Dib et al. (2007) Dib, S., Kim, J., Vázquez-Semadeni, E., Burkert, A., & Shadmehri, M. 2007, ApJ, 661, 262
- Dirsch et al. (2000) Dirsch, B., Richtler, T., Gieren, W. P., & Hilker, M. 2000, A&A, 360, 133
- Dolphin et al. (2001) Dolphin, A. E., Walker, A. R., Hodge, P. W., Mateo, M., Olszewski, E. W., Schommer, R. A., & Suntzeff, N. B. 2001, ApJ, 562, 303
- Duquennoy & Mayor (1991) Duquennoy, A. & Mayor, M. 1991, A&A, 248, 485
- Elmegreen (2000) Elmegreen, B. G. 2000, ApJ, 530, 277
- Girardi et al. (2002) Girardi, L., Bertelli, G., Bressan, A., Chiosi, C., Groenewegen, M. A. T., Marigo, P., Salasnich, B., & Weiss, A. 2002, A&A, 391, 195
- Gouliermis et al. (2006) Gouliermis, D., Brandner, W., & Henning, T. 2006, ApJ, 636, L133
- Gouliermis et al. (2007) Gouliermis, D. A., Henning, T., Brandner, W., Dolphin, A. E., Rosa, M., & Brandl, B. 2007, ApJ, 665, L27
- Harris & Zaritsky (2004) Harris, J. & Zaritsky, D. 2004, AJ, 127, 1531
- Hatano et al. (2006) Hatano, H., Kadowaki, R., Nakajima, Y., Tamura, M., Nagata, T., Sugitani, K., Tanabé, T., Kato, D., Kurita, M., Nishiyama, S., Baba, D., Ishihara, A., & Sato, S. 2006, AJ, 132, 2653
- Haymond et al. (1984) Haymond, R. E., Jarvis, J., & Shier, D. R. 1984, ACM-Trans. Math. Software, 10, 108
- Heydari-Malayeri et al. (2000) Heydari-Malayeri, M., Royer, P., Rauw, G., & Walborn, N. R. 2000, A&A, 361, 877
- Hillenbrand (2009) Hillenbrand, L. A. 2009, in IAU Symposium, Vol. 258, IAU Symposium, ed. E. E. Mamajek, D. R. Soderblom, & R. F. G. Wyse, 81–94
- Hillenbrand et al. (2008) Hillenbrand, L. A., Bauermeister, A., & White, R. J. 2008, in Astronomical Society of the Pacific Conference Series, Vol. 384, 14th Cambridge Workshop on Cool Stars, Stellar Systems, and the Sun, ed. G. van Belle, 200–+
- Indebetouw et al. (2007) Indebetouw, R., Robitaille, T. P., Whitney, B. A., Churchwell, E., Babler, B., Meade, M., Watson, C., & Wolfire, M. 2007, ApJ, 666, 321
- Israel et al. (2003) Israel, F. P., de Graauw, T., Johansson, L. E. B., Booth, R. S., Boulanger, F., Garay, G., Kutner, M. L., Lequeux, J., Nyman, L.-A., & Rubio, M. 2003, A&A, 401, 99
- Javiel et al. (2005) Javiel, S. C., Santiago, B. X., & Kerber, L. O. 2005, A&A, 431, 73
- Keller & Wood (2006) Keller, S. C. & Wood, P. R. 2006, ApJ, 642, 834
- Klessen (2003) Klessen, R. S. 2003, in IAU Symposium, Vol. 208, Astrophysical Supercomputing using Particle Simulations, ed. J. Makino & P. Hut, 61–+
- Krumholz et al. (2007) Krumholz, M. R., Klein, R. I., & McKee, C. F. 2007, ApJ, 665, 478
- Krumholz et al. (2005) Krumholz, M. R., McKee, C. F., & Klein, R. I. 2005, Nature, 438, 332
- Lada (1987) Lada, C. J. 1987, in IAU Symposium, Vol. 115, Star Forming Regions, ed. M. Peimbert & J. Jugaku, 1–17
- Larson (2003) Larson, R. B. 2003, in Astronomical Society of the Pacific Conference Series, Vol. 287, Galactic Star Formation Across the Stellar Mass Spectrum, ed. J. M. De Buizer & N. S. van der Bliek, 65–80
- Li & Smith (2005) Li, J. Z. & Smith, M. 2005, AJ, 130, 721
- McKee & Tan (2003) McKee, C. F. & Tan, J. C. 2003, ApJ, 585, 850
- Meixner et al. (2007) Meixner, M., Gordon, K., Indebetouw, R., Whitney, B., Meade, M., Babler, B., Hora, J., Vijh, U., Srinivasan, S., Leitherer, C., Sewilo, M., Engelbracht, C., Block, M., For, B., Blum, R., Reach, W., Bernard, J.-P., & The SAGE Team. 2007, in IAU Symposium, Vol. 241, IAU Symposium, 363–364
- Meixner et al. (2006) Meixner, M., Gordon, K. D., Indebetouw, R., Hora, J. L., Whitney, B., Blum, R., Reach, W., Bernard, J.-P., Meade, M., Babler, B., Engelbracht, C. W., For, B.-Q., Misselt, K., Vijh, U., Leitherer, C., Cohen, M., Churchwell, E. B., Boulanger, F., Frogel, J. A., Fukui, Y., Gallagher, J., Gorjian, V., Harris, J., Kelly, D., Kawamura, A., Kim, S., Latter, W. B., Madden, S., Markwick-Kemper, C., Mizuno, A., Mizuno, N., Mould, J., Nota, A., Oey, M. S., Olsen, K., Onishi, T., Paladini, R., Panagia, N., Perez-Gonzalez, P., Shibai, H., Sato, S., Smith, L., Staveley-Smith, L., Tielens, A. G. G. M., Ueta, T., Dyk, S. V., Volk, K., Werner, M., & Zaritsky, D. 2006, AJ, 132, 2268
- Mokiem et al. (2007) Mokiem, M. R., de Koter, A., Evans, C. J., Puls, J., Smartt, S. J., Crowther, P. A., Herrero, A., Langer, N., Lennon, D. J., Najarro, F., Villamariz, M. R., & Vink, J. S. 2007, A&A, 465, 1003
- Padoan & Nordlund (2002) Padoan, P. & Nordlund, Å. 2002, ApJ, 576, 870
- Pagel & Tautvaišienė (1999) Pagel, B. E. J. & Tautvaišienė, G. 1999, Ap&SS, 265, 461
- Parker et al. (1992) Parker, J. W., Garmany, C. D., Massey, P., & Walborn, N. R. 1992, AJ, 103, 1205
- Peebles (1980) Peebles, P. J. E. 1980, The large-scale structure of the universe (Research supported by the National Science Foundation. Princeton, N.J., Princeton University Press, 1980. 435 p.)
- Prim (1957) Prim, R. C. 1957, Bell System Tech. J., 36, 1389
- Rizzi et al. (2002) Rizzi, L., Held, E. V., Bertelli, G., Nasi, E., Saviane, I., & Vallenari, A. 2002, in Astronomical Society of the Pacific Conference Series, Vol. 274, Observed HR Diagrams and Stellar Evolution, ed. T. Lejeune & J. Fernandes, 490–+
- Robitaille et al. (2006) Robitaille, T. P., Whitney, B. A., Indebetouw, R., Wood, K., & Denzmore, P. 2006, ApJS, 167, 256
- Rosado et al. (1996) Rosado, M., Laval, A., Le Coarer, E., Georgelin, Y. P., Amram, P., Marcelin, M., Goldes, G., & Gach, J. L. 1996, A&A, 308, 588
- Sasao (1973) Sasao, T. 1973, PASJ, 25, 1
- Schmeja et al. (2009) Schmeja, S., Gouliermis, D. A., & Klessen, R. S. 2009, ApJ, 694, 367
- Schmeja & Klessen (2006) Schmeja, S. & Klessen, R. S. 2006, A&A, 449, 151
- Siess et al. (2000) Siess, L., Dufour, E., & Forestini, M. 2000, A&A, 358, 593
- Sirianni et al. (2005) Sirianni, M., Jee, M. J., Benítez, N., Blakeslee, J. P., Martel, A. R., Meurer, G., Clampin, M., De Marchi, G., Ford, H. C., Gilliland, R., Hartig, G. F., Illingworth, G. D., Mack, J., & McCann, W. J. 2005, PASP, 117, 1049
- Stetson (1994) Stetson, P. B. 1994, in The Restoration of HST Images and Spectra - II, ed. R. J. Hanisch & R. L. White, 308
- Walborn & Parker (1992) Walborn, N. R. & Parker, J. W. 1992, ApJ, 399, L87
- Whitney et al. (2004) Whitney, B. A., Indebetouw, R., Bjorkman, J. E., & Wood, K. 2004, ApJ, 617, 1177