Evidence for strong effect of quenched correlated disorder on phase separation and magnetism in
Abstract
High resolution neutron diffraction shows that the mesoscopic separation into ferromagnetic (FM) and antiferromagnetic (AFM) phases and the FM transition temperature in the perovskite manganite strongly depend on the quenched correlated disorder. The different disorder strengths are achieved by different procedures of the sample synthesis and quantitatively characterized by the micro-strain-type diffraction peak broadening. The system shifts to predominantly one phase state with smaller as the correlated disorder strength is decreased supporting the viewpoint that the origin of phase separation in the indicated manganite system is the correlated quenched disorder. The ground state of an ultimately chemically homogeneous sample is FM-like containing about 20% of the AFM minority phase. This FM-like state can be readily transformed to the AFM-like one having % of FM-phase by the decreasing of the effective charge carrier bandwidth via oxygen isotope substitution.
pacs:
75.47.Gk, 61.12.Ld, 75.30.-m,I Introduction
The presence of the long scale percolate phase separation in the colossal magnetoresistance (CMR) manganese oxides (A is rare earth element, A′ is Ca, Sr, Ba) has been attracting special experimental and theoretical attention for long time. There are two main concepts of the mesoscopically inhomogeneous state in the manganites. One standpoint is that the intrinsic quenched disorder enhances the fluctuations of the competing orders near the original bi-critical pointBurgy et al. (2001, 2004); Alonso et al. (2002); Blake et al. (2002); Akahoshi et al. (2003); De Teresa et al. (2005); Pomjakushin et al. (2007). The theoretical calculations in random field Ising model with quenched correlated disorder Burgy et al. (2001, 2004) show generation of mesoscopically large clusters of both phases. In another approach, the lattice distortions and the long-range strainLittlewood (1999); Ahn et al. (2004); Podzorov et al. (2001); Sharma et al. (2005) are the dominant factors controlling the phase separation. The self-organized multiphase coexistence originates purely from lattice degrees of freedom and is caused by the presence of an intrinsic elastic energy landscape according to the computer simulations Ahn et al. (2004). There are also suggestions that the intrinsic quenched disorder and lattice distortions are interrelated in the Mn-substituted half doped manganites with low level (1-5%) of Mn-substitution Yaicle et al. (2005, 2006); Frontera et al. (2008).
The experimental discrimination of the two models is difficult and usually based on a concomitant effects. In this paper we give direct evidences in favor of the disorder model by showing that the phase separation is strongly dependent on the strength of quenched correlated disorder, that can be quantitatively characterized by a micro-strain diffraction peak broadening parameter.
The low bandwidth manganite family (LPCM hereafter) has the fixed optimal hole doping and variable A-cation radius that is linearly connected with the Pr-concentration . The principal effect of decreasing is a decrease in Mn-O-Mn bond angle, which leads to the decrease in the electron transfer integral between the Mn-ions. The metal-insulator boundary lays at the Pr-concentration between and Hwang et al. (1995); Babushkina et al. (1999). The ground magnetic state in the metallic part of the phase diagram is an incoherent mixture of ferromagnetic metallic FMM and antiferromagnetic insulating AFI mesoscopically large regions.Pomjakushin et al. (2007) There are two factors controlling the proportion between FMM and AFMI phases. The first one is the effective charge carrier bandwidth that is decreased as the Mn-O-Mn bond angle is decreased. Due to the strong electron-phonon coupling mediated by the Jahn-Teller effect is also significantly decreased by the increase in the oxygen mass from to , thus shifting the system also towards insulating state.Pomjakushin et al. (2007) The second factor that controls the phase separation is quenched disorder, which modifies the electron transfer integral only locally, but can give rise to the mesoscopically inhomogeneous state in according to the model calculations.Burgy et al. (2001, 2004)
The quenched disorder in the LPCM-system is naturally present due to the dispersion of the A-cation radius, i.e. even an ideally homogeneous statistical distribution of the cations over the crystallographic A-position can result in the phase separated state. It is important to note that according to elasticity theory, any point defect will create the displacements of neighboring atoms decaying as as a function of distance creating a correlated disorder region. In real crystals the disorder will be larger due to the presence of different kinds of crystal defects like dislocations, vacancies or composition variance. The defects are classified by their effect on the diffraction peak intensity and widthKrivoglaz (1996): defects of the first type do not change the diffraction peak widths, but affect their intensity similar as atomic displacement parameter (ADP) does and shift the peak positions. The second type defects give rise to the peak broadening. Any finite defect is the first type defect and will effect only on the integrated peak intensities. To get the line broadening from the finite defects in 3D crystal the displacements of neighboring atoms has to decrease at lower rate than . Any solid solution independently on the partial atomic concentrations will give narrow diffraction peaks.Krivoglaz (1996) Thus, in case of an ideal homogeneous statistical distribution of the A-cations one expects to have an increase in the ADP and narrow resolution limited Bragg peak widths. Large scale defect, such as dislocation, is the second type defect and will create the broadening of the diffraction lines. Possibly some clusterizations of particular A-cations can act as the second type defects. In a powder diffraction experiment additional broadening can occur also for the first type defects due to the fluctuation of the defect concentration. For the homogeneous solid solutions this broadening is negligibly small but will have noticeable value in the presence of new phase particles.Krivoglaz (1996) In our case the clusterization of particular A-cations can play the role of the ”new phase particle”. We have prepared three types of samples with different correlated quenched disorder strength that was quantitatively characterized by micro-strain type line broadening and have studied the phase separation effect and magnetism as a function of the disorder.
II Samples. Experimental
The samples of with y=0.8 have been synthesized by a solid state reaction using , , and . The samples, which are denoted as o-samples, were calcined at temperatures 1000-1300oC for 100h with 3 intermediate grindings. The final - and -samples were obtained via respective oxygen isotope exchange in closed quartz tubes in parallel under the controlled gas pressure slightly above 1 bar at 1000oC during 40h. Second type is t-sample that has been additionally sintered at higher temperature 1500oC during 40h. To further increase chemical homogeneity we applied a procedure similar to the one described in Ref. Collado et al., 2003 to synthesize the samples that we call m-samples. Stoichiometric amounts of the starting materials (15 g) were mixed in agate mortar and calcinated at 950oC for 12 h (as for standard o-samples). At the next step preliminarily powderized sample was placed in Fritsch planetary mill (Pulverisette 5, agate balls and grinding bowl) and 15 ml isopropanol was added as homogenizing liquid. The sample was milled totally 4 h at 100 rpm with changing the spinning direction every hour. The obtained suspension was dried at 100 oC and then annealed at 950oC for 20 h. The sample was milled in the Fritsch mill at the same conditions as at the previous step, dried, pressed into the pellets and annealed at 1450oC for 15 h . Finally the pellets were grounded in agate mortar, pelletized and sintered 1500 oC for 12 h.
The chemical homogeneity or composition variance in the solid state synthesis method is expected to be better if the Fritsch planetary mill is used because the minimal comminuted particle sizes are 0.1m that is significantly smaller than 5-10m if grounded in a standard agate mortar. The higher sintering temperature is also expected to be a factor improving the homogeneity due to higher diffusion coefficient.
The -samples had 80% of -isotope, measured by the weight gain after the oxygen exchange. The control weighing of the -sample gave the same mass within accuracy %. The mass of each sample was about 2 g. The oxygen content in all the samples was determined by the thermogravimetric hydrogen reductionConder et al. (2002) and amounted to 3.003(5). The magnetic susceptibility was measured in zero external field with amplitude of the field 10 Oe and frequency 1 kHz using Quantum Design PPMS station. Neutron powder diffraction experiments were carried out at the SINQ spallation source of Paul Scherrer Institute (Switzerland) using the high-resolution diffractometer for thermal neutrons HRPTFischer et al. (2000a) ( Å, high intensity mode ), and the DMC diffractometer Fischer et al. (2000b) situated at a supermirror coated guide for cold neutrons at SINQ ( Å). All the temperature scans were carried out on heating. The refinements of the crystal and magnetic structure parameters were carried out with FULLPROF Rodriguez-Carvajal (1993) program, with the use of its internal tables for scattering lengths and magnetic form factors.
III Results and discussion
| Sample | , K | , K | |||
|---|---|---|---|---|---|
| 80-o | 26(2) | 120(2) | 23(2) | 1.65(2) | 3.03(2) |
| 80-t | 22(3) | 106(1) | 11(2) | 1.01(5) | 3.21(4) |
| 80-m | 7.0(1.8) | 90.4(4) | 3.2(4) | 0.93(3) | 3.40(2) |
| 80-m18 | 8.8(1.4) | 85(2) | 3.3(4) | 2.05(2) | 1.47(3) |
| 20-o | 26(2) | 240.3(1) | 0 | 0.15(2) | 3.57(2) |
| 20-t | 12(3) | 223(1) | 0 | - | 3.49(5) |
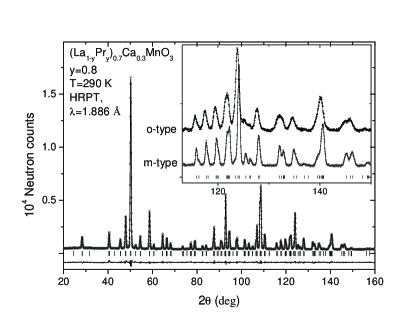
The crystal structure at all temperatures is well refined in single phase in space group with the standard for these compounds model.Balagurov et al. (2001a) An example of the Rietveld refinement pattern and difference plot of the neutron diffraction is shown in Fig. 1. The structure disorder can be characterized by atomic displacement parameters (ADP) and microstrain type line broadening. We indeed observe large ADP Å2 for A-cation, Mn and oxygen atoms, respectively in (y=0.8). The -values are more than two times larger than in a ”defect free” isostructural that has Å2, respectively.Rodriguez-Carvajal et al. (1998) Both and LPCM compounds have the same Jahn-Teller-type (JT) transition at high temperature ( 800K) from pseudo-cubic to the antiferrodistortive orbital ordered state with completely filled -type orbital at room temperature Pomjakushin et al. (2007). The enhanced ADP are naturally expected due to the distribution of the cations with significantly different atomic radii over the A-positions and the presence of 30% of non-JT active manganese ions that also act as the defects. In all three types of samples with y=0.8 the ADP values are the same within experimental errorbars implying that the point-like quenched disorder does not depend on the sample type. The parameter characterizing the correlated quenched disorder is the microstrain-type line broadening parameter that has been determined from the refinement of the diffraction patterns as described in Ref. Pomjakushin et al., 2007. The refined values of are shown in Table 1. For all samples, the apparent crystalline sizes are refined to the values larger than Å with the errorbars of the same order of magnitude giving only a small contribution to the line broadining (assuming increases the refined micro-strain values by less than 10%). One can see that the additional thermal treatment (t-samples) slightly decreases the micro-strain, whereas the use of the planetary mill for the m-samples drastically decreases down to that is illustrated by the inset of Fig. 1. M-samples have probably an ultimate chemical homogeneity because the microstrain is close to the one expected from the twin tension due to the high temperature pseudocubic-orthorhombic structure transition.Pomjakushin et al. (2007) T- and o-samples can have some clusterization of the La/Ca/Pr atoms because in the solid state synthesis the high temperature reaction takes place between small solid pieces of the comminuted materials.
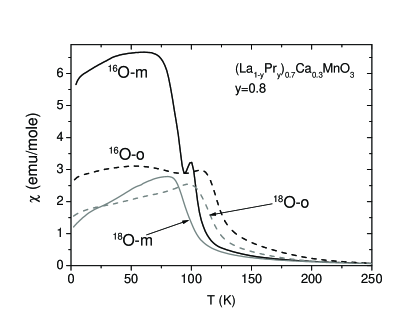
The ac-magnetic susceptibility as a function of temperature for both o- and m-samples is shown in Fig. 2. One can see that dependence in the milled m-sample possesses quite sharp feature around 100 K and significantly larger absolute values of . The reason for the different behaviors of m- and o-samples is the different proportion between FM- and AFM-fraction as we show below. An important consequence of this “sample effect” for the manganite physics is that the temperature dependences of various macroscopic quantities such as magnetic susceptibility or electrical resistivity will not be reproducible in different experimental works if the quenched correlated disorder is not controlled. Hence, different experimental data cannot be easily compared with each other and compared with the theory predictions. Note that all structure parameters of o- and m-samples (e.g. bond lengths and angles) are the same within the errorbars. A similar observation was reported for the charge ordered , where the microstrain and phase separation onto FM and AFM phases below 150 K depended on the sample preparation procedure.Woodward et al. (1999)
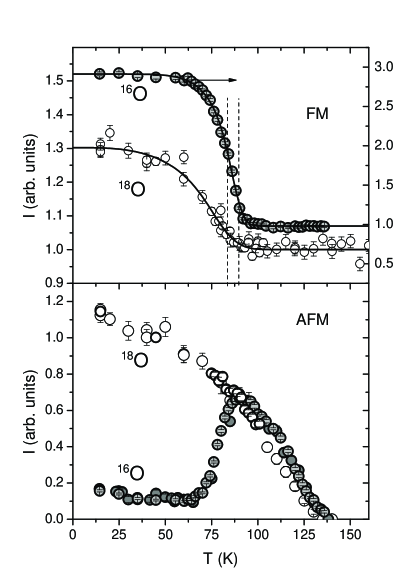
The magnetic phase separated state consists of the AFM pseudo-CE phase with Mn-spin directed along and FM phase with Mn-spin in -plane similar to the one reported in Ref. Balagurov et al., 2001b. The FM transition temperatures (Table 1) were determined from the magnetic Bragg peak intensities (Fig. 3) by the fit procedure described in Ref. Pomjakushin et al., 2007. One can see that the transition temperatures and the transition width are decreased as the microstrain is decreased. The counterintuitive decrease in however finds its explanation in the 3d-correlated disorder double exchange model.Bouzerar and Cepas (2007) The calculations show that at hole densities lower than where the couplings are strongly inhomogeneous, in the inhomogeneous system is larger than in the homogeneous one.Bouzerar and Cepas (2007) In case of uncorrelated Anderson disorder the effect would be opposite, i.e. the inhomogeneous system would have lower transition temperature. To further prove this effect we have additionally prepared and studied (y=0.2) t-sample that is located in the ferromagnetic metallic part of the phase diagram.Pomjakushin et al. (2007) We have found that it shows essentially the same behavior (Table 1) - after the additional annealing of the t-sample the transition temperature is decreased together with the microstrain .
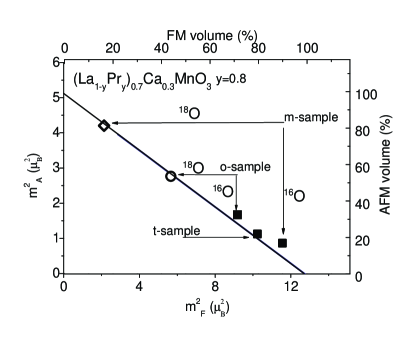
Figure 4 shows the fractions of the FM- and AFM-phases in the samples of calculated from the effective moments from Table 1. The straight line is taken from Ref. Pomjakushin et al., 2007 and represents a fit to the experimental effective moments for the whole series of o-samples with . One can see that the -samples gradually move along this straight line towards the FM-state as the strength of the disorder is decreased (from o- to t- and to m-sample). This shows that the stronger the correlated disorder the larger the separation into FM and AFM phases. An additional evidence comes from the effect of oxygen isotope substitution also shown in the Fig. 4. A decrease in the effective bandwidth in the -samples shifts the phase balance toward the AFM-state, as expected. But in addition, the low defect m-sample displays much larger AF-fraction in comparison with the o-samples, i.e. again the sample with minimal correlated disorder tends to be in single phase state. However, even the ultimately chemically homogeneous m-samples still contain 10-20% of the minority phase justifying that the mesoscopically inhomogeneous magnetic state is an intrinsic property of .
One could suggest that the single crystals might be the most suitable candidates with the best homogeneity to verify further the effects of correlated quenched disorder. Due to the high melting temperatures of LPCM a reasonably large crystal can be grown only by traveling solvent floating zone technique (TSFZ). A single crystal of (y=0.7) grown by TSFZ has been studied by magneto-optical imaging technique Tokunaga et al. (2004). Figure 4 of the above reference nicely shows the presence of mesoscopic phase separation onto FM and AFM phases at T=34 K. From this figure, one could estimate that the fraction of the AFM phase is more than 20%. Thus the phase separation is even more pronounced than in the ultimately homogenous powder m-samples implying that the defect concentration in the crystal is not smaller. It is known that the crystals grown by the TSFZ or similar technique from melt can be inhomogeneous and contain many defects mainly due to large temperature gradients West (2003). The polycrystalline materials that are sintered at high temperatures and slowly cooled down might have less defects than the single crystals grown by TSFZ, provided that the pulverized particle sizes are small enough.
IV Conclusions
We have studied the effect of correlated quenched disorder on the phase separation in perovskite manganese oxide . The different disorder strengths were achieved by different procedures of the sample synthesis and quantitatively characterized by the micro-strain-type diffraction peak broadening. We have found that the decreasing of the correlated disorder pushes the system to predominantly one phase and decreases ferromagnetic Curie temperature in accordance with the theory predictions.Burgy et al. (2004); Bouzerar and Cepas (2007) The ground state of an ultimately chemically homogeneous sample (i.e. with statistical distribution of La/Pr/Ca cations over A-position) is still phase separated one but with the dominant magnetic phase occupying % of the volume. The dominant phase is the ferromagnetic one for the sample with natural oxygen, but it can be readily transformed to the antiferromagnetic phase by the decreasing of the effective charge carrier bandwidth via /-oxygen isotope substitution.
An important consequence of the effect of the correlated disorder for the manganite physics is that the temperature dependences of various macroscopic quantities such as magnetic susceptibility or electrical resistivity will not be reproducible in different experimental works and cannot be correctly compared with the theory predictions if the correlated quenched disorder strength is not controlled.
Acknowledgements
This study was performed at Swiss neutron spallation source SINQ of Paul Scherrer Institute PSI (Villigen, PSI). Financial support by the NCCR MaNEP project is gratefully acknowledged.
References
- Burgy et al. (2001) J. Burgy, M. Mayr, V. Martin-Mayor, A. Moreo, and E. Dagotto, Phys. Rev. Lett. 87, 277202 (2001).
- Burgy et al. (2004) J. Burgy, A. Moreo, and E. Dagotto, Phys. Rev. Lett. 92, 097202 (2004).
- Alonso et al. (2002) J. L. Alonso, L. A. Fernandez, F. Guinea, V. Laliena, and V. Martin-Mayor, Phys. Rev. B 66, 104430 (2002).
- Blake et al. (2002) G. R. Blake, L. Chapon, P. G. Radaelli, D. N. Argyriou, M. J. Gutmann, and J. F. Mitchell, Phys. Rev. B 66, 144412 (2002).
- Akahoshi et al. (2003) D. Akahoshi, M. Uchida, Y. Tomioka, T. Arima, Y. Matsui, and Y. Tokura, Phys. Rev. Lett. 90, 177203 (2003).
- De Teresa et al. (2005) J. M. De Teresa, P. A. Algarabel, C. Ritter, J. Blasco, M. R. Ibarra, L. Morellon, J. I. Espeso, and J. C. Gómez-Sal, Phys. Rev. Lett. 94, 207205 (2005).
- Pomjakushin et al. (2007) V. Y. Pomjakushin, D. V. Sheptyakov, K. Conder, E. V. Pomjakushina, and A. M. Balagurov, Phys. Rev. B 75, 054410 (2007).
- Littlewood (1999) P. Littlewood, Nature 399, 529 (1999).
- Ahn et al. (2004) K. H. Ahn, T. Lookman, and A. R. Bishop, Nature (London) 428, 401 (2004).
- Podzorov et al. (2001) V. Podzorov, B. G. Kim, V. Kiryukhin, M. E. Gershenson, and S. W. Cheong, Phys. Rev. B 64, 140406(R) (2001).
- Sharma et al. (2005) P. A. Sharma, S. B. Kim, T. Y. Koo, S. Guha, and S. W. Cheong, Phys. Rev. B 71, 224416 (2005).
- Yaicle et al. (2006) C. Yaicle, C. Frontera, J. L. Garcia-Munoz, C. Martin, A. Maignan, G. Andre, F. Bouree, C. Ritter, and I. Margiolaki, Phys. Rev. B 74, 144406 (2006).
- Yaicle et al. (2005) C. Yaicle, F. Fauth, C. Martin, R. Retoux, Z. Jirak, M. Hervieu, B. Raveau, and A. Maignan, J. Solid State Comm. 178, 1652 (2005).
- Frontera et al. (2008) C. Frontera, J. L. Garcia-Munoz, P. Beran, N. Bellido, I. Margiolaki, and C. Ritter, Chem. Mater. 20, 3068 (2008).
- Hwang et al. (1995) H. Y. Hwang, S. W. Cheong, P. G. Radaelli, M. Marezio, and B. Batlogg, Phys. Rev. Lett. 75, 914 (1995).
- Babushkina et al. (1999) N. A. Babushkina, L. M. Belova, A. N. Taldenkov, E. A. Chistotina, D. I. Khomskii, K. I. Kugel, O. Y. Gorbenko, and A. R. Kaul, J. Phys.-Cond. Matt 11, 5865 (1999).
- Krivoglaz (1996) M. A. Krivoglaz, X-Ray and Neutron Diffraction in Nonideal Crystals (Springer-Verlag, 1996).
- Collado et al. (2003) J. Collado, C. Frontera, J. Garcia-Munoz, C. Ritter, M. Brunelli, and M. Aranda, Chem. Mater. 15, 167 (2003).
- Conder et al. (2002) K. Conder, G. M. Zhao, and R. Khasanov, Phys. Rev. B 66, 212409 (2002).
- Fischer et al. (2000a) P. Fischer, G. Frey, M. Koch, M. Koennecke, V. Pomjakushin, J. Schefer, R. Thut, N. Schlumpf, R. Buerge, U. Greuter, et al., Physica B 276-278, 146 (2000a).
- Fischer et al. (2000b) P. Fischer, L. Keller, J. Schefer, and J. Kohlbrecher, Neutron News 11, 19 (2000b).
- Rodriguez-Carvajal (1993) J. Rodriguez-Carvajal, Physica B 192, 55 (1993); http://www.ill.eu/sites/fullprof/.
- Balagurov et al. (2001a) A. M. Balagurov, V. Y. Pomjakushin, D. V. Sheptyakov, V. L. Aksenov, N. A. Babushkina, L. M. Belova, O. Y. Gorbenko, and A. R. Kaul, Eur. Phys. J. B 19, 215 (2001a).
- Rodriguez-Carvajal et al. (1998) J. Rodriguez-Carvajal, M. Hennion, F. Moussa, A. H. Moudden, L. Pinsard, and A. Revcolevschi, Phys. Rev. B 57, R3189 (1998).
- Woodward et al. (1999) P. Woodward, D. Cox, T. Vogt, C. Rao, and A. Cheetham, Chem. Mater. 11, 3528 (1999).
- Balagurov et al. (2001b) A. M. Balagurov, V. Y. Pomjakushin, D. V. Sheptyakov, V. L. Aksenov, P. Fischer, L. Keller, O. Y. Gorbenko, A. R. Kaul, and N. A. Babushkina, Phys. Rev. B 64, 024420 (2001b).
- Bouzerar and Cepas (2007) G. Bouzerar and O. Cepas, Phys. Rev. B 76, 020401(R) (2007).
- Tokunaga et al. (2004) M. Tokunaga, Y. Tokunaga, and T. Tamegai, Phys. Rev. Lett. 93, 037203 (2004).
- West (2003) A. R. West, Solid state chemistry and its applications (John Wiley & Sons, 2003).