Evidence for multiple superconducting gaps in optimally doped BaFe1.87Co0.13As2 from infrared spectroscopy
Abstract
We performed combined infrared reflection and ellipsometry measurements of the in-plane optical response of single crystals of the pnictide high temperature superconductor BaFe1.87Co0.13As2 with = 24.5 K. Our experimental data provide evidence for multiple superconducting energy gaps and can be well described in terms of three isotropic gaps with 2 of 3.1, 4.7, and 9.2. The obtained low-temperature value of the in-plane magnetic penetration depth is 270 nm.
pacs:
74.70.-b,78.30.-j,74.25.GzThe origin of the recently discovered high temperature superconductivity (HTSC) in the pnictides is a subject of great interest.Kamihara08 In the pnictides, it has been predicted that up to five bands are crossing the Fermi-level and thus can participate in superconducting (SC) state.Haule08 Therefore they are likely multi-band superconductors where the magnitude of the energy gaps and even the sign of the order parameters can vary between different bands.PRL-Kuroki ; PRB-Bang ; PRB-Dolgov Despite of the tremendous research efforts, there is an ongoing debate about the basic superconducting properties, such as the number of energy gaps and their magnitudes, which are prerequisites for determining the order parameter symmetry and ultimately the HTSC pairing mechanism.Node ; PRB-Bang ; PRL-Kuroki ; ARPES-el ; ARPES-hole ; Specific heat ; muSR ; NMR-1 ; NMR-2 ; point contact ; Wang-SC Experimental evidence for at least two different gaps has already been reported from angle-resolved photoemission (ARPES), point contact spectroscopy, nuclear magnetic resonance, and muon spin rotation (SR).ARPES-el ; ARPES-hole ; Specific heat ; muSR ; NMR-1 ; NMR-2 ; point contact However, the reported gap values exhibit a large variation from 2 1.6 to 10 that remains to be understood. Possible factors are: a variation between the different compounds and as a function of doping and structural changes, a strong dependence on the sample (surface) quality, or the presence of even more than two gaps which the various experimental techniques are probing with different sensitivity. More detailed and accurate measurements of the properties of the SC energy gap(s) are thus required.
Infrared (IR) spectroscopy is a powerful technique to investigate the electronic gap structure of superconductors. While it does not provide -space resolved information such as ARPES, its large probe depth ensures the bulk nature of the measured quantities and its high energy resolution and powerful sum rules enable a reliable determination of important physical parameters, such as the gap magnitude and the plasma frequency of the SC condensate. In the parent compound of the Ba 122 phase,(Ba,Sr)Fe2As2, the IR data revealed the spin density wave gap(s) and related phonon anomalies.Wang-undoped ; phonon-Homes ; Dressel For the SC single crystals the first report of the gap feature has been published for hole doped Ba1-xKxFe2As2 with = 37 K.Wang-SC In addition to a steep absorption edge at 150 cm-1 that is characteristic of a nearly isotropic (nodeless) gap with 2 6, they also found evidence for a gap with 2 8. A similar upper value of 2 8 has been obtained from an ellipsometry study on polycrystalline (Nd,Sm)FeAsO1-xFx.Dubroka Recent studies on electron doped BaFe2-xCoxAs2 single crystals Heumen09 ; Wu09 ; Gorshunov10 also reported pronounced gap edges around 30 - 50 cm -1. These reports still vary concerning the number and the magnitude of the SC energy gaps and of the residual low-frequency conductivity.
In the following we present a detailed IR spectroscopy study of electron doped BaFe1.87Co0.13As2 single crystals with = 24.5K. Our spectra reveal several SC-induced features which yield further insight into the multigap nature of SC. In particular, we show that a BCS-type model with three isotropic energy gaps with 2 3.1, 4.7, and 9.2 describes the data rather well.
The BaFe1.87Co0.13As2 single crystals were grown from self-flux in glassy carbon crucibles and their chemical composition was determined by energy dispersive x-ray spectroscopy as described in Ref. 9. A bulk SC transition of 24.5 K was confirmed by transport, dc magnetization, and SR measurements.
The optical measurements were performed on freshly cleaved pieces from a single growth batch. The temperature () dependent near normal incidence reflectivity spectra, , for 35-5000 cm-1 were measured with a Bruker 113v FT-IR spectrometer utilizing the in situ gold evaporation technique.gold-evaporation Additional ellipsometry measurements were performed at 350-8000 cm-1 with a home built rotating-analyzer ellipsometer attached to a Bruker 113v (Ref. 23) and at 6000 - 52000 cm-1 with a commercial Woollam VASE ellipsometer. All measurements were performed at least twice to ensure their reproducibility. The ellipsometry data were converted to normal incidence reflectivity data. The complex optical constants were then calculated by Kramers-Kronig transformation with proper extrapolations such that the directly measured ellipsometric data were reproduced.
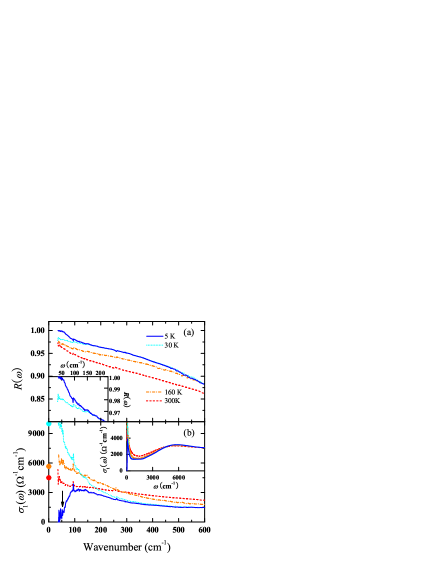
Figure 1(a) shows the reflectivity, , in the far-infrared (FIR) region at selected temperatures. The real part of the optical conductivity, , is displayed in Fig. 1(b). The overall shape and - dependence of the spectra are similar to previous reports.Wang-SC ; Qazilbash ; Heumen09 ; Wu09 ; Gorshunov10 ; Perucchi10 In particular, the spectra contain a pronounced Drude-peak at low frequency due to free carriers, which narrows significantly as decreases in the normal state. The extrapolated dc values, , compare well with published transport data (solid circles).Alloul-transport The electronic response contains at least two more broad bands in the mid-infrared (MIR) range that likely arise from interband transitions.Wang-SC ; Qazilbash In addition, our data contain two sharp features at 95 and 261 cm-1 which correspond to IR-active phonons. In the SC state at , the electronic response undergoes some characteristic changes below about 300 cm-1 which provide detailed information about the SC energy gap(s) and the SC condensate.
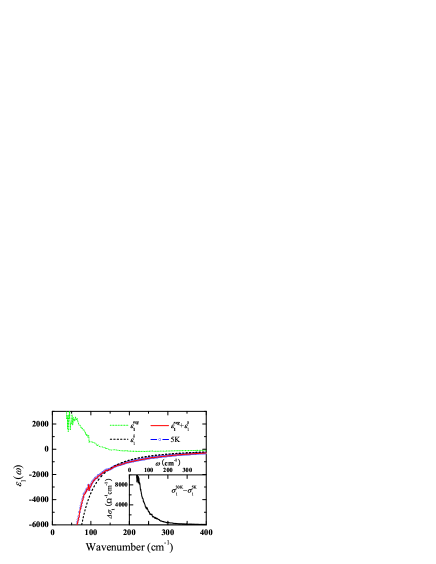
First we discuss the determination of the plasma frequency of the SC condensate, , which is detailed in Fig. 2. The inset shows the SC-induced decrease in the regular part of the conductivity, =-, from which we obtain the missing spectral weight, . Its magnitude falls off steeply with increasing frequency and essentially vanishes above 500 cm-1 (see the inset of Fig. 2). According to the so-called Ferell-Glover-Tinkham sum rule, is redistributed to a delta function at the origin which accounts for response of the SC condensate.Book-Tinkham The analysis, using a low-frequency extrapolation of the 30 K spectrum of = 10000 cm-1 as reported in Ref. 26, yields 9.1 cm-2 corresponding to 5900 cm-1 and a value of the magnetic penetration depth of 270 nm. This agrees reasonably well with 230 nm as obtained from SR measurements on optimally doped BaFe1-xCoxAs2.Bernhard-NJP ; unpublished The self consistency of this analysis has been checked by inspecting the corresponding changes in the real part of the dielectric function, . Figure 2 shows the comparison between the measured (symbols) and the corresponding spectrum (solid line) that is expected based on the SC-induced spectral weight redistribution and, in particular, the low frequency extrapolation that was used to obtain . Specifically, from ) we subtracted the missing contribution of the regular response due to =- to obtain (dotted line) and added the contribution (dashed line) due to the SC delta function. The excellent agreement between the symbols and the solid line confirms that we performed a reasonable low-frequency extrapolation of .
Next we show that valuable information about the SC energy gaps can be obtained from the SC-induced changes in and . First, we note that the pronounced gap edge around 50 cm-1 is the hallmark of an (almost) isotropic energy gap whose magnitude does not far exceed the normal state scattering rate, . In that case exhibits a pronounced feature at 2 where it increases sharply from zero at to a maximum around 4, before it eventually merges with the normal state data at higher frequency.EPAPS ; BCS-code Correspondingly, remains unity at and suddenly starts to decrease at yielding a characteristic maximum in the reflectivity ratio . EPAPS In a multigap superconductor, the corresponding features due to the larger gaps are superimposed and thus more difficult to observe. Nevertheless, as shown in the following, the gap magnitudes can still be obtained based on an analysis with multiple independent isotropic BCS-type superfluids.BCS-code
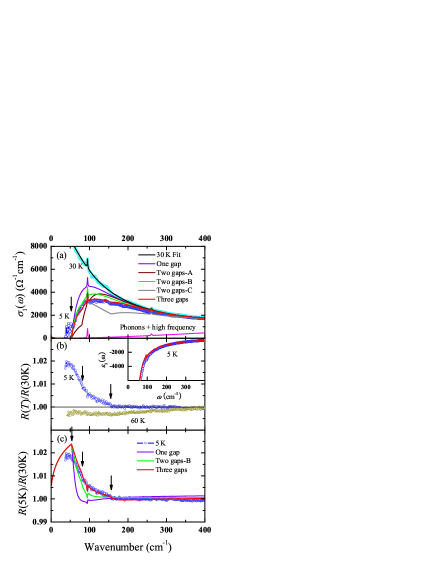
At first we fitted the normal state spectra of ) and ) with a Drude-Lorentz model. Since theory predicts that up to five bands are crossing the Fermi-level, the low frequency response could be composed of as many Drude bands. Nevertheless, we found that two Drude oscillators (with parameters as given in Table I) are sufficient for a reasonable description of the normal state data. Likely these represent the electronlike and holelike bands, respectively. Besides, we had to include two broad Lorentz oscillators centered at about 1100 and 5400 cm-1 to account for the electronic MIR bands plus two narrow ones at 95 and 261 cm-1 for the IR active phonons. Their contribution is shown by the pink line in Fig. 3(a) and assumed not to change below . Note that unlike in Ref. 19, our data yield no evidence for a sizeable electronic mode below about 500 cm-1 other than Drude terms. EPAPS
First we demonstrate that the model of a single BCS-type gap fails to describe our data. In this case, the sharp edge in , as marked by the black arrow in Fig. 3(a) defines the magnitude of the SC energy gap of 53 cm-1. Nevertheless, if we impose this gap value to the Drude-bands as obtained at 30 K, the model provides a poor description of the data since it largely overestimates the magnitude of , in particular, around the maximum near 4.
Next we show that a good agreement with the experimental data can be obtained with a three gap model. The signatures of the two larger gaps are considerably weaker than the ones of the smallest gap, but they can still be identified in the reflectivity ratio, (5K)/(30K), in Fig. 3(b) which eliminates any additional structures due to extrinsic features that may be introduced during the thermal cycle in between the gold correction procedure. While (60K)/(30K) shows no anomaly, (5K)/(30K) reveals two noticeable kinks near 80 and 157 cm-1 as marked by the black arrows. These kinks are well separated from the narrow features due to the phonon modes at 95 and 261 cm-1. Therefore they are supposed to be SC-induced ones, which should correspond to the edges of the larger gaps. Concerning the assignment of these gaps to the Drude bands (as obtained from the 30 K spectrum), the best fits were obtained if the gap structures at 53 and 157 cm-1 (80 cm-1) were associated with the narrow (broad) Drude-band as detailed in Table I. The quality of the fits was noticeably reduced if we changed the assignment of the gaps at 53 and 80 cm-1. Even for the largest gap, that is associated with a rather small amount of spectral weight, the comparison with the experiment become significantly worse if we assigned it to the broad Drude band. The best fit with this three gap model is shown by the red lines in Fig. 3. It reproduces all the characteristic features of the experimental data, including the long tail up to 150 cm-1 in (5K)/(30K). EPAPS ; comment-ratio scaled
Next we show that the best fits with a corresponding two-gap model are significantly worse. Figure 3 (a) shows the results for three representative assignments (A to C) of the gaps to the Drude-bands. It highlights that the steep rise of just above 53 cm-1 can only be reproduced if the smaller gap at 2 53 cm-1 is assigned to the narrow Drude-band as in models B and C. Nevertheless, model B (C) severely underestimates (overestimates) the magnitude of at higher frequency. Furthermore, the two gap models fail to reproduce the pronounced high frequency tail in (5K)/(30K) as is shown in Fig. 3(c) for model B which yields the most reasonable fit with two gaps to . We note that alternative ways of fitting, for example by describing the normal state spectrum with more than two Drude-bands, did not improve these two-gap model fits. Also, a strong coupling to a bosonic mode, while it might account for one of the kink structures in (5K)/(30K), would further increase above the boson energy and thus enhance the discrepancy with the experimental data. strong-coupling Finally, we note that the inclusion of an additional low-frequency electronic mode did not help to improve the quality of the fits comparable to the one of the three gap model. EPAPS
| Drude 1 ( = 90 cm-1) | Drude 2 ( = 300 cm-1) | |||
| 2 (cm-1) | (cm-2) | 2 (cm-1) | (cm-2) | |
| 30 K | 0 | 4.45107 | 0 | 4.3107 |
| 2 gaps-A | 80 | 4.45107 | 53 | 4.3107 |
| 2 gaps-B | 53 | 4.45107 | 80 | 4.3107 |
| 2 gaps-C | 53 | 4.45107 | 157 | 4.3107 |
| 3 gaps | 53 | 3.75107 | 80 | 4.3107 |
| 157 | 7.0106 | |||
Our multigap analysis thus provides evidence for three different energy gaps with 2 3.1, 4.7, and 9.2 in optimally doped BaFe2-xCoxAs2. These fall well into the range of the reported values of 2 1.6 - 10 as obtained with various techniques. ARPES-el ; ARPES-hole ; Specific heat ; muSR ; NMR-1 ; NMR-2 ; point contact We note that our optical data are compatible with the presence of a fourth energy gap of magnitude 2 3 or with gap nodes. As long as this gap or the nodal states involves a relatively small amount of spectral weight, we would not be able to identify the corresponding signature in the spectrum of ) where the error bars become sizeable below 53 cm-1. Some evidence (though not entirely conclusive) for an energy gap with 240 cm-1 or gap nodes is contained in the spectrum of (5)K/(30). As shown in Fig. 3(c), it does not exhibit the expected decrease below the lower gap edge at 53 cm-1, instead it remains almost constant down to at least 40 cm-1.
Concerning the assignment of these gaps to the different energy bands our optical data provide only limited information. This requires additional input concerning the momentum dependence for example from ARPES. We also note recent theoretical work which considers an order parameter with extended s-wave symmetry and finds that impurity scattering can lead to a substantial modification of the gap structures in the optical conductivity. Carbotte10 Clearly, further experimental and theoretical work is required to identify the number, magnitude and symmetry of the energy gaps in these multi-band superconductors.
In summary, with combined IR reflection and ellipsometry measurements we investigated the -dependent optical in-plane response of BaFe1.87Co0.13As2 single crystals with = 24.5 K.We showed that the spectra display clear SC-induced changes that are characteristic of at least three different energy gaps. In particular, we showed that they can be well accounted for in terms of a BCS-type multigap model with three isotropic gaps with 2 3.1, 4.7, and 9.2. In addition, we determined the SC plasma frequency and the corresponding low- value of the in-plane magnetic penetration depth of 270 nm.
Acknowledgements.
Part of the work was performed at the IR beamline of the ANKA synchrotron at FZ Karlsruhe, D, where we appreciate the technical support of Y.L. Mathis. We acknowldge financial support by the Schweizer Nationalfonds (SNF) under Grant No. 200020-119784 and No. 200020-129484, and the NCCR project MaNEP, and by the Deutsche Forschungsgemeinschaft (DFG) under Grant No. BE2684/1-3 in FOR538.References
- (1) Y. Kamihara et al., J. Am. Chem. Soc. 130, 3296 (2008).
- (2) K. Haule, J. H. Shim, and G. Kotliar, Phys. Rev. Lett. 100, 226402 (2008).
- (3) O.V. Dolgov, I.I. Mazin, D. Parker, and A.A. Golubov, Phys. Rev. B 79, 060502(R) (2009).
- (4) K. Kuroki et al., Phys. Rev. Lett. 101, 087004 (2008).
- (5) Yunkyu Bang and Han-Yong Choi, Phys. Rev. B 78, 134523 (2008).
- (6) R. T. Gordon et al., Phys. Rev. Lett. 102, 127004 (2009); J. K. Dong et al., Phys. Rev. Lett. 104, 087005 (2010).
- (7) K. Terashima et al., Proceedings of the National Academy of Sciences of the USA (PNAS) 106, 7330 (2009).
- (8) H. Ding et al., Euro. Phys. Lett. 83, 47001 (2008).
- (9) F. Hardy et al., Phys. Rev. B 81, 060501(R) (2010).
- (10) T.J. Williams et al., Phys. Rev. B 80, 094501 (2009).
- (11) P. Szabó et al., Phys. Rev. B 79, 012503 (2009).
- (12) M. Yashima et al., J. Phys. Soc. Jpn. 78 103702 (2009).
- (13) K. Matano, G.L. Sun, D.L. Sun, C.T. Lin, and Guo-qing Zheng, EPL 87 27012 (2009).
- (14) G. Li et al., Phys. Rev. Lett. 101, 107004 (2008).
- (15) A. Akrap et al., Phys. Rev. B 80, 180502(R) (2009).
- (16) W.Z. Hu et al., Phys. Rev. Lett. 101, 257005 (2008).
- (17) D. Wu et al., Phys. Rev. B 79, 155103 (2009).
- (18) A. Dubroka et al., Phys. Rev. Lett. 101, 097011 (2008).
- (19) E. van Heumen et al., arXiv:0912.0636.
- (20) D. Wu et al., arXiv:0912.0849.
- (21) B. Gorshunov et al., Phys. Rev. B 81, 060509(R) (2010).
- (22) C. C. Homes, M. Reedyk, D. A. Cradles, and T. Timusk, Appl. Opt. 32, 2976 (1993).
- (23) C. Bernhard, J. Humlícek, and B. Keimer, Thin Solid Films 455-456, 143 (2004).
- (24) A. Perucchi et al., arXiv: 1003.0565.
- (25) M.M. Qazilbash et al., Nature Physics 5, 647 (2009).
- (26) F. Rullier-Albenque, D. Colson, A. Forget, and H. Alloul, Phys. Rev. Lett. 103, 057001 (2009).
- (27) Michael Tinkham, Introduction to Superconductivity (McGraw-Hill, Singapore, 1996).
- (28) C. Bernhard et al., New J. Phys. 11, 055050 (2009).
- (29) Unpublished SR data on the same crystals.
- (30) See supplementary material at http://link.aps.org/ supplemental/10.1103/PhysRevB.81.214508 for specific details of the data analysis.
- (31) W. Zimmermann, E.H. Brandt, M. Bauer, E. Seider, and L. Genzel, Physica C 183, 99 (1991).
- (32) The calculated reflectivity ratio is scaled up by a factor of 1.002, which gives a good agreement at high frequency where the spectrum is featureless. This discrepancy might originate from the numerical code, which generates slightly larger spectral weight than the model Drude term, or from imperfection of the fit to the normal state (Ref. 30).
- (33) Sang Boo Nam, Phys. Rev. 156, 487 (1967).
- (34) J.P. Carbotte and E.Schachinger, Phys. Rev. B 81, 104510 (2010).