Testing galaxy formation scenarios with a new mass estimator
Abstract
We present the recently derived Wolf et al. (2009) mass estimator, which is applicable for spherical pressure-supported stellar systems spanning over ten orders of magnitude in luminosity, as a tool to test galaxy formation theories. We show that all of the Milky Way dwarf spheroidal galaxies (MW dSphs) are consistent with having formed within a halo of mass approximately in CDM cosmology. The faintest MW dSphs seem to have formed in dark matter halos that are at least as massive as those of the brightest MW dSphs, despite the almost five orders of magnitude spread in luminosity. We expand our analysis to the full range of observed pressure-supported stellar systems and examine their I-band mass-to-light ratios . The vs. half-light mass relation for pressure-supported galaxies follows a U-shape, with a broad minimum near that spans dwarf elliptical galaxies to normal ellipticals, a steep rise to for ultra-faint dSphs, and a more shallow rise to for galaxy cluster spheroids.
Keywords:
Galactic dynamics, dwarf galaxies, elliptical galaxies, galaxy formation:
98.52.Eh, 98.52.Wz, 98.62.Ck, 98.62.Dm1 Accurate mass determinations from L.O.S. kinematics
Mass determinations for pressure-supported galaxies based on only line-of-sight velocity measurements suffer from a notorious uncertainty associated with not knowing the intrinsic 3D velocity dispersion. The difference between radial and tangential velocity dispersions is usually quantified by the stellar velocity dispersion anisotropy, . Many questions in galaxy formation are affected by our ignorance of , including our ability to quantify the amount of dark matter in the outer parts of elliptical galaxies, to measure the mass profile of the Milky Way from stellar halo kinematics, and to infer accurate mass distributions in dwarf spheroidal galaxies (dSphs).
However, it has recently been shown that by manipulating the spherical Jeans equation there exists one radius within any pressure-supported galaxy where the integrated mass as inferred from the line-of-sight velocity dispersion is largely insensitive to , and that this radius is approximately equal to the 3D deprojected half-light radius Wolf_09 . Moreover, the mass within is well characterized by a simple formula that depends only on quantities that may be inferred from observations:
| (1) |
where is the mass enclosed within a sphere of radius , is the line-of-sight velocity dispersion and the brackets indicate a luminosity-weighted average. In the above equation we have used for the 2D projected half-light radius. This approximation is accurate to better than 2% for exponential, Gaussian, King, Plummer, and Sérsic profiles (see Appendix B of Wolf_09 ).
2 Dwarf spheroidal galaxies of the Milky Way
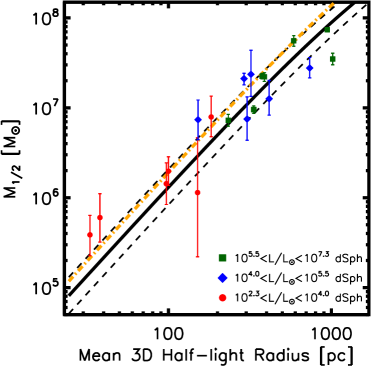
As an example of the utility of determinations, Figure 1 presents vs. for MW dSph galaxies. Relevant parameters for each of the galaxies are provided in Table 1 of Wolf_09 . The symbol types labeled on the plot correspond to three wide luminosity bins that span almost five orders of magnitude in luminosity. It is interesting now to compare the data points in Figure 1 to the integrated mass profile predicted for CDM dark matter field halos of a given mass, which is defined as the halo mass corresponding to an overdensity of 200 compared to the critical density. In the limit that dark matter halo mass profiles map in a one-to-one way with their mass, then the points on this figure may be used to estimate an associated halo mass for each galaxy.
The solid line in the left panel of Figure 1 shows the mass profile for a NFW (nfw, ) dark matter halo at with a halo mass . We have used the median concentration () predicted by the mass-concentration model Bullock_01 updated for WMAP5 CDM parameters Maccio_08 . The dashed lines indicate the expected scatter about the median concentration at this mass. The dot-dashed line shows the expected profile for the same mass halo at (corresponding to a concentration of ), which provides an estimate of the scatter that would result from the scatter in infall times. We see that each MW dSph is consistent with inhabiting a dark matter halo of mass Strigari_08 .
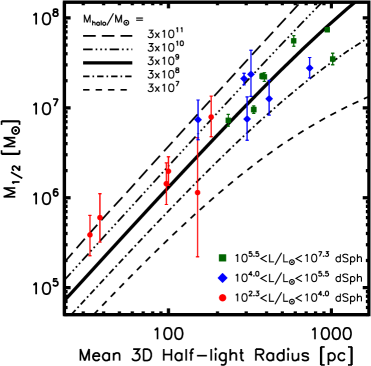
The right panel in Figure 1 shows the same data plotted along with the median mass profiles for several different halo masses. Clearly, the data are also consistent with MW dSphs populating dark matter halos of a wide range in above . This value provides a very stringent limit on the fraction of the baryons converted to stars in these systems. More importantly, there is no systematic relationship between dSph luminosity and the mass profile that they most closely intersect. The ultra-faint dSph population (circles) with is equally likely to be associated with the more massive dark matter halos as are classical dSphs that are more than 1,000 times brighter (squares). Indeed, a naive interpretation of the right-hand panel of Figure 1 shows that the two least luminous satellites (which also have the smallest and values) are associated with halos that are more massive than any of the classical MW dSphs (squares). This general behavior is difficult to reproduce in models constructed to confront the Milky Way satellite population, which typically predict a noticeable trend between halo infall mass and dSph luminosity. It is possible that we are seeing evidence for a new scale in galaxy formation Strigari_08 or that there is a systematic bias that makes less luminous galaxies that sit within low-mass halos more difficult to detect than their more massive counterparts (Bullock et al., in preparation).
3 Global population of pressure-supported systems
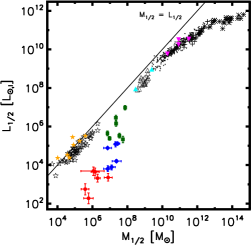
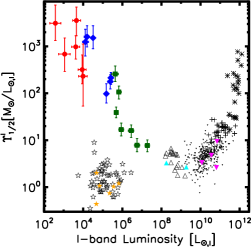
A second example of how accurate determinations may be used to constrain galaxy formation scenarios is presented in Figure 2, where we examine the relationship between the half-light mass and the half-light luminosity for the full range of pressure-supported stellar systems in the universe: globular clusters, dSphs, dwarf ellipticals, ellipticals, brightest cluster galaxies, and extended cluster spheroids.
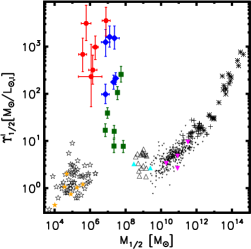
There are several noteworthy aspects to Figure 2, which are each highlighted in a slightly different fashion in the three panels. First, as seen most clearly in the middle and right panels, the half-light mass-to-light ratios of spheroidal galaxies in the universe demonstrate a minimum at that spans a remarkably broad range of masses and luminosities . It is interesting to note the offset in the average mass-to-light ratios between globular clusters and L⋆ ellipticals, which may suggest that even within , dark matter may constitute the majority of the mass content of L⋆ elliptical galaxies. Nevertheless, it seems that dark matter plays a clearly dominant dynamical role () within in only the most extreme systems. The dramatic increase in half-light mass-to-light ratios at both smaller and larger mass and luminosity scales is indicative of a decrease in galaxy formation efficiency in the smallest and largest dark matter halos. It is worth mentioning that a similar trend in the vs. relationship must exist if CDM is to explain the luminosity function of galaxies. While the relationship presented in Figure 2 focuses on a different mass variable, the similarity in the two relationships is striking, and generally encouraging for the theory.
One may gain some qualitative insight into the physical processes that drive galaxy formation inefficiency in faint vs. bright systems by considering the vs. relation (left panel) in more detail. We observe three distinct power-law regimes with , , and as mass increases. Over the broad middle range of galaxy masses, , mass and light track each other quite closely with , while very faint galaxies obey , and bright elliptical galaxies have transitioning to for the most luminous cluster spheroids. One may interpret the transition from in faint galaxies to in bright galaxies as a transition between mass-suppressed galaxy formation to luminosity-suppressed galaxy formation. That is, for faint galaxies (), we do not see any evidence for a low-luminosity threshold in galaxy formation, but rather we are seeing behavior closer to a threshold (minimum) mass with variable luminosity. For brighter spheroids with , the increased mass-to-light ratios are driven more by increasing the mass at fixed luminosity, suggestive of a maximum luminosity scale Wolf_09 .
Regardless of the interpretation of Figure 2, it provides a useful empirical benchmark against which theoretical models can compare. Interestingly, two of the least luminous MW dSphs have the highest mass-to-light ratios of any collapsed structures shown, including intra-cluster light spheroids, which reach values of . Not only are the ultra-faint dSphs the most dark matter dominated objects known, as they have even lower baryon-to-dark matter fractions than galaxy clusters , we now see that ultra-faint dSphs also have higher mass-to-visible light ratios within their stellar extents than even the (well-studied) galaxy cluster spheroids.
References
- (1) Bullock, J. S., Kolatt, T. S., Sigad, Y., Somerville, R. S., Kravtsov, A. V., Klypin, A. A., Primack, J. R., Dekel, A. 2001, MNRAS, 321, 559
- (2) Macciò, A. V., Dutton, A. A., van den Bosch, F. C. 2008, MNRAS, 391, 1940
- (3) Navarro, J. F., Frenk, C. S., White, S. D. M. 1997, ApJ, 490, 493
- (4) Strigari, L. E., Bullock, J. S., Kaplinghat, M., Simon, J. D., Geha, M., Willman, B., Walker, M. G. 2008, Nature, 454, 1096
- (5) Wolf, J., Martinez, G. D., Bullock, J. S., Kaplinghat, M., Geha, M., Munoz, R. R., Simon, J. D., Avedo, F. F. 2009, arXiv:0908.2995