Sizes and ages of SDSS ellipticals: Comparison with hierarchical galaxy formation models
Abstract
In a sample of about 45,700 early-type galaxies extracted from SDSS, we find that the shape, normalization, and dispersion around the mean size-stellar mass relation is the same for young and old systems, provided the stellar mass is greater than . This is difficult to reproduce in pure passive evolution models, which generically predict older galaxies to be much more compact than younger ones of the same stellar mass. However, this aspect of our measurements is well reproduced by hierarchical models of galaxy formation. Whereas the models predict more compact galaxies at high redshifts, subsequent minor, dry mergers increase the sizes of the more massive objects, resulting in a flat size-age relation at the present time. At lower masses, the models predict that mergers are less frequent, so that the expected anti-correlation between age and size is not completely erased. This is in good agreement with our data: below , the effective radius is a factor of lower for older galaxies. These successes of the models are offset by the fact that the predicted sizes have other serious problems, which we discuss.
keywords:
galaxies: structure – galaxies: formation – galaxies: evolution – cosmology: theory1 Introduction
According to the standard cosmological paradigm of structure formation and evolution, dark matter (DM) halos have grown hierarchically, through the merging together of smaller units into ever larger systems (Press & Schechter, 1974; Bond et al., 1991; Lacey & Cole, 1993; Sheth et al., 2001). In this scenario, galaxies form inside this hierarchically growing system of DM halos (White, 1979; White & Frenk, 1991). Semi-analytical models (SAMs) of galaxy formation (e.g., Cole et al., 2000; Benson et al., 2003; Granato et al., 2004; Menci et al., 2004; Bower et al., 2006; Cattaneo et al., 2006; Croton et al., 2006; De Lucia et al., 2006; Khochfar & Silk, 2006a, b; Hopkins et al., 2006; Monaco et al., 2007) have now been able to reproduce several properties of the local galaxy population. In particular, the local galaxy luminosity function has been successfully matched both at the high and low luminosity ends owing to the implementation of models for the feedback from both stellar evolution and active galactic nuclei (AGN) (e.g., Benson et al., 2003; Granato et al., 2004, 2006; Di Matteo et al., 2005; Bower et al., 2006; Cattaneo et al., 2006; Croton et al., 2006; De Lucia et al., 2006; Menci et al., 2006; Monaco et al., 2007). While this feedback significantly reduces the amount of cooling baryons in the host halos, it also seems to be a promising tool to account for the AGN luminosity functions and mean trends in the stellar-halo mass relations (e.g., Wyithe & Loeb, 2003; Scannapieco & Oh, 2004; Cirasuolo et al., 2005; Di Matteo et al., 2005; Sazonov et al., 2005; Vittorini et al., 2005; Hopkins et al., 2006; Lapi et al., 2006; Shankar et al., 2006; Benson et al., 2007; Fontanot et al., 2007; Malbon et al., 2007; Marulli et al., 2008; Shankar et al., 2008b).
In addition to the luminosities, masses, and metallicities of galaxies, their sizes, measured at low and high redshift, provide strong constraints on galaxy formation models (e.g., Cirasuolo et al., 2005; Khochfar & Silk, 2006a; Almeida et al., 2007; Fan et al., 2008; González et al., 2009; Hopkins et al., 2009b; Bernardi, 2009; van der Wel et al., 2009). Recent observations show that galaxies of a given stellar mass are more compact (e.g., Trujillo et al., 2006, 2007; Cimatti et al., 2008; Buitrago et al., 2008; Chapman et al., 2008; Franx et al., 2008; Saracco et al., 2009; Tacconi et al., 2008; van der Wel et al., 2008; van Dokkum et al., 2008; Younger et al., 2008; Damjanov et al., 2009; Williams et al., 2009), and, at least some, have higher velocity dispersions (e.g., Cenarro & Trujillo, 2009; van Dokkum et al., 2009) at redshifts greater than unity; this is also true of BCGs, even for small lookback times (Bernardi, 2009). Saracco et al. (2009) also showed that at , while older galaxies at fixed stellar mass tend to lie a factor of below the size-stellar mass relation characterizing local early-type galaxies (Shen et al. 2003), younger galaxies are consistent with it. After analyzing a sample of 12 very massive galaxies at similar redshift, Mancini et al. (2009) suggested a downsizing scenario in sizes, with the most massive galaxies approaching the local size-mass relation earlier then less massive ones. Cappellari et al. (2009) also discussed that two massive galaxies with individual spectra at are similar to local counterparts, and another 7 galaxies with velocity dispersion from staked spectrum, are consistent to the most dense local galaxies of the same mass.
Small sizes (and, at fixed mass, higher velocity dispersions) at high redshifts are not unexpected: they result if galaxies at higher redshifts formed through more gas-rich and dissipative mergers (e.g., Robertson et al., 2006). Moreover, the gas fractions and the overall density of the universe decrease with time (e.g., Hopkins et al., 2009b, and references therein) implying, on average, less dense remnants at later times. Therefore if galaxies continuously form at different epochs, it is expected that in deep observation at , galaxies at fixed stellar mass might follow a distribution of sizes, with older galaxies born from gas-richer events, being more compact.
However, the problem is to explain how all galaxies, irrespective of their age, evolve in time on the same local size-mass relation. As shown by van Dokkum et al. (2008), Shankar & Bernardi (2009), and further discussed here, a simple pure monolithic collapse followed by strictly passive evolution is not satisfactory, as this does not explain why the extremely small sizes and high densities of massive galaxies at high- have no local counterparts in SDSS (also see Trujillo et al., 2009).
Shankar & Bernardi (2009) used a sample of about 48,000 early-type galaxies from the Sloan Digital Sky Survey (SDSS; York et al. 2000) to show that older galaxies have smaller half-light radii and larger velocity dispersions than younger ones of the same stellar mass . Specifically, they found that, using the age-corrected luminosity as a proxy for , galaxies with age Gyrs below have smaller by 40% and larger by 25%, compared to galaxies that are 4 Gyrs younger. The sizes and velocity dispersions of more luminous galaxies vary by less than , whatever their age, implying a significant break in the – and – relations at high . The galaxies in their sample have been carefully selected to be early-type galaxies, and they are all characterized by much larger sizes and lower densities than their higher redshift massive counterparts. Also, the differences between the sizes of old and young galaxies reported by Shankar & Bernardi (2009), are far less than expected from a simple monolithic model evolution with at fixed stellar mass, which would result if the galaxy density is proportional to the density of the universe.
Our goal in what follows is to compare these findings data with hierarchical models of galaxy formation and evolution to understand how well they can reproduce the data. In Section 2 we first revisit the main observational results regarding the size-mass relation in local ellipticals, showing that the very massive galaxies of any age follow similar size-stellar mass relations in shape, normalization, and dispersion around the mean. Section 3 compares our measurements with the publicly available SAM of Bower et al. (2006, B06 hereafter), which has successfully reproduced several statistical properties of galaxies. The B06 model, which is based on the Millennium Simulation of the dark matter distribution (Springel, 2005), provides the sizes of spheroids at any epoch, thus enabling a direct comparison between the predicted and observed size-mass evolution. We use the SAMs to discuss how the number and type of mergers (dry or wet) scale with final stellar mass. In particular, we show that dry mergers, defined to be mergers between gas-poor progenitors, might be good candidates for erasing the effects of a monolithic collapse and producing a rather flat size-age relation, similar to what observed in the data. Our conclusions are in § 5, where we also discuss some serious failures of the models.
Throughout this paper we adopt the cosmological parameters , , and .
2 DATA AND MEASUREMENTS
2.1 The sample
We use the SDSS-based sample of early-type galaxies from Hyde & Bernardi (2009). This sample was constructed in a way to maximize the contribution of elliptical galaxies as briefly described here (see the recent work by Bernardi et al. 2009 for further details). The galaxies in this sample are very well described by a deVaucouler profile in both the and bands (fracDev=1), have ”early-type” spectrum, with eClass (to minimize later-type contamination), and have an additional cut in axis ratio of . These galaxies were also selected to have velocity dispersion higher than 60 , close to the dispersion limit of the SDSS spectrograph, and less than 400 , to avoid contamination from double/multiple superpositions (Bernardi et al. 2006, 2008). The resulting sample, which contains about 47,300 early-type galaxies, is distributed within the redshift range , which corresponds to a maximum lookback time of 3.5 Gyr. Based on the recent, detailed analysis performed by Bernardi et al. (2009), this sample has minimal contamination by disky S0 galaxies, which makes it an ideal catalog to compare with galaxy evolution models of massive spheroids. The galaxies in the sample have apparent magnitudes (based on deVaucouleur fits to the surface brightness profiles). (The SDSS photometric parameters for these objects have been corrected for known sky subtraction problems which affect bright objects.) Estimated stellar masses and ages for these objects are from Gallazzi et al. (2005). These are based on running a likelihood analysis of the spectra that returns a mass-to-light ratio (defined for a Chabrier 2003 initial stellar mass function), which is in turn converted to a stellar mass using the SDSS petrosian -band restframe magnitude (see Bernardi et al. 2009 for a comprehensive discussion and comparison of such stellar mass estimates with other methods). Our main results do not change if we use the ages published by Bernardi et al. (2006), which were computed by fitting the Thomas et al. (2005) -enhanced models to the Lick index absorption features. The age estimates of Jimenez et al. (2007), derived from single stellar population spectral fitting, using the MOPED algorithm (Heavens et al. 2000), also yield similar results. Also, a possible bias might be introduced by the youngest galaxies in the sample with ages (the young age could be due to weak star formation which makes the galaxy to appear relatively young), comparable to the lookback time of the sample and close to the average error in age estimates. However, we have checked that cutting out these galaxies and repeating the analysis does not minimally alter the overall conclusions of the paper.
Finally, we note that the age and stellar mass estimates come from the same algorithm, so they have correlated errors. However, this does not bias the results which follow (for details, see Bernardi, 2009; Shankar & Bernardi, 2009).
In what follows we wish to study the bulk of the early-type population. However, e.g., Bernardi (2009) has argued that Brightest Cluster Galaxies (BCGs) had unusual formation histories, so, following Shankar & Bernardi (2009), we remove them from our sample. Our final sample is composed of galaxies.


2.2 Results
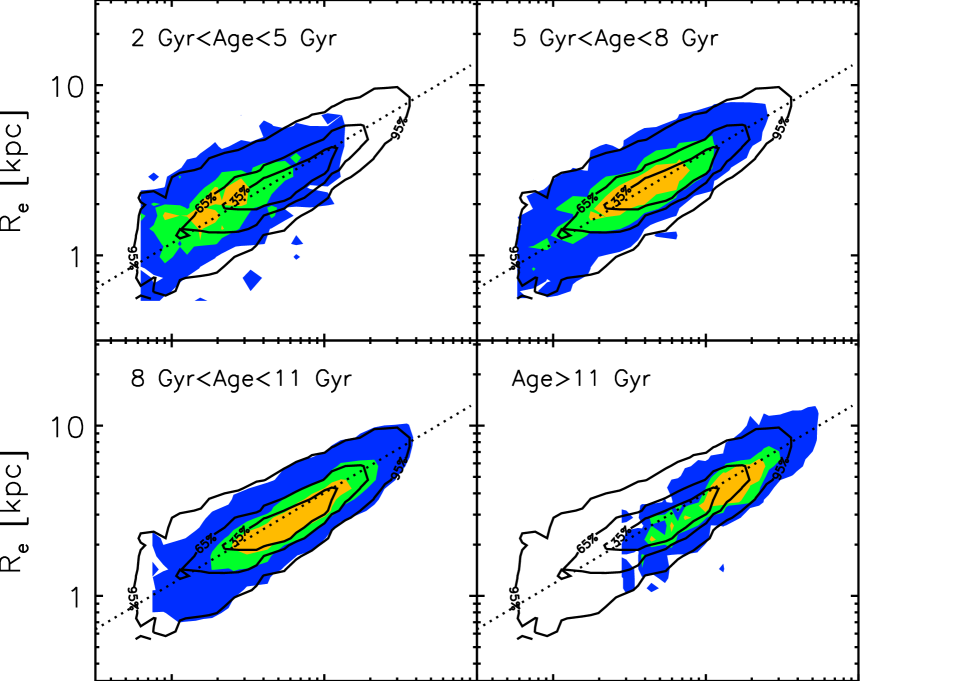
It is well known that more massive early-type galaxies have larger half-light radii. The dotted line (same in all four panels) in Figure 1 shows this relation in our dataset, obtained from a linear fitting , in very good agreement with previous results from Shen et al. (2003). Notice also that the spread in size at fixed mass is approximately dex for masses below , decreasing at large mass. This behavior in the scatter as a function of stellar mass was already noted by Shen et al. (2003), and we here further suggest, after Shankar & Bernardi (2009) and the discussion below, that this is mainly induced by the different gradients in the size-age relation in different stellar mass bins. The solid contours, the same in each panel, bracket the regions containing 30%, 65%, and 95% of the full sample, respectively.
The orange, green, and blue coloured regions show the corresponding distributions when we restrict the sample to narrow bins in (luminosity-weighted) age. Notice that the older galaxies tend to populate the high-mass end of this relation (the shaded regions peak at higher in the bottom right panel than in the top left), in qualitative agreement with the notion of downsizing (e.g., Cowie et al., 1996; Heavens et al., 2004). To proceed in a more accurate analysis, we have refitted the size-mass relation for the subsamples of galaxies considered in Figure 1. We found that while younger galaxies follow a significantly shallower correlation, 0.48±0.01, the oldest ones follow a steeper relation, with 0.65±0.01. These behaviors are mainly caused by the fact that below , older galaxies tend to gradually have sizes that are up to a factor of about two smaller than younger ones of the same . Above , the sizes are instead similar, whatever the age.
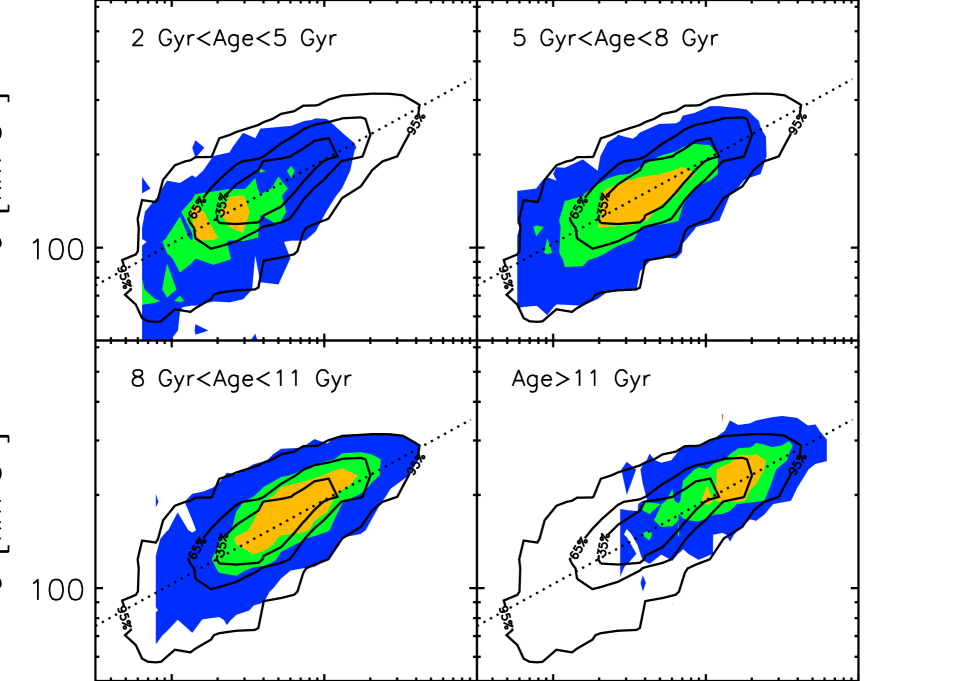
Figure 2 shows a similar analysis of the velocity dispersions rather than the sizes. As for the sizes, the overall scatter in at fixed is independent of age, but decreases with increasing , lending further support to our above suggestion that what is actually driving the mass-dependent scatter in the size-mass relation is correlated to differences in ages (see also Shankar & Bernardi 2009). And, to lowest order, the mean velocity dispersion-stellar mass relation, which we fit as , is the same in all age bins – the primary trend being that older galaxies are shifted to larger values. A more detailed analysis yields that, at the low mass end, young galaxies (which had slightly larger sizes) have slightly lower velocity dispersions, thus causing a slight steepening of the relation.
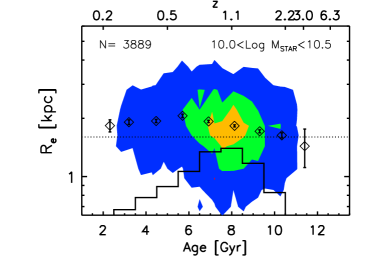
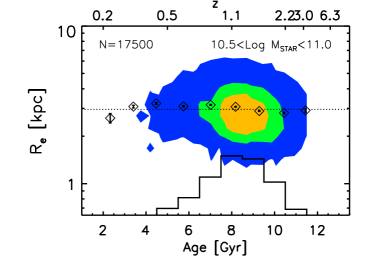
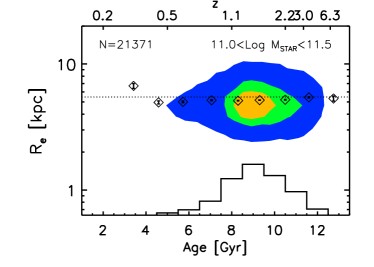
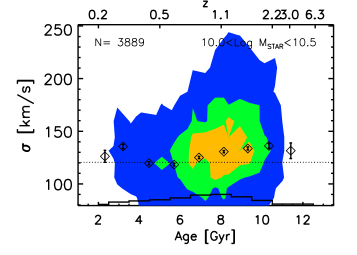
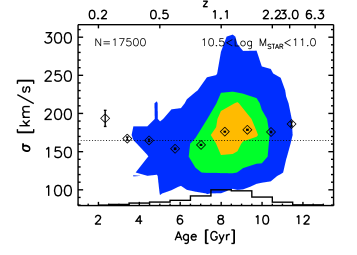
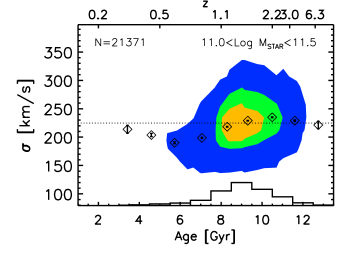
Figures 3 and 4 show another view of the correlations between size, mass and age: the size-age relation for bins in . In agreement with the previous Figures and what discussed in § 1 (see also Shankar & Bernardi 2009), the lower mass galaxies (upper left panels) have sizes and velocity dispersions which show some significant trends with age, with older galaxies having smaller and larger . At the top of each panel we also indicate, for better reference to the models discussed below, the redshift corresponding to the lookback time equal to the age. The dotted lines in the Figures show the mean values of size or velocity dispersion predicted by the global - and - relations (dotted lines in Figures 1 and 4) for the stellar mass defined in each panel. It is clear that while the lowest mass bins present a significant gradient with age (opposite sign for sizes and velocity dispersion), this trend progressively disappears when moving to more massive galaxies, with almost no correlation between size and age for the most massive ones.
Nevertheless, more massive objects are offset to larger sizes. As a result, when averaged over all masses, older objects have larger sizes, except possibly for the oldest galaxies. The bottom right panels of Figures 3 and 4 show the results of this exercise. When randomly selecting galaxies from the whole sample (the points are averages over 100 realizations with 1000 points each), we find an increasing size and velocity dispersion with increasing stellar mass. Thus, the size-age relation is almost entirely due to the size-mass and age-mass correlations (massive objects are older and larger). This is analogous to the color-magnitude relation being entirely due to the correlations between color and luminosity with velocity dispersion (Bernardi et al., 2005).
Similarly, at fixed , there is little correlation between and age, but, because more massive galaxies are offset to larger , the result of averaging the -age relation over all yields a strong trend: the oldest galaxies have the highest values of (e.g., Bernardi et al., 2005).
2.3 Some implications
In a strict monolithic scenario for galaxy formation in which the age of the stars reliably traces the time the galaxy was assembled, older galaxies should have smaller sizes than younger galaxies of the same stellar mass. This is because objects which assembled earlier did so in a denser universe. If the galaxy density is proportional to the density of the universe at the time of assembly, one expects at fixed stellar mass. (One might expect the actual scaling to be even stronger, since dissipation in the baryonic clumps from which the stars form is expected to be more efficient when the density is higher, so objects which form at higher redshift should be even more compact and have even higher velocity dispersions.) However, the sizes of old and young galaxies in our sample are much weaker functions of age. This rules out models in which star formation and assembly are concurrent, and galaxies passively evolve thereafter.
On the other hand, as reviewed in Section 1, a large portion of high redshift galaxies are observed to be more compact than their counterparts at low . Therefore, some process must have altered the sizes and stellar masses of galaxies since they formed. Our results suggest that, whatever the mechanism, it must be “fine-tuned” so as to yield the essentially flat size-age and -age relations (at fixed ) shown in Figures 3 and 4.
3 COMPARISON WITH GALAXY FORMATION MODELS
In this Section we compare our observational data with the predictions of semi-analytic galaxy formation models. See Parry et al. (2008) and Shankar et al. (2009c) for a detailed description and comparison of such models, which follow the cosmological co-evolution of dark matter halos, subhalos, galaxies and supermassive black holes within the concordance CDM cosmology. Briefly, these models track disk and bulge components of each object as it evolves. B06 also output the half mass radius of the spheroid component, so this is the model we use as a reference in what follows.
We will be interested in the masses, (half-mass) sizes, and formation histories of the early-types galaxies in these models. We classify a galaxy as early-type if it has , where and are the predicted -band magnitude of the bulge and of the whole galaxy, respectively. This cut selects galaxies with a bulge-to-total ratio , which is the minimum characterizing the galaxies in the Hyde & Bernardi (2009) sample. Note that this cut in preferentially selects spheroid-dominated galaxies, while a more common cut of , comparable to a cut in concentration of (e.g., González et al. 2009), allows for a large contamination of disky galaxies (see the recent analysis by Bernardi 2009). The latter type of galaxies might have had quite different formation histories than the ones of interest to this paper. In fact, a large fraction of S0 galaxies in the B06 model grow their bulge via disk instability. Also, as further discussed in Shankar et al. (2009c), the mock galaxy sample considered here covers a wide variety of stellar masses and luminosities, as in the observed one. Nevertheless, as discussed by González et al. (2009), Shankar et al. (2009c) and further below, the model has a tendency to produce broader distributions at fixed size and/or stellar mass than those actually observed. We believe that this effect is mainly due to somewhat inappropriate physical recipes more than inadequate selection cuts in the model (see the detailed analysis by González et al. 2009 on this exact point).
We identify the formation epoch of an early-type galaxy as the first time along the merger tree that the progenitor becomes an early-type. Note that this classification of early-types and their formation does not make any assumptions about the color or the star formation rate. In the following, we will present results based on the full sample of early-type galaxies, regardless of whether they end up being central or satellite galaxies at . However, because we have removed BCGs from the data, we have checked that our basic result, of a flat size-age relation at fixed stellar mass, is still conserved if we remove the objects which are centrals at in the model halos.
3.1 Higher densities at early times?
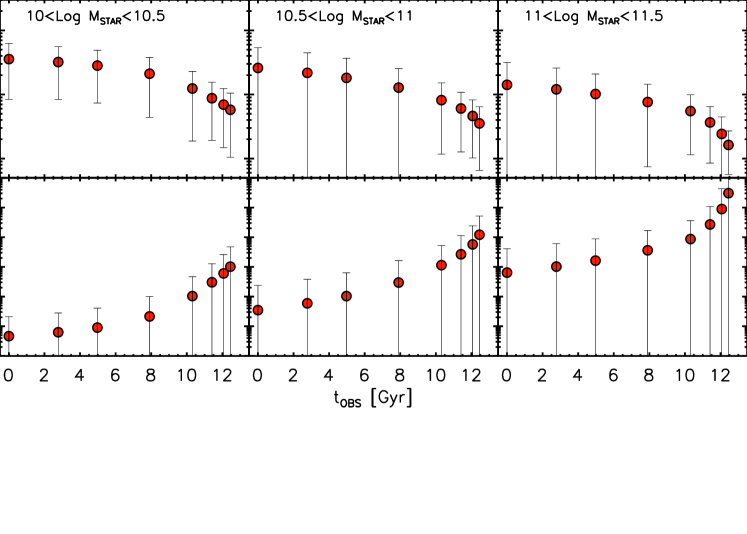
Before we present a more direct comparison of these models and the data shown in the previous figure, it is interesting to see if the models are consistent with the notion that objects at high redshift are denser, for the reasons discussed in the Introduction. Figure 5 shows the sizes (top) and densities (bottom) as a function of lookback time, for objects of fixed stellar mass at each lookback time. The three panels show these predictions for three choices of . Notice that high-redshift objects are smaller (and hence denser) than their counterparts of the same at later times – in qualitative agreement with observations and expectations.
However, notice that the models predict the typical size to decrease as increases. This is grossly discrepant with observations, and suggests that there is considerable room for improvement with regards to how the models assign sizes – this was also noted by González et al. (2009) and Shankar et al. (2009c). We further discuss in Shankar et al. (2009c) the actual successes and failures of the present model by making use of a combined comparison with the size and mass distributions as observed in SDSS. In this paper, however, we are less interested in the form of the correlation between size and mass — we are more interested in checking if a “chaotic” formation model, such as a hierarchical one, in which early-type galaxies form and grow continuously, can reproduce the fact that the size-mass relation is independent of age – as observed for today’s massive galaxies, irrespective of whether the final size is actually the one observed for that bin of stellar mass.

3.2 Mass dependent evolution of sizes and masses
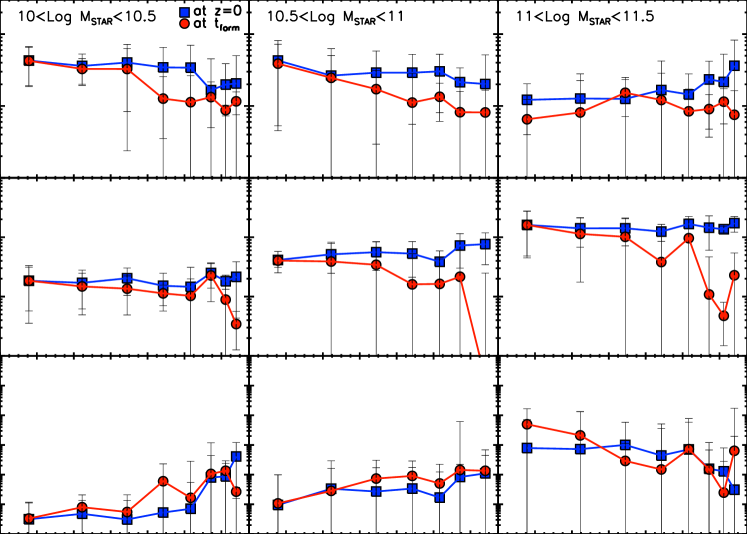
Figure 6 shows the model predictions in a format that is closer to that shown in the previous section. We here plot the median sizes, stellar masses and densities (along with their dispersions), averaged over 100 merger histories111We have checked that the main results of this paper do not depend significantly on the specific number of random merger histories adopted. Increasing this number by a factor of a few yields essentially equal results both in the mean trends and broadness of distributions around the mean., of galaxies with stellar mass at in the mass bin indicated at the top of each column. In each case the trees are followed back in time, choosing the most massive early-type progenitor, until this is no longer possible. The blue squares refer to the properties of galaxies (size, mass, or density) at , while the red circles refer to the properties the same set of galaxies had at their formation epoch, (defined as lookback time in Gyr). The blue squares in the top panels, which show the size-age relation for galaxies in narrow bins in , can be directly compared with the measurements shown in Figure 3, assuming the age of a galaxy is a good proxy for its formation epoch . Notice that, at fixed , the size-age relation is weak, with a slight tendency for old objects to be smaller in the smallest bin, but to be larger in the largest bin. Indeed, the models suggest that, at small , older objects have slightly smaller sizes whereas the opposite is true at higher . The sense of these weak trends at fixed is also in qualitative agreement with our measurements in the SDSS, and may be considered a significant success of the models. However, we stress that the models predict smaller sizes at large , whereas the data shows the opposite trend. As a result, the overall relation in these models is grossly discrepant with that in the SDSS. (This is essentially the same problem we found in Figure 5; the only difference is that there the galaxies in a given panel were selected to have the same at all lookback times, whereas here they have the same only at , and we then study their progenitors at earlier times.)
If the problem with the models is simply the overall normalization of the sizes for a given , then it is interesting to study what aspect of the models produced the flat size-age relation. The first question which arises in this context is what these objects looked like in the past. The red circles in each panel show the sizes, masses and densities (top to bottom) of these objects at the time they formed. The middle panels show that the mass change is larger for objects which formed at larger redshift, as one might expect, but that this change is most dramatic for the oldest most massive galaxies (which have increased their mass by about a factor of ten). Comparison with the top panels shows that the sizes increase when the masses do, and that, except in the low mass bin, the fractional increase in size since formation is rarely larger than that in the mass. As a result, the densities of low mass galaxies today have decreased since they formed, whereas this trend is less clear for the higher mass galaxies.
Figure 7 compares the models and the data in a format which is more like Figure 3: size versus formation time for a few bins in stellar mass (we again here make the assumption that the age of SDSS galaxies is a good proxy for their formation time ). To circumvent the problem that the scaling of SAM size with stellar mass is wrong, we show the sizes in a fixed mass bin normalized by the mean sizes of galaxies which formed most recently. For the SDSS data (open diamonds), this means that we take the values shown by the diamonds in Figure 3 and divide by the value of the left-most diamond (for the galaxies with mass above , we consider only galaxies with ages above Gyr, given that the bins below are not statistically significant); for the SAMs (filled circles), we take the blue circles shown in Figure 6 divided by the leftmost blue circle (for consistency, for the more massive galaxies in the SAM we only select objects with a minimum age of Gyr). Note how the SAMs are generally in good agreement with the data. They produce rather flat size-age relations, and, at low masses, the older galaxies are about smaller than younger ones. We show below that, in the models, this happens because lower mass galaxies undergo fewer mergers.
| Type | ||||||||
|---|---|---|---|---|---|---|---|---|
| Minor Dry Mergers | 57% | 33% | 73% | 30% | 90% | 36% | ||
| Major Dry Mergers | 26% | 49% | 22.5% | 59% | 0% | 61% | ||
| Wet Growth | 10% | 8% | 4% | 2% | 2.5% | 1% | ||
| Disk Instability | 7% | 10% | 0.5% | 9% | 7.5% | 2% | ||
Notes: Fractional increase in size and stellar mass for the galaxies of different mass at ; although most of the stellar mass is added via major dry mergers, most of the growth in size is through minor dry mergers.
3.3 Major versus minor mergers
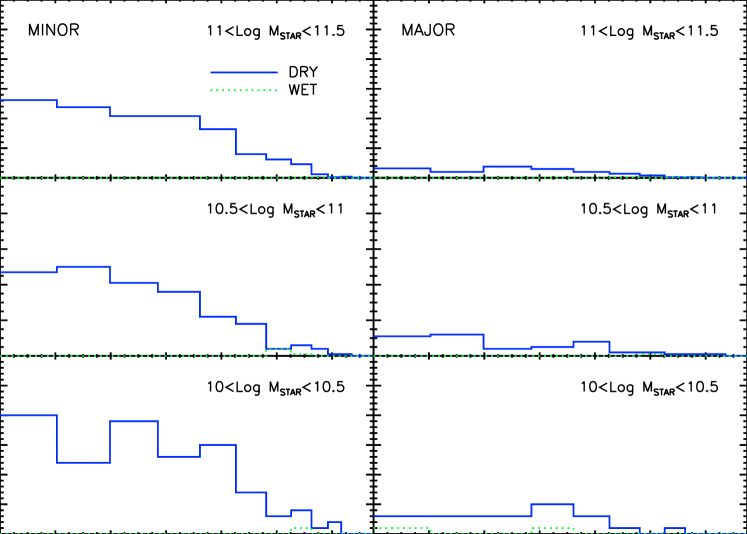
Figure 8 shows the predicted mean number of wet (dotted) and dry (solid), minor (left) or major (right) mergers that today’s early-type galaxies have undergone since they formed. More specifically, we compute the mean number of mergers per Gyr a galaxy had since its formation epoch, averaged over all galaxies, as a function of lookback time . (The numbers of mergers for each galaxy were extracted from the same 100 merger trees used in the previous figures; wet mergers have a cold-total gas mass fraction in the progenitors that is greater than 0.15, else the merger is dry; minor mergers have mass ratios , else the merger is major.) Notice that there are essentially no wet mergers; massive objects have had an order of magnitude more major mergers and at least a factor of two more minor mergers, than lower mass objects; and that minor mergers are typically a factor of 5 times more frequent than major mergers.
Table 1 summarizes the actual increases in size and stellar mass experienced by the early-type galaxies in the model. It is apparent that while a substantial fraction of the stellar mass is added to the galaxy via major mergers, the sizes mostly increase via minor dry mergers since their formation epoch. These galaxies remain gas-poor for most of their assembly history: only (decreasing to for the most massive systems) of the final sizes and masses grow due to gas-rich mergers. These objects are all bulge-dominated, given that of the size and stellar mass is increased via disk instability.
The minor merger-dominated size evolution of massive early-type galaxies in Figure 8 may be related to that of their DM halos. Stewart et al. (2008) from high-resolution CDM N-body simulations found that the mass assembly in “galactic” halos, those with mass in the range , to be dominated by mergers that are 10% of the final halo mass. Minor dry mergers would also more easily preserve the projections of the fundamental plane, such as the the - (e.g., Faber & Jackson, 1976; Davies et al., 1983) and - (e.g., Kormendy, 1977; Ziegler et al., 1999; Bernardi et al., 2003) relations (see discussion in Ciotti 2009; Bernardi 2009 and references therein). Preliminary measurements also show that the central densities within the same physical scale for samples of low and high redshift galaxies of the same stellar mass, are consistent within a factor of (e.g., Cimatti et al., 2008; Bezanson et al., 2009). The latter findings could be consistent with an inside-out evolutionary scenario, where stellar matter is continuously added to the outskirts of the compact high-redshift galaxies as time goes on. However, larger samples of galaxies at different redshifts with well measured density and metallicity radial profiles are required to set definite conclusions (e.g., Cimatti et al., 2008; Bezanson et al., 2009; Hopkins et al., 2009a). In particular, Bezanson et al. (2009, see also Shankar & Bernardi 2009) discussed the results of several basic models for the size and mass evolution of spheroids. Overall, they conclude that galaxies with stellar mass at , should undergo about minor mergers to efficiently increase their sizes by a factor of and mass of to grow onto the local size-mass relation. They also note that their central densities would then be consistent (within a factor of ) with the ones of SDSS galaxies with mass a factor of higher, further supporting the minor merger hypothesis. However, the cumulative number of minor mergers in the B06 model is significantly lower than the one put forward by Bezanson et al. (2009) (see also Shankar et al. (2009c)), and in fact the size increase in the mock massive galaxies presented here is hardly enough to bring them onto the local size-mass relation, as discussed above. Moreover, Nipoti et al. (2009) recently concluded through a series of N-body simulations, that reproducing the growth of a factor of about only through dry mergers is problematic. They find mergers not to efficiently grow galaxies in the required proportion, and to increase the scatter in the galactic scaling relations beyond what allowed by observations. They therefore conclude that observational biases in the measurement of the compact high- galaxy sizes, coupled to extreme fine-tuning in the merger processes, are required to accommodate a pure merger-driven scenario as main driver for the size evolution of ellipticals.
4 DISCUSSION
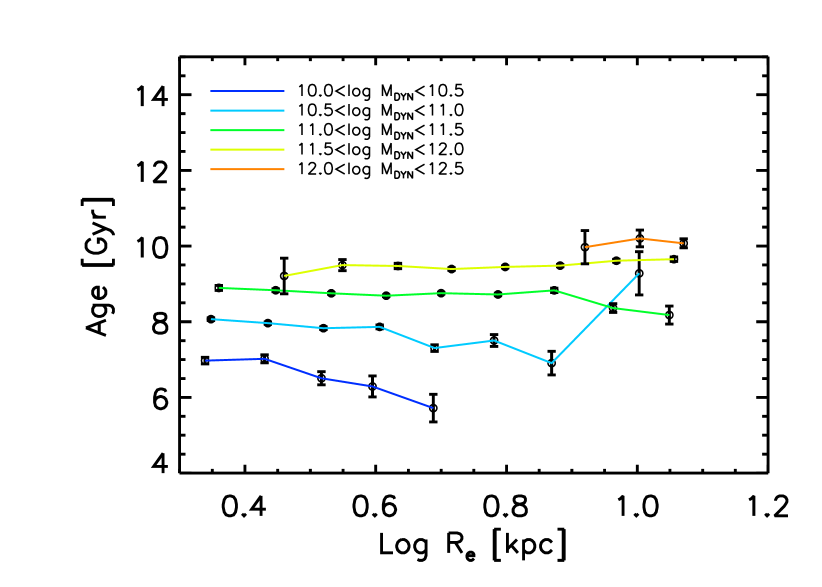
While we were completing this work, we became aware of the study of the age-size relation by van der Wel et al. (2009). They too find that SDSS galaxies show no relation between size and age. Using simple prescriptions for the merger histories of galaxies between their formation redshift and the present, they also conclude that models in which galaxies grow through dry mergers are consistent with the observed evolution since in the mean size and in the co-moving mass density. However, as also recently addressed by Bernardi et al. (2009), there is one important respect in which our results differ from theirs.
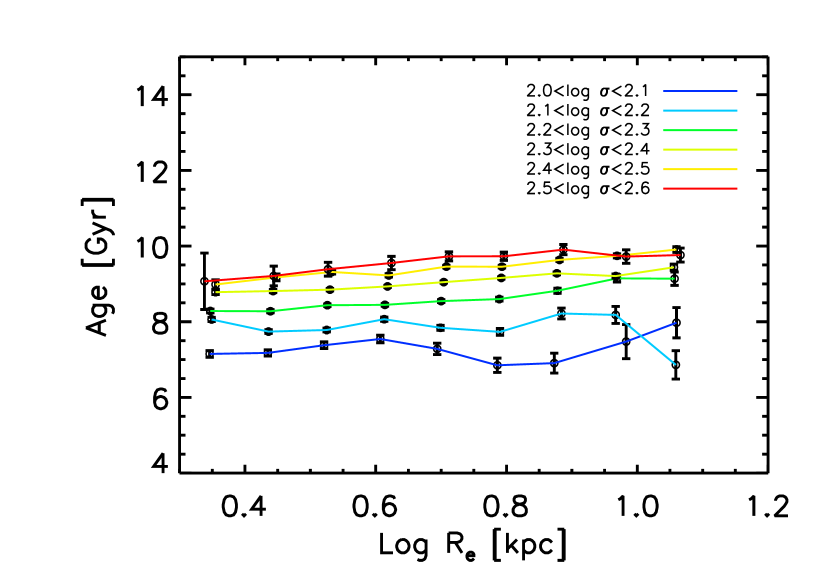
Although we have studied the size as a function of age, their Figure 1 shows the age as a function of size. To enable comparison with their work, our Figure 9 shows this relation at fixed and in our dataset. While we agree with them that, at fixed , this relation is weak, we come to a somewhat different conclusion about this relation at fixed . Whereas they find that, at fixed , smaller galaxies are older, we find no correlation between age and size at fixed . This is consistent with our other results above, if one allows for the fact that and are closely related, so it is a reasonable approximation to substitute one for the other. Bernardi et al. (2009) show that this discrepancy is almost certainly due to the fact that our sample is less contaminated by objects with disks: whereas ellipticals have a flat age-size relation at fixed Mdyn, age and size are anti-correlated for S0s and Sas. This suggests that the two early-type galaxy populations have different formation histories.
5 CONCLUSIONS
We studied the size-mass-age relations as derived from a sample of about 45,700 early-type galaxies selected from SDSS, and compared our results with Bower et al.’s (2006) model of hierarchical galaxy formation. Our results can be summarized as follows.
-
•
At stellar masses below , the effective radius can be up to a factor of lower for older galaxies. However, more massive galaxies all share similar size distributions, irrespective of their ages (Figure 3). At these higher masses, the scatter in sizes at fixed stellar mass is about a factor of 4 ( dex), decreasing with increasing stellar mass (Figure 1). These findings are at variance with a pure passive evolution, which would predict older galaxies to be much more compact at fixed stellar mass.
-
•
Hierarchical galaxy formation models predict that galaxies of the same stellar mass formed at high redshifts are much more compact and dense (Figure 5), in agreement with observations at higher redshift (see § 1). This is both because the high redshift Universe itself is denser, and because dissipation effects are more effective at early times.
-
•
SAMs based on a hierarchical growth of galaxies driven by a first major, wet merger and a sequence of late, minor, dry mergers, predict that these extremely small, high-redshift galaxies can grow, on average, onto the same local size-age relation (Figures 6 and 7). Note, however, that (dry) mergers are not the unique way to increase early-type galaxy sizes. For example, Fan et al. (2008), put forward a model that postulates a strong galaxy expansion caused by the mass loss due to quasar feedback and stellar winds. This model predicts a local size-age relation that is consistent with that one observed in SDSS, at least at lower masses (see further discussion in Shankar & Bernardi 2009) – something which the SAMs are unable to accomplish.
-
•
In the SAMs, galaxies which form at higher redshifts experience more mergers than galaxies which formed more recently, increasing their original sizes by a greater factor than galaxies which formed later. This process almost completely wipes out the monolithic effect, growing all galaxies towards the same size-mass relation today. In particular, although most of the stellar mass is added via major dry mergers, most of the growth in size is through minor dry mergers. Minor mergers (mass ratios ) outnumber major mergers by about a factor of 5 at , and by a factor of 10 at smaller masses (Figure 8 and Table 1).
- •
Acknowledgments
We thank Guinevere Kauffmann, Mike Boylan-Kolchin, Philip Hopkins, David Wake, and Tommaso Treu for interesting discussions. We also thank the referee for several useful comments and suggestions that improved the presentation of the paper. FS acknowledges support from the Alexander von Humboldt Foundation and NASA Grant NNG05GH77G. MB is supported by NASA grant LTSA-NNG06GC19G and NASA ADP/NNX09AD02G. MB and RKS thank the Observatory at Meudon, the APC, Paris-7, and MPI-Astronomie Heidelberg, for hospitality when this work was completed.
References
- Almeida et al. (2007) Almeida C., Baugh C. M., Lacey C. G., 2007, MNRAS, 376, 1711
- Barnes & Hernquist (1991) Barnes J. E., Hernquist L. E., 1991, ApJ, 370, L65
- Baugh et al. (2005) Baugh C. M., Lacey C. G., Frenk C. S., Granato G. L., Silva L., Bressan A., Benson A. J., Cole S., 2005, MNRAS, 356, 1191
- Benson et al. (2007) Benson A. J., Džanović D., Frenk C. S., Sharples R., 2007, MNRAS, 379, 841
- Benson et al. (2003) Benson A. J., Frenk C. S., Baugh C. M., Cole S., Lacey C. G., 2003, MNRAS, 343, 679
- Bernardi (2009) Bernardi M., 2009, MNRAS, 395, 1491
- Bernardi et al. (2009) Bernardi, M., Shankar, F., Hyde, J. B., Mei, S., Marulli, F., & Sheth, R. K. 2009, arXiv:0910.1093
- Bernardi et al. (2008) Bernardi, M., Hyde, J. B., Fritz, A., Sheth, R. K., Gebhardt, K., & Nichol, R. C. 2008, MNRAS, 391, 1191
- Bernardi et al. (2006) Bernardi M. et al., 2006, AJ, 131, 2018
- Bernardi et al. (2005) Bernardi M., Sheth R. K., Nichol R. C., Schneider D. P., Brinkmann J., 2005, AJ, 129, 61
- Bernardi et al. (2003) Bernardi M. et al., 2003, AJ, 125, 1817
- Bezanson et al. (2009) Bezanson R., van Dokkum P. G., Tal T., Marchesini D., Kriek M., Franx M., Coppi P., 2009, ApJ, 697, 1290
- Bond et al. (1991) Bond J. R., Cole S., Efstathiou G., Kaiser N., 1991, ApJ, 379, 440
- Bower et al. (2006) Bower R. G., Benson A. J., Malbon R., Helly J. C., Frenk C. S., Baugh C. M., Cole S., Lacey C. G., 2006, MNRAS, 370, 645
- Buitrago et al. (2008) Buitrago F., Trujillo I., Conselice C. J., Bouwens R. J., Dickinson M., Yan H., 2008, ApJ, 687, L61
- Cappellari et al. (2009) Cappellari M. et al., 2009, ArXiv:0906.3648
- Cattaneo et al. (2006) Cattaneo A., Dekel A., Devriendt J., Guiderdoni B., Blaizot J., 2006, MNRAS, 370, 1651
- Cenarro & Trujillo (2009) Cenarro A. J., Trujillo I., 2009, ApJ, 696, L43
- Chabrier (2003) Chabrier, G. 2003, ApJ, 586, L133
- Chapman et al. (2008) Chapman S. C. et al., 2008, ApJ, 689, 889
- Cimatti et al. (2008) Cimatti A. et al., 2008, A&A, 482, 21
- Ciotti (2009) Ciotti L., 2009, Nuovo Cimento Rivista Serie, 32, 1
- Cirasuolo et al. (2005) Cirasuolo M., Shankar F., Granato G. L., De Zotti G., Danese L., 2005, ApJ, 629, 816
- Cole et al. (2000) Cole S., Lacey C. G., Baugh C. M., Frenk C. S., 2000, MNRAS, 319, 168
- Cook et al. (2009) Cook M., Lapi A., Granato G. L., 2009, ArXiv:0903.2390
- Cowie et al. (1996) Cowie L. L., Songaila A., Hu E. M., Cohen J. G., 1996, AJ, 112, 839
- Croton et al. (2006) Croton D. J. et al., 2006, MNRAS, 365, 11
- Damjanov et al. (2009) Damjanov I. et al., 2009, ApJ, 695, 101
- Davies et al. (1983) Davies R. L., Efstathiou G., Fall S. M., Illingworth G., Schechter P. L., 1983, ApJ, 266, 41
- De Lucia et al. (2006) De Lucia G., Springel V., White S. D. M., Croton D., Kauffmann G., 2006, MNRAS, 366, 499
- De Lucia & Blaizot (2007) De Lucia, G., & Blaizot, J. 2007, MNRAS, 375, 2
- Dekel & Cox (2006) Dekel A., Cox T. J., 2006, MNRAS, 370, 1445
- Di Matteo et al. (2005) Di Matteo T., Springel V., Hernquist L., 2005, Nature, 433, 604
- Dutton et al. (2007) Dutton A. A., van den Bosch F. C., Dekel A., Courteau S., 2007, ApJ, 654, 27
- Faber & Jackson (1976) Faber S. M., Jackson R. E., 1976, ApJ, 204, 668
- Fan et al. (2008) Fan L., Lapi A., De Zotti G., Danese L., 2008, ApJ, 689, L101
- Fontana et al. (2006) Fontana A. et al., 2006, A&A, 459, 745
- Fontanot et al. (2007) Fontanot F., Monaco P., Silva L., Grazian A., 2007, MNRAS, 382, 903
- Franx et al. (2008) Franx M., van Dokkum P. G., Schreiber N. M. F., Wuyts S., Labbé I., Toft S., 2008, ApJ, 688, 770
- Gallazzi et al. (2005) Gallazzi A., Charlot S., Brinchmann J., White S. D. M., Tremonti C. A., 2005, MNRAS, 362, 41
- González et al. (2009) González, J. E., Lacey, C. G., Baugh, C. M., Frenk, C. S., & Benson, A. J. 2009, MNRAS, 397, 1254
- Granato et al. (2004) Granato G. L., De Zotti G., Silva L., Bressan A., Danese L., 2004, ApJ, 600, 580
- Granato et al. (2006) Granato G. L., Silva L., Lapi A., Shankar F., De Zotti G., Danese L., 2006, MNRAS, 368, L72
- Heavens et al. (2004) Heavens A., Panter B., Jimenez R., Dunlop J., 2004, Nature, 428, 625
- Heavens et al. (2000) Heavens A. F., Jimenez R., Lahav O., 2000, MNRAS, 317, 965
- Hopkins et al. (2009a) Hopkins P. F., Bundy K., Murray N., Quataert E., Lauer T., Ma C.-P., 2009a, ArXiv:0903.2479
- Hopkins et al. (2006) Hopkins P. F., Hernquist L., Cox T. J., Di Matteo T., Robertson B., Springel V., 2006, ApJS, 163, 1
- Hopkins et al. (2009b) Hopkins P. F., Hernquist L., Cox T. J., Keres D., Wuyts S., 2009b, ApJ, 691, 1424
- Hyde & Bernardi (2009) Hyde J. B., Bernardi M., 2009, MNRAS, 394, 1978
- Jimenez et al. (2007) Jimenez R., Bernardi M., Haiman Z., Panter B., Heavens A. F., 2007, ApJ, 669, 947
- Khochfar & Silk (2006a) Khochfar S., Silk J., 2006a, ApJ, 648, L21
- Khochfar & Silk (2006b) —, 2006b, MNRAS, 370, 902
- Kormendy (1977) Kormendy J., 1977, ApJ, 218, 333
- Lacey & Cole (1993) Lacey C., Cole S., 1993, MNRAS, 262, 627
- Lapi et al. (2006) Lapi A., Shankar F., Mao J., Granato G. L., Silva L., De Zotti G., Danese L., 2006, ApJ, 650, 42
- Malbon et al. (2007) Malbon R. K., Baugh C. M., Frenk C. S., Lacey C. G., 2007, MNRAS, 382, 1394
- Mancini et al. (2009) Mancini C. et al., 2009, arXiv:0909.3088
- Marulli et al. (2008) Marulli F., Bonoli S., Branchini E., Moscardini L., Springel V., 2008, MNRAS, 385, 1846
- Menci et al. (2004) Menci N., Cavaliere A., Fontana A., Giallongo E., Poli F., Vittorini V., 2004, ApJ, 604, 12
- Menci et al. (2006) Menci N., Fontana A., Giallongo E., Grazian A., Salimbeni S., 2006, ApJ, 647, 753
- Monaco et al. (2007) Monaco P., Fontanot F., Taffoni G., 2007, MNRAS, 375, 1189
- Nipoti et al. (2009) Nipoti C., Treu T., Auger M. W., Bolton A. S., 2009, ApJL, 706, L86
- Parry et al. (2008) Parry O. H., Eke V. R., Frenk C. S., 2008, ArXiv:0806.4189
- Press & Schechter (1974) Press W. H., Schechter P., 1974, ApJ, 187, 425
- Robertson et al. (2006) Robertson B., Bullock J. S., Cox T. J., Di Matteo T., Hernquist L., Springel V., Yoshida N., 2006, ApJ, 645, 986
- Saracco et al. (2009) Saracco P., Longhetti M., Andreon S., 2009, MNRAS, 392, 718
- Sazonov et al. (2005) Sazonov S. Y., Ostriker J. P., Ciotti L., Sunyaev R. A., 2005, MNRAS, 358, 168
- Scannapieco & Oh (2004) Scannapieco E., Oh S. P., 2004, ApJ, 608, 62
- Shankar & Bernardi (2009) Shankar F., Bernardi M., 2009, MNRAS, 396, L76
- Shankar et al. (2009a) Shankar F., Bernardi M., Haiman Z., 2009a, ApJ, 694, 867
- Shankar et al. (2008a) Shankar F., Cavaliere A., Cirasuolo M., Maraschi L., 2008a, ApJ, 676, 131
- Shankar et al. (2008b) Shankar F., Crocce M., Miralda-Escude’ J., Fosalba P., Weinberg D. H., 2008b, ArXiv:0810.4919
- Shankar et al. (2006) Shankar F., Lapi A., Salucci P., De Zotti G., Danese L., 2006, ApJ, 643, 14
- Shankar et al. (2004) Shankar F., Salucci P., Granato G. L., De Zotti G., Danese L., 2004, MNRAS, 354, 1020
- Shankar et al. (2009b) Shankar F., Weinberg D. H., Miralda-Escudé J., 2009b, ApJ, 690, 20
- Shankar et al. (2009c) Shankar F. et al., 2009c, MNRAS, submitted
- Shen et al. (2003) Shen, S., Mo, H. J., White, S. D. M., Blanton, M. R., Kauffmann, G., Voges, W., Brinkmann, J., & Csabai, I. 2003, MNRAS, 343, 978
- Sheth et al. (2001) Sheth R. K., Mo H. J., Tormen G., 2001, MNRAS, 323, 1
- Springel (2005) Springel V., 2005, MNRAS, 364, 1105
- Stewart et al. (2008) Stewart K. R., Bullock J. S., Wechsler R. H., Maller A. H., Zentner A. R., 2008, ApJ, 683, 597
- Tacconi et al. (2008) Tacconi L. J. et al., 2008, ApJ, 680, 246
- Taylor et al. (2009) Taylor E. N., Franx M., Glazebrook K., Brinchmann J., van der Wel A., van Dokkum P. G., 2009, ArXiv:0907.4766
- Thomas (1999) Thomas D., 1999, MNRAS, 306, 655
- Thomas et al. (2005) Thomas D., Maraston C., Bender R., Mendes de Oliveira C., 2005, ApJ, 621, 673
- Trujillo et al. (2009) Trujillo I., Cenarro A. J., de Lorenzo-Caceres A., Vazdekis A., de la Rosa I. G., Cava A., 2009, ArXiv:0901.1032
- Trujillo et al. (2007) Trujillo I., Conselice C. J., Bundy K., Cooper M. C., Eisenhardt P., Ellis R. S., 2007, MNRAS, 382, 109
- Trujillo et al. (2006) Trujillo I. et al., 2006, MNRAS, 373, L36
- van der Wel et al. (2009) van der Wel A., Bell E. F., van den Bosch F. C., Gallazzi A., Rix H.-W., 2009, ArXiv:0903.4857
- van der Wel et al. (2008) van der Wel A., Holden B. P., Zirm A. W., Franx M., Rettura A., Illingworth G. D., Ford H. C., 2008, ApJ, 688, 48
- van Dokkum et al. (2008) van Dokkum P. G. et al., 2008, ApJ, 677, L5
- van Dokkum et al. (2009) van Dokkum P. G., Kriek M., Franx M., 2009, ArXiv:0906.2778
- Vittorini et al. (2005) Vittorini V., Shankar F., Cavaliere A., 2005, MNRAS, 363, 1376
- White (1979) White S. D. M., 1979, MNRAS, 189, 831
- White & Frenk (1991) White S. D. M., Frenk C. S., 1991, ApJ, 379, 52
- Williams et al. (2009) Williams R. J., Quadri R. F., Franx M., van Dokkum P., Toft S., Kriek M., Labbe I., 2009, ArXiv:0906.4786
- Wyithe & Loeb (2003) Wyithe J. S. B., Loeb A., 2003, ApJ, 595, 614
- York et al. (2000) York D. G. et al., 2000, AJ, 120, 1579
- Younger et al. (2008) Younger J. D. et al., 2008, ApJ, 688, 59
- Ziegler et al. (1999) Ziegler B. L., Saglia R. P., Bender R., Belloni P., Greggio L., Seitz S., 1999, A&A, 346, 13