Nebular Spectra and Explosion Asymmetry of
Type Ia Supernovae
Abstract
The spectral signatures of asymmetry in Type Ia Supernova (SN Ia) explosions are investigated, using a sample of late-time nebular spectra. First, a kinematical model is constructed for SN Ia 2003hv, which can account for the main features in its optical, Near-Infrared (NIR), and Mid-Infrared (Mid-IR) late-time spectra. It is found that an asymmetric off-center model can explain the observed characteristics of SN 2003hv. This model includes a relatively high density, Fe-rich region which displays a large velocity off-set, and a relatively low density, extended 56Ni-rich region which is more spherically distributed. The high density region consists of the inner stable Fe-Ni region and outer 56Ni-rich region. Such a distribution may be the result of a delayed-detonation explosion, in which the first deflagration produces the global asymmetry in the innermost ejecta, while the subsequent detonation can lead to the bulk spherical symmetry. This configuration, if viewed from the direction of the off-set, can consistently explain the blueshift in some of the emission lines and virtually no observed shift in other lines in SN 2003hv. For this model, we then explore the effects of different viewing angles and the implications for SNe Ia in general. The model predicts that a variation of the central wavelength, depending on the viewing angle, should be seen in some lines (e.g., [Ni II] 7378), while the strongest lines (e.g., [Fe III] blend at Å) will not show this effect. By examining optical nebular spectra of 12 SNe Ia, we have found that such a variation indeed exists. We suggest that the global asymmetry in the innermost ejecta, as likely imprint of the deflagration flame propagation, is a generic feature of SNe Ia. It is also shown that various forbidden lines in the NIR and Mid-IR regimes provide strong diagnostics to further constrain the explosion geometry and thus the explosion mechanism.
Subject headings:
radiative transfer – nuclear reactions, nucleosynthesis, abundances – supernovae: individual (SN 2003hv) – supernovae: general1. INTRODUCTION
Type Ia supernovae (SNe Ia) provide a powerful tool to investigate the cosmological parameters and the nature of the dark energy (Riess et al. 1998; Perlmutter et al. 1999). Thanks to the uniformity of their optical peak luminosity, once a phenomenological relation between the light curve shape and the peak luminosity is applied, SNe Ia can be used as reliable cosmological distance indicators (Phillips 1993; Phillips et al. 1999).
There is a general consensus that SNe Ia are thermonuclear explosions of a carbon-oxygen white dwarf (WD) (e.g., Nomoto et al. 1994, 1997; Wheeler et al. 1995; Branch 1998; Hillebrandt & Niemeyer 2000). A Chandrasekhar-mass WD has been favored as a progenitor for the majority of SNe Ia (e.g., Höflich & Khokhlov 1996; Nugent et al. 1997; Mazzali et al. 2007).
The thermonuclear runaway starts with the ignition of deflagration bubbles (e.g., Nomoto et al. 1976, 1984). It has been suggested that the deflagration flame may turn into a detonation wave (delayed detonation model, or deflagration-detonation-transition model; Khokhlov 1991; Yamaoka et al. 1992; Woosley & Weaver 1994; Iwamoto et al. 1999; Röpke & Niemeyer 2007b), although the details of the transition have not been clarified yet.
| SN | Phase (Days) | [Ni II]bbWhether the emission line feature at the red end of [Fe II] 7155, which we identify as [Ni II] 7378 (§4 & 5), is detected or not at least at one epoch. | References |
|---|---|---|---|
| 1986G | +103, +257 | Yes | Cristiani et al. (1992) |
| 1990N | +186, +227, +255, +280, +333 | Yes | Gómez et al. (1996) |
| 1991bg | +117, +199 | No | Turatto et al. (1996) |
| 1991T | +258, +284, +316 | No | Gómez et al. (1996) |
| 1992G | +106, +128 | No | Gómez et al. (1996) |
| 1994D | +106 | Yes | Gómez et al. (1996) |
| 1996X | +246 | No | Salvo et al. (2001) |
| 1998aq | +211, +231, +241 | Yes | Branch et al. (2003) |
| 1998bu | +249, +329 | Yes | Cappellaro et al. (2001) |
| 2000cx | +125, +147, +360 | Yes | Li et al. (2001); Sollerman et al. (2004) |
| 2001V | +106 | Yes | Matheson et al. (2008) |
| 2001el | +398 | Yes | Mattila et al. (2005) |
| 2002dj | +275 | Yes | Pignata et al. (2008) |
| 2002er | +216 | No | Kotak et al. (2005) |
| 2003cg | +385 | No | Elias-Rosa et al. (2006) |
| 2003du | +138, +141, +209, +221, +272, +377 | Yes | Anupama et al. (2005); Stanishev et al. (2007) |
| 2003hv | +110, +143, +320, +358, +398ccThe spectra at days and days are the Mid-IR and NIR ones, respectively. | Yes | Leloudas et al. (2009); Gerardy et al. (2007); Motohara et al. (2006) |
| 2004dt | +152 | Yes | Altavilla et al. (2007) |
| 2004eo | +228 | No | Pastorello et al. (2007) |
| 2005cf | +267 | No | Leonard (2007) |
The first deflagration phase may well proceed in a very asymmetric way (Niemeyer et al. 1996; García-Senz & Bravo 2005; Livne et al. 2005; Jordan et al. 2008). The deflagration wave propagates under the work of the buoyancy force, and thus a small perturbation in the progenitor structure could result in a global asymmetry. Rotation and convection in the progenitor WD could provide the seed for this asymmetric deflagration propagation. For example, there is a possibility that the convection in the progenitor WD is dominated by a dipole mode (Woosley et al. 2004), which likely results in highly off-axis ignition and propagation of the deflagration flame (Röpke et al. 2007c; Kasen et al. 2009).
It is, however, observationally challenging to put constraints on the geometry of the explosion. Measurements of polarization suggest that a large global asymmetry does not exist in SNe Ia (Wang et al. 1996), with only a few exceptions (Howell et al. 2001). However, the polarization probes mainly the outer regions of the expanding SN ejecta, at least with the existing telescopes and instruments. The signature of the possible asymmetry in the deflagration phase, however, can only be probed by looking deeper into the innermost regions. In this respect, late-phase ( year past the explosion) spectroscopy can provide an important diagnostics. Following the homologous expansion, the SN ejecta become transparent to optical and longer wavelengths, and thus emission line profiles can be used to probe the distribution of elements that emit the light or that deposit the energy. This strategy has been applied to investigate the aspherical nature of core-collapse SNe from massive stars (e.g., Maeda et al. 2002; Chugai et al. 2005; Mazzali et al. 2005; Maeda et al. 2008; Modjaz et al. 2008; Taubenberger et al. 2009; but see also Milisavljevic et al. 2009).
Probing the explosion geometry of SNe Ia using late-time spectroscopy is still a fairly young field. Höflich et al. (2004) presented Near-Infrared (NIR) spectra for SN Ia 2003du taken with the Subaru telescope. They discussed that a flat-topped profile of the [Fe II] 1.644 emission feature is likely a result of a hole in the distribution of 56Ni. Motohara et al. (2006) added two other Near-Infrared (NIR) spectra for SNe Ia taken with the Subaru telescope (SNe 2003hv, and 2005W). The [Fe II] 1.257 and 1.644 emission lines displayed different profiles, and especially, those in SN 2003hv were blueshifted by km s-1. Motohara et al. (2006) suggested that this can be interpreted as evidence of a global asymmetry in SN 2003hv. Gerardy et al. (2007) also found a similar blueshift, in the [Co III] line detected in their Mid-Infrared (Mid-IR) spectrum of SN 2003hv, taken with the Spitzer Space Telescope. On the other hand, the late-phase optical spectra, available for more than 20 normal SNe Ia, all look very similar to each other, and seem to show little evidence for any asymmetry.
Recently, Leloudas et al. (2009) reported on observations of SN 2003hv, including late-time optical spectra. Thus, it is now for the first time possible to examine a late-time spectrum of a SN Ia all the way from the optical to the Mid-IR. We want to investigate if the kinematical interpretation for the blueshifts in the NIR and Mid-IR forbidden lines of SN 2003hv is consistent with the optical spectrum.
In this paper, we examine late-time spectra of SN 2003hv, using multi-dimensional radiation transfer calculations and a simple kinematic model, and arrive at a plausible explosion geometry of SN 2003hv. Using the structure that was successfully applied to SN 2003hv, we then investigate signatures of the asymmetry and the expected diversity in the late-phase spectra, resulting from various viewing orientations. We also compile published late-time optical spectra of SNe Ia, and investigate to what extent the expected diversity exists in the data. In doing this, we identify a possible signature of the explosion asymmetry in late-time optical spectra of SNe Ia.
This paper is organized as follows. In §2, the observational data of SN 2003hv and other SNe Ia are summarized. In §3, our model and the method of multi-dimensional spectrum synthesis are presented. The results are shown in §4 & 5; §4 focuses on the geometry of SN 2003hv, while the implications for SNe Ia in general are presented in §5. The paper is closed with a discussion and our conclusions in §6. Future observing strategies to further constrain the explosion mechanism are also presented in §6.
2. The Sample of SN Ia Late-Time Spectra
The data set compiled for this work are summarized in Table 1. For SN 2003hv we focus on the optical spectrum at days after maximum brightness, taken with the VLT telescope equipped with FORS1, as reported by Leloudas et al. (2009). There are two more late-time spectra at and days after maximum light (Leloudas et al. 2009), which are briefly discussed in §6. A NIR spectrum of SN 2003hv was obtained on 2004 October 6 with the Subaru telescope equipped with CISCO/OHS (Motohara et al. 2006), 394 days after maximum brightness. Leloudas et al. (2009) generated a combined optical-NIR spectrum mapped to 358 days by scaling the flux in the spectra mentioned above by interpolating optical and NIR photometric points. We also use a Mid-IR spectrum taken by Gerardy et al. (2007), with the Spitzer space telescope at 358 days.
Optical late-time spectra of other SNe Ia are compiled from the SUSPECT database111The Online Supernova Spectrum Archive, ”SUSPECT”, is found at http://bruford.nhn.ou.edu/suspect/index1.html .. We selected data which satisfy two criteria: (1) the spectrum is taken at least 100 days after maximum brightness, and (2) the spectrum covers the wavelength range Å (for this criterion, see §4 & 5). References for the data compiled from the SUSPECT database are listed in Table 1. Adding to this, we have also included SN 2000cx at the later epoch (+ 360 days) from Sollerman et al. (2004), and SN 2001el from Mattila et al. (2005).
3. Multi-Dimensional Spectrum Synthesis
3.1. Model
| 3,500 | 1,500 | 3,000 | 5,000 | 10,000 | 0.1 | 0.1 | 0.2 |
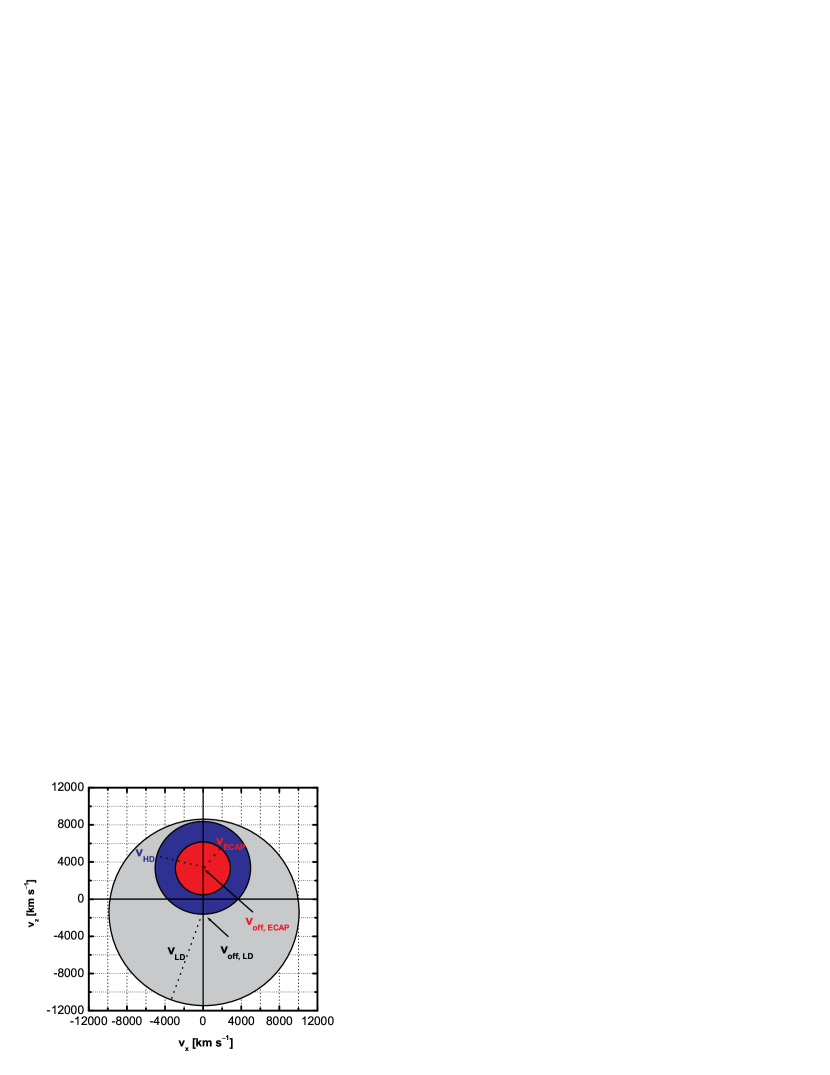
Rather than working with multi-dimensional, detailed hydrodynamic and nucleosynthesis models, we calculate nebular spectra for a simplified kinematic model, and try to obtain constraints on the model parameters from the late-time observations of SN 2003hv. In the model, we have three zones (Fig. 1); the off-set region filled with neutron-rich, Fe-peak elements produced with electron capture reactions (the ECAP zone), the off-set, relatively high density region filled with 56Ni (the HD zone), and the extended, relatively low density region filled with 56Ni (the LD zone). The model parameters are the following:
-
•
: The off-set velocity of the ECAP- and the HD-zones, with respect to the zero-velocity center of the ejecta. It is assumed that the off-set velocity is the same for the ECAP- and the HD-zones for simplicity.
-
•
: The off-set velocity of the LD zone, with respect to the zero-velocity center.
-
•
, , : The outer velocities of the ECAP-, HD-, and the LD-zones, respectively. The distribution of the elements and the density is assumed to be homogeneous within each region, with spherical symmetry with respect to the off-set position (but the HD/LD zone has a hole corresponding to the ECAP/HD zone).
-
•
, , : The mass in each region.
In each zone, the initial abundance is set as follows; In the ECAP-zone, 10% of the mass is in 56Ni, and the remaining 90% is in stable 58Ni. The other regions are assumed to fully consist of 56Ni. 56Ni decays to 56Co and then to 56Fe, and thus the synthetic spectra are a mixture of forbidden lines of Ni, Co, and Fe. The masses are varied so that the model can roughly reproduce the total flux as well as the fluxes of the emission lines of interest, as compared with the late-time spectra of SN 2003hv. The outer velocities are set so that the predicted line widths are consistent with the observed widths. The off-set velocities affect the wavelength centers of various emission lines.
Note that this model represents only the inner regions of the ejecta, and does not include the outer regions (i.e., the regions dominated by intermediate mass elements), since the outer regions contribute little to the late-time emission. Detailed model fit to all the spectral features is beyond the scope of this paper, as is evident from the simplifications in our model. Also, the ejecta probably have a clumpy structure as well in realistic multi-D explosions, while such an effect is not included in the present study (see, e.g., Leloudas et al. 2009).
The model is constructed to represent the main features of hydrodynamic explosion models, especially of the delayed-detonation model. The initial deflagration produces neutron-rich Fe-peak elements with electron capture reactions, and then 56Ni as the density decreases at the deflagration front (e.g., Nomoto et al. 1984; Iwamoto et al. 1999; Brachwitz et al. 2000). We therefore regard the ECAP-zone and the HD-zone as the products of the early deflagration phase (but see §6 for another scenario to create the off-center ECAP-zone). The subsequent detonation produces a relatively low-density 56Ni-rich region (the LD-zone). The distribution of the detonation products is expected to be more or less spherical (Röpke & Niemeyer 2007b; Kasen et al. 2009; Maeda et al. 2009c). We still allow for a small off-set (opposite to the deflagration) for the LD-zone, since the detonation may well be stronger in the direction where a larger amount of fuel is left after the deflagration phase.
3.2. Multi-Dimensional Spectrum Synthesis
The input model is mapped onto a three-dimensional Cartesian grid, with zones. Three-dimensional nebular spectrum synthesis calculations are then performed, using the -ray transfer module (Maeda 2006a) and the nebular spectrum synthesis module (Maeda et al. 2006c) of the SAMURAI code – the SupernovA MUlti-dimensional RadIation transfer code222The SAMURAI is a compilation of 3D codes adopting Monte-Carlo methods to compute the high-energy light curve and spectra (Maeda 2006a), optical bolometric light curve (Maeda et al. 2006b), and optical spectra from early (Tanaka et al. 2006, 2007) to late phases (Maeda et al. 2006c).. As a reference, we have also performed one-dimensional nebular spectrum synthesis for the classical, deflagration model W7 (Nomoto et al. 1984).
Details of the calculation method are given in Maeda (2006a) (for -ray transport), Mazzali et al. (2001) (for one-zone nebular spectrum synthesis), and Maeda et al. (2006c) (for multi-dimensional spectrum synthesis). Good reviews on the nebular spectrum synthesis are given by e.g., Axelrod (1980), Ruiz-Lapuente & Lucy (1992), Kozma & Fransson (1998ab), and Liu et al. (1998).
The -rays emitted by the decay chain 56Ni 56Co 56Fe produce non-thermal high energy electrons mainly by Compton scatterings, and the electrons give rise to impact ionization and excitation. The energy is also lost in thermalization and heating of the ejecta, through interactions with thermal electrons. An additional energy input comes from positrons emitted by the radioactive decays, with a stopping length much shorter than -rays. In our calculations, it is assumed that the positrons are fully trapped on the spot. The deposition of -rays and non-thermal positrons is the dominant heating process in the SN ejecta.
At late phases, the heating is balanced by cooling from various thermal-collisionally excited emission lines, mostly forbidden. The non-thermal excitation is neglected in our calculations. The non-thermal impact ionization is balanced with recombination. As the density is low following the expansion, and the energy input is not dominated by thermal photons, the resulting ionization stages and level populations are generally not in Local Thermodynamic Equilibrium (LTE). For a given (thermal) electron temperature (), the ionization-recombination balance is solved (without photoionization in our calculations; see Sollerman et al. 2004), providing the electron density () and ionization stages for each element. Once the ionization stage and the electron density are given, detailed balances for level populations are solved for each ion, under the condition of global heating-cooling balance. The balance then provides the electron temperature, as well as the resulting emission-line spectrum. In our numerical calculations, the ionization balance and the detailed balance for level populations are solved iteratively, until the electron density and temperature converge at every mesh point.
The spectrum is sampled into 19 zenith angles, divided by 10 degrees each. The wavelength resolution in sampling the final spectrum corresponds to km s-1, roughly the same width as the spatial resolution of the input model. Note that any structure in the synthetic spectrum below this resolution is not reliable.
4. SN 2003hv
4.1. Model Overview
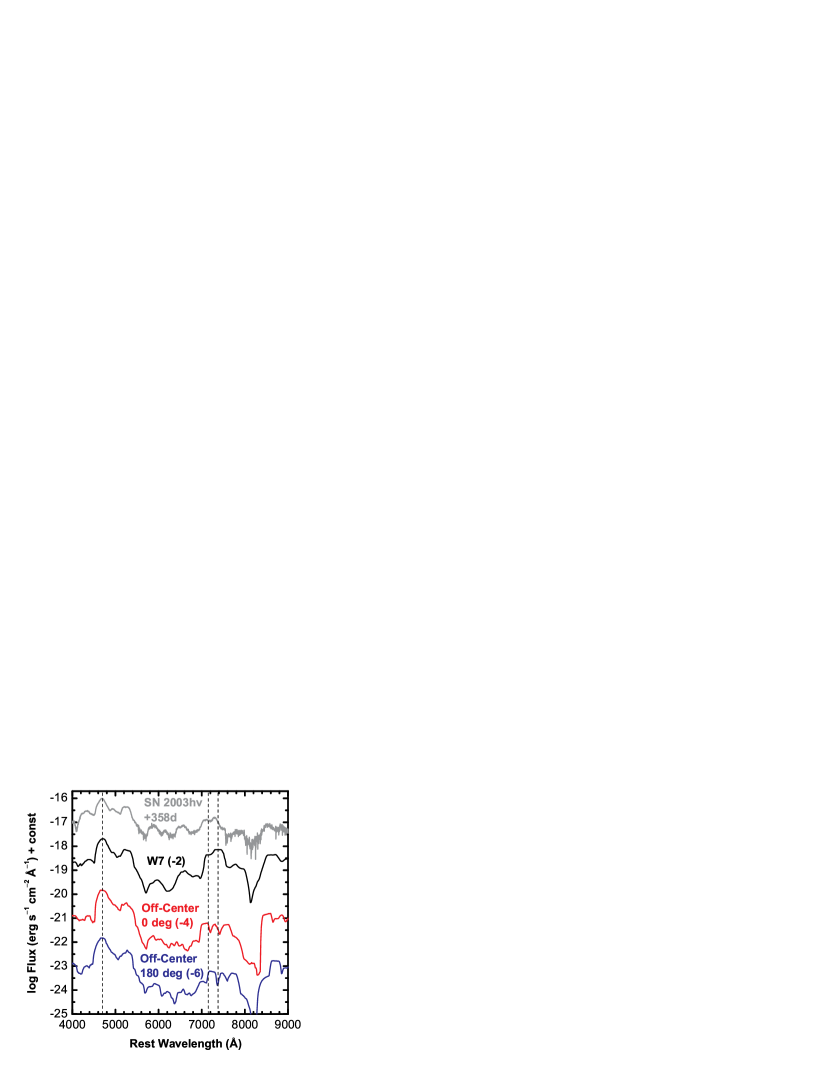
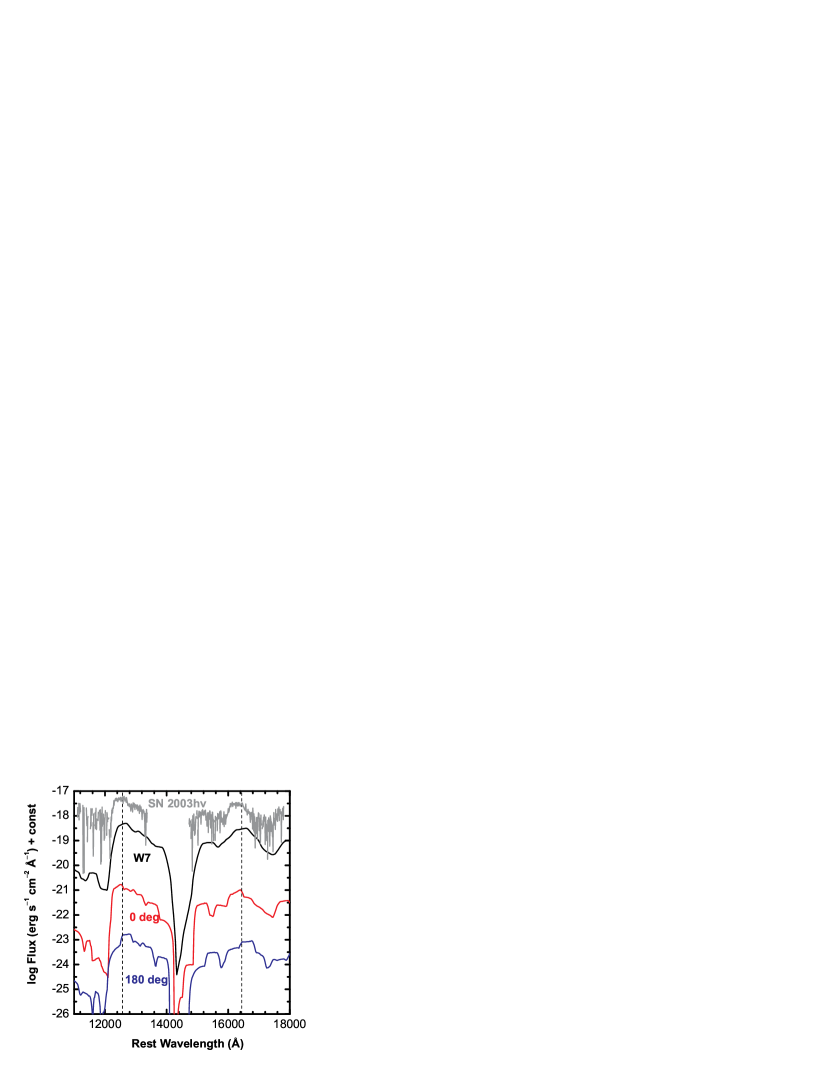
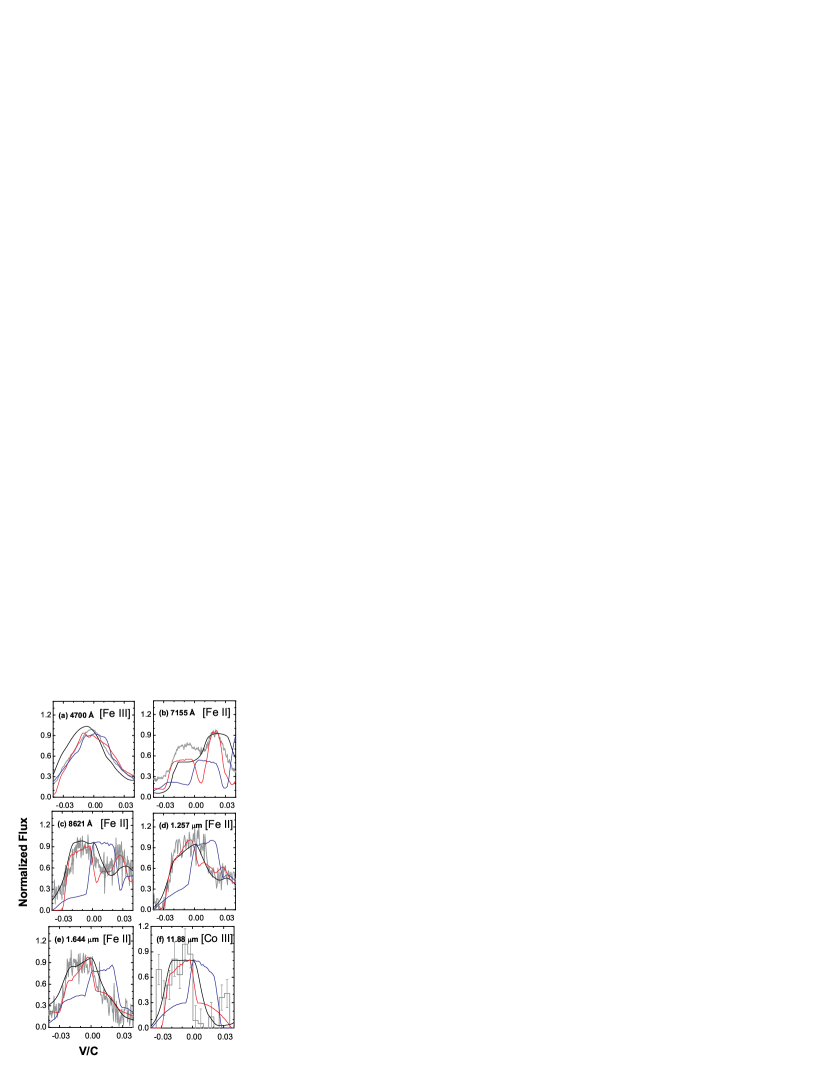
Figures 2 and 3 show synthetic spectra for the W7 and our off-set model (Fig. 1), in the optical (Fig. 2) and in the NIR (Fig. 3), at 375 days after the explosion. In these figures, we show the observed spectrum at 320 days (optical) and 398 days (NIR) after the maximum, but with the flux calibrated to 358 days by Leloudas et al. (2009). Figure 4 shows the comparison of line profiles for some selected emission lines. The model parameters are summarized in Table 2.
Despite the simplification, the kinematic model can account for the presence of the major emission lines in the late-phase spectrum of SN 2003hv, and therefore also for those of SNe Ia in general, as do the W7 model (see Axelrod 1980, who showed that the main features of a SN Ia nebular spectrum can be modeled by a simple, homogeneous 56Ni-rich sphere). The observed flux, especially in the NIR, is smaller than that predicted by the W7 model, and consistent with that in the kinematic model. This means that the mass of 56Ni is in SN 2003hv, smaller than the typical value in SNe Ia (, e.g., Mazzali et al. 2007) and than the W7 value (). This value is roughly consistent with that estimated from the peak luminosity () (Leloudas et al. 2009). We note that this is also related to relative contributions from different zones in our model, indicating that the W7 model has too much high density, low temperature materials to be consistent with the NIR flux.
| Zone | Fe+ FractionbbThe fraction of Fe+. The remaining fraction is in Fe++. | ||
|---|---|---|---|
| ECAP | 2,000 | 5.7 | 90% |
| HD | 7,000 | 5.4 | 30% |
| LD | 11,000 | 4.8 | 5% |
In Figures 2 and 3, the expected rest wavelengths of some selected emission lines are marked by lines: [Fe III] blend at 4700Å, [Fe II] 7155, and [Ni II] in the optical (Fig. 2), [Fe II] 1.257 and [Fe II] 1.644 in the NIR (Fig. 3). As found by Motohara et al. (2006), the observed NIR emission features are blueshifted as compared to those predicted by a spherically symmetric model like W7. Leloudas et al. (2009) pointed out that [Fe II] 7155 and [Fe II] also show a similar amount of blueshift as compared to the expected wavelength. Furthermore, they suggested that [Fe II] 8621 can be one of the best and cleanest lines to follow the geometry of the explosion.
We here suggest that the feature at Å is dominated by [Ni II] 7378, and then note that this feature is also blueshifted as compared to the expected position. At the same time, features in the blue part of the optical spectrum, e.g., at Å and Å, do not show the blueshifts.
This is more clearly seen in Figure 4, where the synthetic spectrum for the W7 model is artificially shifted in wavelength, by km s-1 to the blue, to fit the NIR features (see Motohara et al. 2006). The blueshift seen in [Fe II] is also explained by the same model. However, the features in the blue ( Å) should also shift to the blue, and no longer fit the observed wavelengths.
The inconsistency in the wavelengths is a strong argument against a simple, bulk off-set model as the origin of the wavelength shift in the NIR (and at Å). Our 2D model (though computed in 3D) was constructed to overcome this inconsistency. As shown in Figures 2 - 4 (especially evident in Figure 4), the observed wavelengths of strong lines, in the optical, NIR, and Mid-IR wavelengths are all well explained by our model, with the viewing orientation close to the direction of the off-set.
4.2. Ionization/Thermal Structure and Line Shift
| Wavelength () | Ion | Term | (cm-1)bbThe upper energy level of the transition. | ShiftccShift in the wavelength depending on the viewing angle. | RegionddRegion which makes the predominant contribution. |
|---|---|---|---|---|---|
| 0.4658 | Fe III | 5D4 - F4 | 21462.2 | No | LD |
| 0.4701 | Fe III | 5D3 - F3 | 21699.9 | No | LD |
| 0.4734 | Fe III | 5D2 - F2 | 21857.2 | No | LD |
| 0.5262 | Fe II | a4F7/2 - a4H11/2 | 21430.4 | No | LD |
| 0.7155 | Fe II | a4F9/2 - a2G9/2 | 15844.7 | Yes | HD |
| 0.7378 | Ni II | 2D5/2 - 2F7/2 | 13550.4 | Yes | ECAP |
| 0.8617 | Fe II | a4F9/2 - a4P5/2 | 13474.4 | Yes | HD |
| 1.257 | Fe II | a6D9/2 - a4D7/2 | 7955.3 | Yes | HD |
| 1.644 | Fe II | a4F9/2 - a4D7/2 | 7955.3 | Yes | HD |
| 2.218 | Fe III | 3H6 - 3G5 | 24558.8 | No | LD |
| 2.348 | Fe III | 3H5 - 3G5 | 24558.8 | No | LD |
| 2.874 | Fe III | F3-3G3 | 24940.9 | No | LD |
| 2.904 | Fe III | F3-3G3 | 25142.4 | No | LD |
| 3.228 | Fe III | F4-3G5 | 24558.8 | No | LD |
| 4.114 | Fe II | a6D9/2 - a4F7/2 | 2430.1 | Yes | HD + ECAP |
| 4.606 | Fe II | a6D5/2 - a4F5/2 | 2838.0 | Yes | HD + ECAP |
| 4.888 | Fe II | a6D1/2 a4F3/2 | 2430.1 | Yes | HD + ECAP |
| 5.339 | Fe II | a6D9/2 - a4F9/2 | 1872.6 | Yes | HD + ECAP |
| 6.634 | Ni II | 2D5/2 - 2D3/2 | 1506.9 | Yes | ECAP |
| 7.350 | Ni III | 3F4 - 3F3 | 1360.7 | Yes | ECAP |
| 10.52 | Co II | a3F4-a3F3 | 950.51 | Yes | HD |
| 10.67 | Ni II | 4F9/2 - 4F7/2 | 9330.0 | Yes | ECAP |
| 11.00 | Ni III | 3F3 - 3F2 | 2269.6 | Yes | ECAP |
| 11.88 | Co III | a4F9/2 - a4F7/2 | 841.2 | Yes | HD + LD |
| 12.72 | Ni II | 4F7/2 - 4F5/2 | 10115.7 | Yes | ECAP |
| 14.74 | Co II | a5F5-a5F4 | 4029.0 | Yes | HD |
| 17.93 | Fe II | a4F9/2 - a4F7/2 | 2430.1 | Yes | HD + ECAP |
These model results can be understood on the basis of the ionization and thermal structure. Table 3 shows the typical electron temperature, electron density, and ionization stage in each of the zones. The ECAP-zone is in a low ionization state (mostly singly-ionized species), because of the small energy input (inefficient ionization) and high density (efficient recombination). Despite the low ionization state, the electron density is high (because of large material density). The electron temperature is accordingly low. In the LD-zone, the situation is the opposite. It is in a high ionization state (mostly doubly-ionized), the electron density is small and thus the electron temperature is kept as high as K. The HD-zone has properties intermediate between these two zones.
The characteristic strong emission lines in the synthetic spectrum are summarized in Table 4. The strong feature at Å is a blend of several [Fe III] lines, all of which are formed under the high ionization and high temperature condition. The feature is thus dominated by emissions from the extended LD zone, which is distributed in an approximately spherical way. Therefore, the feature at Å does not show a large velocity shift. The [Fe II] and , on the other hand, come from the low ionization and low temperature conditions, and thus are emitted mostly from the off-set HD-zone. Therefore, these NIR [Fe II] lines show a large blueshift if viewed from the direction of the off-set. [Ni II] 7378 is emitted from the ECAP zone (i.e., 58Ni), and show a large velocity shift. Contribution from radioactive 56Ni to this line is negligible at these late phases because of the short decay time scale.
The behavior of other [Fe II] lines in the optical range can be understood in the same manner, but is complicated by a competition between the ionization and temperature effects. [Fe II] and 8621 show the velocity shift, as these are mostly emitted from the HD-zone. This is due to the low ionization in this zone. On the other hand, the feature at Å does not show a large shift (Fig. 2), which is not interpretable by the ionization effect alone. The strongest line in this feature is [Fe II] 5262. The excitation temperature for this line is high, and thus the high temperature in the LD-zone is preferred, despite the small amount of Fe+ present there. Also, the contribution of [Fe III] 5270 from the LD-zone is not negligible. As a result, the large contribution to the emission feature at Å comes from the LD-zone. This explains why this feature does not show a large velocity shift.
[Co III] is a ground state transition with an excitation temperature of only K, much lower than the temperatures in either the HD or LD-zone. In addition, the fraction of the ”doubly”-ionized Co is similar between these two zones (unlike the singly-ionized Co). The LD and HD zones thus provide comparable contributions to the [Co III] feature. As a result, the line profile is a combination of a broad component centered at the rest wavelength and a relatively narrow component whose central wavelength is blueshifted if viewed from the off-set direction. Because of the strong narrow component, the line as a whole shows a velocity shift, depending on the viewing direction.
5. Signatures of Explosion Asymmetry in SNe Ia in General

In §4, we have shown that the somewhat puzzling features in the late-time spectra of SN 2003hv, i.e., some lines showing a blueshift while others showing no velocity shift, can be explained by a geometrical effect. In this section, we expand the discussion in §4; we investigate the explosion geometry of SNe Ia in general. We also present diagnostics of the geometry using NIR and Mid-IR lines (Tab. 4), for existing as well as for future observatories such as JWST (James Webb Space Telescope) or SPICA (SPace Infrared telescope for Cosmology and Astrophysics mission).
5.1. [Ni II] 7378 as diagnostics of the deflagration phase
It has been believed that signatures of ejecta asymmetry are not evident in the optical range (§1 and §5.2). Figure 5 shows the feature around Å, i.e., [Fe II] (with some contribution from [Fe II] ) and [Ni II] 7378, for the 12 SNe Ia (Table 1; see below).
Contrary to the earlier expectation, we find that there is indeed a probable signature of ejecta asymmetry. As shown in Figure 5, the feature shows a variation in the central wavelength (after removing the host galaxy redshift). In many cases, the shift is larger than km s-1, which is too much to be due to a peculiar motion of the SN progenitor with respect to the host center. The [Fe II] and [Ni II] always show a similar degree of the wavelength shift.
Both blueshifts and redshifts exist, and the shift does not appear to correlate with the age of the SN (see §6 for further discussion). These observed characteristics suggest that the shift is not caused either by radiation transfer effects or by other unidentified emission lines. Thus, the mounting evidence is that the variation of the central wavelengths represents a real variation in the line-of-sight velocity of the region emitting [Fe II] 7155 and [Ni II] 7378.
As shown in §4, these lines are emitted from deep parts of the ejecta: [Fe II] 7155 from the HD-zone and [Ni II] 7378 from the ECAP-zone in our model. We point out that especially the [Ni II] should preserve important information on the explosion dynamics, since the ECAP-zone is attributed to the region created by the initial deflagration (or, the detonation passing through the central region of the white dwarf if the initial deflagration is very weak; §6), with efficient electron capture reactions. This is supported by the relatively narrow width ( km s-1) of the [Ni II] line.
One may argue that the central wavelength of the [Ni II] 7378 could apparently shift to the blue because the blue wing of this feature is contaminated by the [Fe II] (and by [Ca II] 7291, 7307, although it does not likely contribute much333We have not included Ca in our model. The W7 model predicts that the contribution from [Ca II] 7291, 7307 is about 10% (Leloudas et al. 2009). Also, the W7 model predicts broad [Ca II] which is not compatible to the observed relatively narrow emission features.). To check this, we tried to obtain intrinsic profiles of the [Ni II] line by subtracting the possible contamination of other lines, especially in the blue wing (Fig. 5). Practically, we assumed a (pseudo)-continuum connecting the flux minima on both side of Å (the blue minimum corresponds to the valley between the [Fe II] and [Ni II]). This continuum flux generally decreases towards the red, and thus subtracting it could result in a shift of the peak wavelength to the red to some extent. However, we found that this effect is small, as compared to the observed variation.
Another possible concern is the simplified abundance distribution in our model, in which the HD and LD-zones are assumed to contain no stable Ni. Even without electron captures realized in the early deflagration phase, some amount of 58Ni should be produced in the region where 56Ni is the dominant burning product. The typical mass fraction of 58Ni in such a region is for solar metallicity (e.g., Iwamoto et al. 1999; Timmes et al. 2003). To check the effect, we replaced 5% of the material by 58Ni in the model and repeated the calculations. We thereby confirmed that the result is not defeated by this change, and that [Ni II] 7378 emitted from the HD/LD-zones is negligible as compared to that from the ECAP-zone.

The [Ni II] line is not always strong in the observed spectra of SNe Ia. We find that 12 SNe Ia (Fig. 5) show this feature among the 20 SNe we investigated (Table 1). The number of SNe Ia, showing the [Ni II] 7378 stronger than the [Fe II] 7155 is even smaller. Although [Ni II] 7378 is mainly emitted from the ECAP-zone in our present calculations, the contribution from the HD/LD regions may not be negligible in case of larger and/or . Also, with an increasing amount of 56Ni, [Fe II] 7388 and [Fe II] 7452, could hide the [Ni II] feature. Thus, the observed diversity in the detection of the [Ni II] may indicate that varies among objects (e.g., Mazzali et al. 2007).
5.2. [Fe III] blend as diagnostics of the outer region
In Figure 6, we show line profiles of the same sample of SNe Ia, but centered at Å. Unlike the [Ni II] 7378, there is no large variation. The absence of a significant wavelength shift has been a strong argument against any global asymmetry in SNe Ia, since this feature is the strongest in SN Ia nebular spectra and has thus naturally been used to infer the geometry.

This feature is a blend of several [Fe III] lines, with the wavelength separations smaller than the typical line width (10,000 km s-1); [Fe III] 4658, [Fe III] 4701, [Fe III] 4734, [Fe III] 4755, [Fe III] 4769, and [Fe III] 4778. As a result of the blending, the central wavelength of the feature is Å. Note that this central wavelength is not sensitive to underlying models as long as spherically symmetry is assumed, since the excitation temperature of these lines are all similar and thus the relative contribution is basically determined by the transition probabilities.
With the central wavelength of Å, no redshifts are observed in these SNe Ia. There are, on the other hand, some SNe Ia showing small blueshifts in this feature. This argues against the idea that the wavelength shifts here are caused by a geometrical effect. We note that the SNe Ia that show relatively large blueshifts ( km s-1) are mostly young objects (the spectra taken before day +200) – SNe 2004dt (+152), 1990N (+186), 1994D (+106), 2000cx (+147), and 2001V (+106). The central wavelength of the 4,700Å feature in spectra taken at days is clustered at the expected wavelength ( Å). This is further discussed in §6. We conclude that the wavelength shift in the Å feature is not caused by geometric effects, but by either a radiation transfer effect or contamination from other lines, e.g., Mg I] 4571.
The behavior that the [Fe III] blend is always at 4,700Å in sufficiently late phases ( +200 days) can be understood from our model results. Since this blend is emitted from the LD zone, it indicates that the LD zone is more spherically distributed than the inner ECAP and HD zones.
5.3. NIR [Fe II] lines as a promising tool to investigate the geometry
Figure 7 shows a similar analysis for the NIR (J and H) [Fe II] features – [Fe II] and . As discussed in §4, these lines are mostly emitted from the HD-zone, and thus show a large variation as a function of the viewing angles.
Not many observational data are available for these NIR lines, because of the difficulty raised by the OH airglow lines. In Figure 7 we show the data presented by Motohara et al. (2006). NIR spectra for two other SNe Ia have been reported: SN 1991T (Bowers et al. 1997) and SN 1998bu (Spyromilio et al. 2004). The [Fe II] line in SN 1991T is almost symmetric with respect to the rest frame of the host galaxy, while SN 1998bu seems to show a small degree of blueshift.
In principle, it is favorable to check the consistency of the wavelengths of various lines, as we have done for SN 2003hv. [Fe II] in SN 2003du seems to show some blueshift (Höflich et al. 2004; Motohara et al. 2006), although the Signal-to-Noise ratio (S/N) is not good. [Ni II] 7378 in SN 2003du is only marginally detected (Fig. 5), and the poor S/N makes it difficult to determine the exact position of the center of the line. In SN 1998bu, [Ni II] 7378 is relatively well identified with better S/N than in SN 2003du, and it shows km s-1 of the blueshift, at least qualitatively in agreement with the NIR observation.
5.4. Mid-IR lines as a new probe
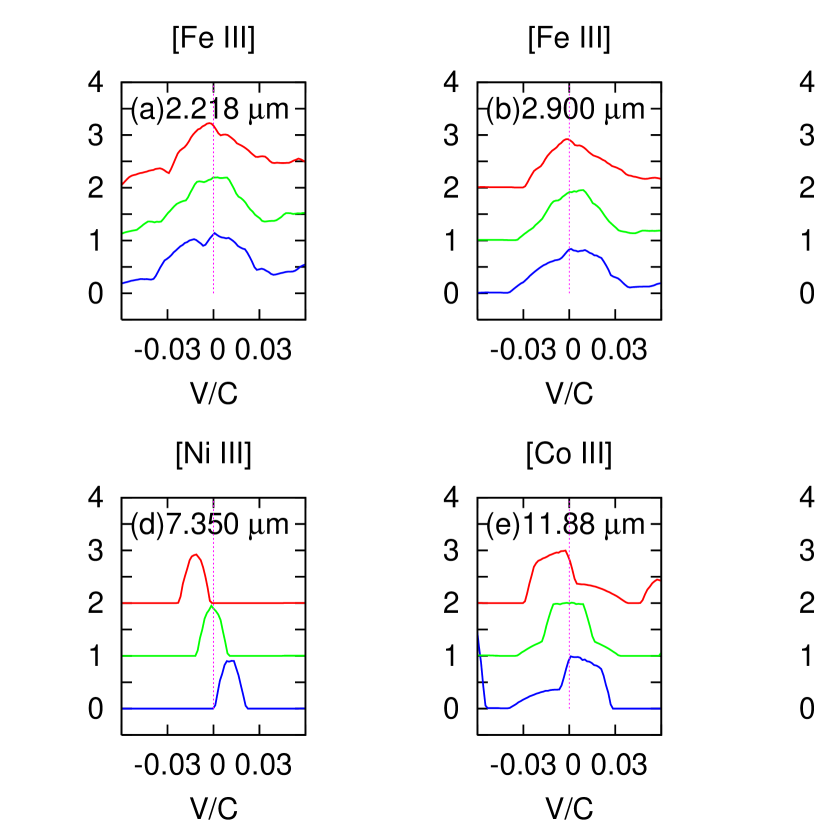
In the mid-IR wavelength range, there are various isolated forbidden lines of Fe, Co, and Ni. There are also lines from intermediate mass elements such as [Ar II] and [Ar III] (Gerardy et al. 2007), which are not included in our model. For these longer wavelengths, lines tend to be more isolated, and thus hardly affected by a line blending. The lines in the mid-IR therefore provide a direct view on the geometry of the emitting region.
In Figure 8, some selected lines synthesized in our model are shown. Emission features at and are both dominated by [Fe III] with an excitation temperature of K. Thus, these lines behave in the same way as the [Fe III] blend at 4,700Å; virtually no wavelength shift is seen, irrespective of the viewing orientation.
The behavior of [Ni II] is basically the same as in [Ni II] 7378. This line provides a very strong diagnostics on the geometry of the initial deflagration phase, even better than [Ni II] 7378: (1) the excitation temperature is only a few 1,000 K (thus no doubt it is emitted from the ECAP-zone where not much heating is taking place), and (2) there is no blending with other lines. These effects are already taken into account in the analysis of [Ni II] 7378, but [Ni II] can provide the the same diagnostics in a more model-independent way.
On the other hand, the analysis of [Ni III] may be complicated by the competition between the high ionization and low excitation temperature. In our model, it is dominated by the emission from the ECAP-zone. We have confirmed that adding a representative amount of 58Ni in the HD/LD-zones does not affect our result (§5).
[Co III] has already been discussed in §4, in the context of SN 2003hv. From Figure 8, it is seen that this line has two components; a broad symmetric feature arising from the LD zone and a narrow component from the HD-zone. The former is always at the rest wavelength, but the latter shows a variation in the central wavelength as a function of the viewing angle. The relative strength may well vary depending on /. In the present model, the ratio is set by the requirement that the fluxes in the blue part of the optical range (mainly emitted from the LD-zone) and in the NIR (mostly from the HD zone) should be consistent with the observed spectra of SN 2003hv.
[Fe II] behaves in a way similar as [Fe II] . A large variation in the central wavelength is seen. One important difference is that we do see a contribution from the ECAP-zone. Because of the low excitation temperature of [Fe II] , this comes from a small amount of the decay product of 56Ni in the ECAP-zone where the electron temperature is low. As a result, this line does not show a flat-topped profile, as seen in [Fe II] (§6 for further discussion).
6. Discussion and Conclusions
6.1. Summary
In this paper, we have investigated the geometry of the innermost region of SNe Ia, which should provide information on the explosion mechanism. We have shown that some enigmatic properties observed in the late-time optical, NIR, and Mid-IR spectra of SN Ia 2003hv – that some emission lines show blueshift while others do not – can in fact be naturally explained by a simple kinematic model, if the viewing angle is close to the direction of the off-set. In this model, the high density regions (the ECAP-zone dominated by stable Fe-peak elements, and the HD-zone dominated by 56Ni) are off-set with respect to the center of the expansion by km s-1, and are surrounded by a less asymmetric, low density 56Ni-rich region (the LD-zone).
Table 4 summarizes the expected qualitative behavior of strong emission lines in late-time nebular SN Ia spectra. Forbidden lines from ions with high ionization stage and/or high excitation temperature are mostly emitted from the outer, ”spherical” LD-zone. Such lines show little variation in the central wavelength, irrespective of the viewing angle. On the other hand, lines from ions with low ionization stage and/or low excitation temperature are generally emitted from the inner, ”off-set” ECAP- or HD-zones. These lines show a strong variation in the central wavelength as a function of the viewing angle.

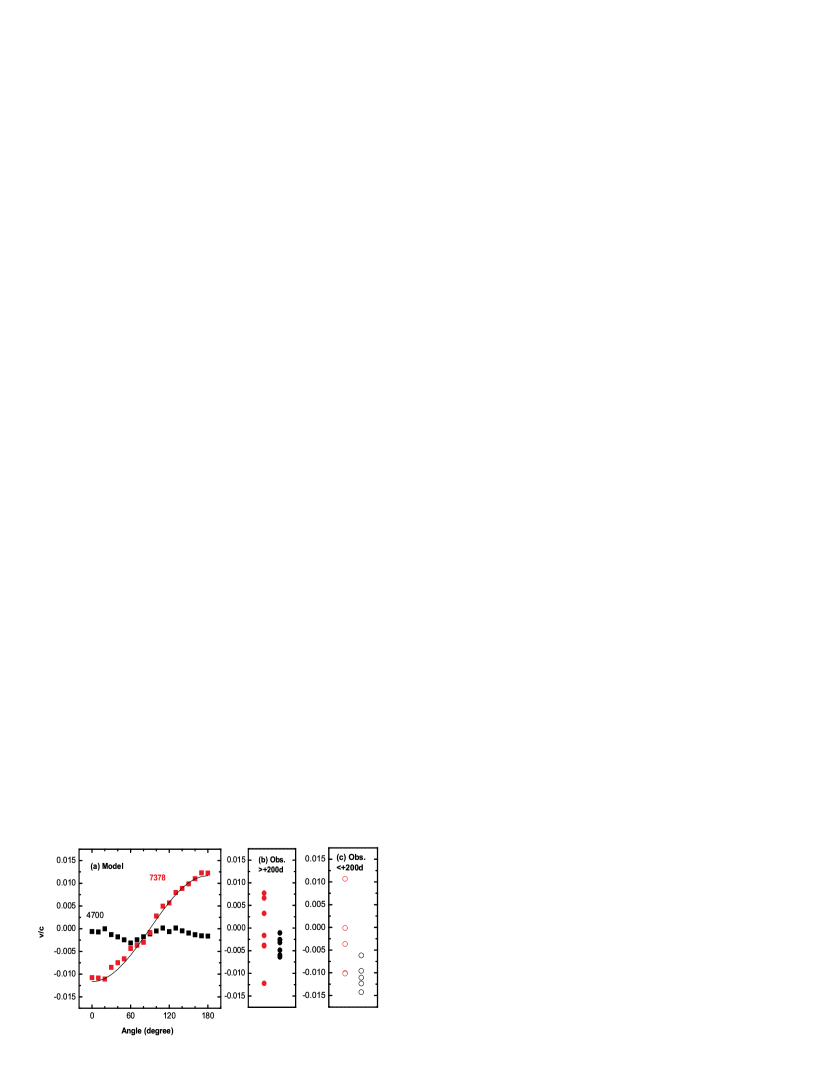
Encouraged by this finding, we have investigated available optical late-time spectra of SNe Ia compiled mostly from the SUSPECT archive. Figure 9 summarizes our results from the model calculations, and the measurements in the 12 observed SNe Ia sample. From the model, we see that the variation in the central wavelength of [Ni II] 7378 basically follows the simple kinematic expectation. Note, however, for a precise prediction of the behaviors of emission lines, relative contributions from the different zones have to be considered, which further depend on the ionization structure, the electron temperature and the density. For [Ni II] 7378, the effects of these details turn out to be relatively small, but some lines are indeed affected by these complications (§5). We have provided an explanation on the observational behavior that [Ni II] 7378 shows the diversity in the central wavelength while [Fe III] blend at 4,700Å does not: they trace different zones, and the inner ECAP and HD zones have the large off-set while the outer LD zone does not.
We suggest that [Ni II] 7378 to be one of the few lines at optical wavelengths to provide strong diagnostics of the innermost region of SNe Ia. Among the 20 SNe Ia, about half of them (12 SNe) show a probable detection of this feature. Similar diagnostics can be obtained by [Fe II] as well. Thus, the spectra in the wavelength range of Å should provide useful diagnostics of the explosion asymmetry. With present instrumentation, these features can be more easily observed than other strong indicators in the NIR and Mid-IR regime. A late-time spectrum of an overluminous SN Ia 2006gz (Hicken et al. 2007) also shows a hint of the possible blueshift in these features (Maeda et al. 2009b). However, the spectrum is very noisy and the identification is not secure. Also, the spectrum was peculiar in a sense that it did not show the strong features in the blue (i.e., at Å). For these reasons, we have not included SN 2006gz in our analysis, despite the possible importance of asphericity in this object (Hillebrandt et al. 2007; Sim et al. 2007; Maeda & Iwamoto 2009a).
The geometry we derived could naturally arise in SN Ia explosions. The initial deflagration may proceed in a very asymmetric way, while the subsequent detonation is expected to leave 56Ni more spherically distributed. An important question is whether the geometry suggested for SN 2003hv represents a special case or a general structure of SN Ia explosions. Figure 10 shows the distribution of 12 SNe Ia, as a function of the velocity shift in [Ni II] 7378. Although the sample is small, the general agreement between the observations and the expectation assuming the geometry of SN 2003hv as a generic feature of SN Ia explosions, is very encouraging. From this analysis, it seems that SN 2003hv may not be very different from other SNe Ia, and its largest velocity shifts can be attributed to the viewing angle effect.
6.2. Temporal Evolution

We have found that the line center of [Ni II] 7378 does not correlate with the epoch at which the spectrum was taken. Therefore, the line velocity shift should reflect the intrinsic geometry and variation in the viewing angle. On the contrary, the central wavelength of the [Fe III] blend at 4700Å does show a clear correlation with the epoch; The line always shows a blueshift before days, while there is no significant wavelength shift in spectra taken after days (Fig. 9). This is exemplified by the temporal evolution of the nebular spectra, available for a few SNe Ia (Fig. 11): Thus, we suggest that the [Fe III] traces the intrinsic geometry only after days, and that the outer, relatively low density region is less aspherical than the innermost region.
Figure 11 shows that there is also diversity in the temporal evolution of [Ni II] 7378. In SNe 1986G and 2003hv, [Ni II] 7378 persisted over a long period, while it only shows a transient feature in SN 2000cx. This may indeed be consistent with the model calculation; in our calculation, the strength of [Ni II]7378 is largely reduced at days (Figs. 2 & 4), following the temperature drop and the so-called infrared catastrophe in the ECAP zone (see also §6.3).
The central wavelength of the [Ni II] line does not evolve in SN 1986G, while it shows a somewhat larger blueshift in the later phase in SN 2003hv. The difference is likely related to the distribution of different species, and the resulting -ray deposition and potentially the positron escape. An increasing degree of the blueshift in SN 2003hv as a function of time might indicate that 56Ni is distributed inhomogeneously within the ECAP zone, being relatively concentrated at the high velocity ”edge” of this zone (e.g., km s-1). In such a scenario, -rays irradiate the whole ECAP zone early on, while later the positrons heat only the relatively ”high-velocity” region.
The number of SNe Ia with a good temporal coverage at late phases is still small, and it is strongly encouraged to perform multi-epoch spectroscopy. Such intensive observations are useful to understand (1) the detailed distribution of 56Ni, and (2) detailed thermal processes (e.g., -ray deposition, positron escape, IR catastrophe) in the SN Ia nebulae. It is also important to investigate (3) a possible evolution in the line profiles if we are to use them to investigate the details of the explosion physics (see §6.3 for more details).
6.3. Future Perspectives
The conclusion in the present paper that the late-time nebular spectra can be used to investigate the geometry of ejecta, thus the explosion mechanism of SNe Ia, provides a new strategy to clarify the nature of SN Ia explosions. Presently, the sample is still limited: The late-time nebular spectra are available for SNe Ia in the optical wavelength. There are only a few examples in the NIR and Mid-IR. For most of them, a temporal sequence of late-time spectra are not available. In this section, we highlight the importance of expanding the sample of late-time nebular spectra of SNe Ia.
In doing this, we summarize predictions from recent theoretical models. Two scenarios have been proposed to create the ECAP zone in the context of the asymmetric ignition of the initial deflagration bubbles. In the first scenario, many ignition points are clustered near the center of the white-dwarf with possible bulk off-set (§1), producing the ECAP zone by the deflagration flame. In the second scenario, one or a few ignition points are placed far away from the center of the white dwarf. The deflagration is weak and does not produce much neutron-rich materials. The deflagration flame rises to the surface without initiating the detonation. The detonation may then be triggered near the white dwarf surface, at the opposite side of the initial deflagration ignition (so-called Gravitationally Confined Detonation model; Jordan et al. 2008). In this case, the initial deflagration is so weak and the white dwarf suffers from virtually no expansion before the detonation passes through the central region. Thus, the electron capture reactions in the detonation are not negligible, producing the ECAP zone (Meakin et al. 2009). This model predicts the off-set of the ECAP zone toward the opposite direction of the initial deflagration ignition. This second scenario could actually be regarded as an extreme case of the first scenario in terms of the distribution of the initial deflagration bubbles.
Although these two scenarios are qualitatively different to one another for the origin of the ECAP zone, the resulting configuration (e.g., the off-center ECAP zone) may be similar to what we derived in this paper. In the second scenario, however, the detonation should produce a large amount of 56Ni in order to produce the ECAP zone more massive than (Meakin et al. 2009), at least their model sequence presented to date (e.g., of 56Ni in their 2D models). This scenario therefore may not be favored as the origin of the ECAP zone for the particular case of SN 2003hv, which is relatively faint as a normal SN Ia (Leloudas et al. 2009). This second scenario is still a possibility to explain the wavelength shift in the nebular emission lines seen in bright SNe Ia, which also show the signature of the asymmetry in the ECAP zone (§5 & §6.1). Although we expect that the Gravitationally Confined Detonation (GCD) model results in bright SNe Ia if the detonation is to produce the ECAP zone, the detailed relation between the brightness and the mass of the ECAP zone should be dependent on details of the initial conditions such as the ignition density (which depends on the accretion rate of a white-dwarf before the explosion; e.g., Nomoto 1982; Nomoto et al. 1984). Further study based on the GCD scenario is therefore important.
We suggest that future observations of late-time SN Ia emission can provide important information to understand the details of the explosion mechanism(s). Hereafter, we discuss importance of the following (future) observations, especially in view of the available theoretical ideas as mentioned above.
-
•
Expanding the sample of the line velocity shift measurement, especially in the optical wavelengths.
-
•
Studying the detailed line profiles, especially in the NIR.
-
•
Investigating the mass of the ECAP zone.
6.3.1 Expanding the sample for the line velocity shift measurement
A series of hydrodynamic simulations based on the first scenario provide interesting predictions (Kasen et al. 2009). More asymmetric distribution of the initial deflagration results in a larger amount of 56Ni produced by the detonation, yielding brighter SNe. For a larger degree of the off-set in the initial deflagration bubbles, we should also expect a larger degree of the off-set in the ECAP zone produced by the deflagration (Maeda et al. 2009c). We therefore expect that brighter SNe Ia show a larger off-set velocity in the ECAP zone in this scenario. Since the wavelength shift seen in nebular spectra of individual SNe Ia is a result from a combination of the degree of the asymmetry and the viewing angle, this relation should be observationally investigated in a statistic way with a large number of SNe Ia. We suggest to investigate the distribution of the line-velocity (Figure 10) as a function of the luminosity of SNe Ia (or so-called in the light curve shape which correlates with the luminosity). The scenario predicts that brighter SNe Ia should show a wider distribution in the velocity space, while fainter SNe Ia should show more narrowly peaked distribution at zero velocity.
The GCD model is an extreme end of the model sequence, predicting bright SNe Ia. The mechanism to create the ECAP zone is different from the first scenario. Thus, it may well give the distribution of the velocity shift as a function of the luminosity different from the first scenario.
These issues cannot be addressed with the current sample of SNe Ia for which nebular spectra are available – the current data are consistent with the idea that SNe Ia have the generic off-set as derived for SN 2003hv (Fig. 10), but it does not reject a possibility that the off-set velocity is dependent on the luminosity because of the small sample. Increasing the number of the sample will tell us (1) whether brighter SNe Ia have larger off-set in the ECAP zone (a test for the first explosion scenario), and (2) whether the distribution of off-set of the ECAP zone is explained by a single scenario or hybrid scenarios, especially in bright SNe Ia (a test for the GCD model).
6.3.2 Detailed Line Profiles especially in the NIR
In this paper, we have focused on the line wavelength shift, but have not tried to fit the details of the line profiles. Höflich et al. (2004) and Motohara et al. (2006) suggested to use the detailed line profile of [Fe II] to probe the distribution of electron capture products (i.e., the ECAP-zone in our model). Höflich et al. (2004) suggested that the apparently flat-topped profile of this line in SN 2003du is a signature of a ”hole” in the region emitting the [Fe II]. They attributed this hole to the existence of an inner 56Ni-free, electron capture products-rich region, since such a region lacks the heating source when the ejecta become transparent to -rays. The same suggestion was also made for SN 2003hv based on better data (Motohara et al. 2006). There are also other possibilities for the flat-topped profile, e.g., the infrared catastrophe (Leloudas et al. 2009).
Understanding the origin of the details of the line profiles requires further studies (e.g., Höflich et al. 2006). For the ”hole” interpretation of the flat-topped profiles, it should be examined whether such a configuration can result from hydrodynamic explosion models.
An intensive model survey based on the first scenario has been presented by Kasen et al. (2009) in 2D. According to their model sequence, we would expect that more asymmetric distribution of the initial deflagration bubbles could result in a larger amount of 56Ni produced by the detonation near the zero-velocity. As such, we expect that bright SNe Ia tend to show the peaked line profiles. Faint SNe Ia may tend to show the flat-topped profile (see below). The most solid case showing the flat-top profile in the NIR [Fe II] so far is SN 2003hv. This is a relatively faint SN Ia, thus being consistent with this theoretical expectation. Also, the bright SN 1991T showed the peaked profile (Bowers et al. 1997) and it is also consistent with the expectation.
Apart from the above prediction, an issue remains whether the first scenario can produce the flat-topped profiles. The current state-of-art 3D deflagration model according to this scenario indicates some amount of unburned C+O is mixed down to the center (e.g., Röpke et al. 2007a). These materials may be later detonated to produce 56Ni (Röpke & Niemeyer 2007b; Kasen et al. 2009). Thus, it is expected that the ECAP zone and the HD zone are mixed, rather than form the distinctly layered structure. An interesting question is whether future simulations can lead to the ”hole” configuration with some initial conditions for the thermonuclear bubbles, and whether different initial conditions can result in a different degree of the mixing (to explain the diversity in the detailed profile).
In the second, GCD scenario, the ECAP zone would not suffer from the mixing process since it is created by the detonation. It is expected to be always a ”hole”, but the size of the zone may well depend on the strength of the initial deflagration. For the weaker deflagration, the density of the white-dwarf at the detonation is higher, and thus the size and mass of the ECAP zone are larger (Meakin et al. 2009). This raises an interesting possibility that the variation in the size of the ECAP zone may explain the variation in the detailed line profile; brighter SNe Ia are expected to more likely produce a flat-top profile. This tendency is different from the expectation from the first scenario.
In our kinematic model, we have the ”hole” in the form of the ECAP-zone, which is assumed to be macroscopically separated from the outer 56Ni-rich HD/LD-zones. In this configuration, our model makes the following predictions; (1) Emission lines formed in the ECAP-zone have narrow widths ( km s-1), and have a peaked profile (with respect to the ”off-set” wavelength). This is exemplified by [Ni II] 7378, [Ni II] , [Ni III] . (2) Emission lines originating from the HD-zone have flat-topped profiles. Typical examples are [Fe II] 7151, [Fe II] , [Fe II] , and [Co III] . (3) Emission lines dominated by the LD-zone have broad, peaked profiles, since the size of the ”hole” is much smaller than the emitting radius. Typical examples are [Fe III] , and [Fe III] . The [Fe III] blend at 4700Å also has the same tendency, although the blended nature of this feature makes the situation complicated. Some lines show a combination of these characteristics; for example, [Fe II] is predicted to show a peaked, relatively broad profile with a wavelength shift depending on the viewing angle (§5.4). Thus, looking at various emission lines, we will be able to obtain different, independent information on the explosion physics.
The best lines for investigating the details of the distribution of 56Ni and the hole (i.e., the ECAP zone) are [Fe II] 1.257 and [Fe II] 1.644 , thanks to their low excitation temperature and the relatively isolated nature of these lines. Adding to this, [Ni II] 7378 and some Mid-IR lines (Table 4) can give the direct view of the ECAP zone distribution. Thus, expanding the sample of late-time NIR spectra is highly encouraged, preferentially with the optical and (if possible) mid-IR data taken almost simultaneously. This will tell us (1) whether brighter SNe Ia have a larger amount of the low-velocity 56Ni (a test for the first explosion scenario), (2) whether the fainter SNe tend to show the flat-topped profile (a constraint on the distribution of the deflagration bubbles), and (3) whether the brightest SNe Ia show the hole of the 56Ni distribution (a test for the GCD model as the origin of the brightest SNe Ia).
6.3.3 Mass of Neutron-rich Fe-peak Elements
In §6.2, we have mentioned an importance of multi-epoch spectroscopy to clarify details of thermal processes within SN Ia nebulae. This is also important to clarify the explosion physics.
Different scenario should result in the different mass of the ECAP zone. The first scenario predicts a smaller mass of the ECAP zone for brighter SNe Ia (since the weaker detonation is followed by the stronger detonation; Kasen et al. 2009). The trend should be opposite in the GCD model sequence (since the neutron-rich materials and 56Ni are both created by the detonation). Deriving the mass of neutron-rich materials (i.e., ECAP zone) as a function of the SN Ia peak luminosity will therefore give us a strong test for these scenarios. No significant variation of the mass of neutron-rich materials as a function of the luminosity (or ) has been found so far (Mazzali et al. 2007). Understanding the thermal properties will provide the better accuracy in the mass estimate so that the investigation of the details of the explosion physics becomes possible.
References
- (1) Altavilla, G., et al. 2007, A&A, 475, 585
- (2) Anupama, G. C., Sahu, D. K., & Jose, J. 2005, A&A, 429, 667
- (3) Axelrod, T. S. 1980, Ph.D. thesis, Univ. California, Santa Cruz
- (4) Bowers, E. J. C., et al. 1997, MNRAS, 290, 663
- (5) Brachwitz, F., et al. 2000, ApJ, 536, 934
- (6) Branch, D. 1998, ARA&A, 36, 17
- (7) Branch, D., et al. 2003, AJ, 126, 1489
- (8) Cappellaro, E., et al. 2001, ApJ, 549, L215
- (9) Chugai, N. N., Fabrika, S. N., Sholukhova, O. N., Goranskij, V. P., Abolmasov, P. K., Vlasyuk, V. V. 2005, Astronomy Letters, 31, 792
- (10) Cristiani, S., et al. 1992, A&A, 259, 63
- (11) Elias-Rosa, N., et al. 2006, MNRAS, 369, 1880
- (12) García-Senz, D., & Bravo, E. 2005, A&A, 430, 585
- (13) Gerardy, C. L., et al. 2007, ApJ, 661, 995
- (14) Gómez, G., López, R., & Sánchez, F. 1996, AJ, 112, 2094
- (15) Hicken, M., et al. 2007, ApJ, 669, L17
- (16) Hillebrandt, W., & Niemeyer, J. C. 2000, ARAA, 38, 191
- (17) Hillebrandt, W., Sim, S. A., & Röpke, F. K. 2007, A&A, 465, 17
- (18) Höflich, P., & Khokhlov, A. 1996, ApJ, 457, 500
- (19) Höflich, P. et al. 2004, ApJ, 617, 1258
- (20) Höflich, P., Gerardy, C.L., Marion, H., Quimby, R. 2006, New Astronomy Reviews, 50, 470
- (21) Howell, D. A., Höflich, P., Wang, L., & Wheeler, J. C. 2001, ApJ, 556, 302
- (22) Iwamoto, K., Brachwitz, F., Nomoto, K., Kishimoto, N., Umeda, H., Hix, W. R., & Thielemann, F. -K. 1999, ApJS, 125, 439
- (23) Jordan, G.C., et al. 2008, ApJ, 681, 1448
- (24) Kasen, D., Röpke, F. K., & Woosley, S. E. 2009, Nature, 460, 869
- (25) Khokhlov, A., 1991, A&A, 245, 114
- (26) Kotak, R., et al. 2005, A&A, 436, 1021
- (27) Kozma, C., & Fransson, C. 1998a, ApJ, 496, 946
- (28) Kozma, C., & Fransson, C. 1998b, ApJ, 497, 431
- (29) Leloudas, G., et al. 2009, A&A, 505, 265
- (30) Leonard, D. C. 2007, AIPC, 937, 311
- (31) Li, W., et al. 2001, PASP, 113, 1178
- (32) Liu, W., Jeffery, D. J., & Schultz, D. R. 1998, ApJ, 494, 812
- (33) Livne, E., Asida, M., & Höflich, P. 2005, ApJ, 632, 443
- (34) Maeda, K., Nakamura, T., Nomoto, K., Mazzali, P.A., Patat, F., & Hachisu, I. 2002, ApJ, 565, 405
- (35) Maeda, K. 2006a, ApJ, 644, 385
- (36) Maeda, K., Mazzali, P. A., & Nomoto, K. 2006b, ApJ, 645, 1331
- (37) Maeda, K., Nomoto, K., Mazzali, P. A., & Deng, J. 2006c, ApJ, 640, 854
- (38) Maeda, K., et al. 2008, Science, 319, 1220
- (39) Maeda, K., & Iwamoto, K. 2009a, MNRAS, 394, 239
- (40) Maeda, K., Kawabata, K., Li, W., Tanaka, M., Mazzali, P. A., Hattori, T., Nomoto, K., & Filippenko, A. V. 2009b, ApJ, 690, 1745
- (41) Maeda, K., Röpke, F.K., Fink, M., Hillebrandt, W., Travaglio, C., Thielemann, F.-K. 2009c, ApJ, submitted
- (42) Matheson, T., et al. 2008, AJ, 135, 1598
- (43) Mattila, S., et al. 2005, A&A, 443, 649
- (44) Mazzali, P. A., Nomoto, K., Patat, F., & Maeda, K. 2001, ApJ, 559, 1047
- (45) Mazzali, P. A., et al. 2005, Science, 308, 1284
- (46) Mazzali, P. A., Röpke, F. K., Benetti, S., & Hillebrandt, W. 2007, Science, 315, 825
- (47) Meakin, C.A., Seitenzahl, I., Townsley, D., Jordan, G.C., Truran, J., Lamb, D. 2009, ApJ, 693, 1188
- (48) Milisavljevic, D., Fesen, R., Gerardy, C., Kirshner, R., & Challis, P. 2009, preprint (astro-ph/0904.4256)
- (49) Modjaz, M., Kirshner, R. P., Blondin, S., Challis, P., & Matheson, T. 2008, ApJ, 687, L9
- (50) Motohara, K., et al. 2006, ApJ, 652, L101
- (51) Niemeyer, J.C., Hillebrandt, W., & Woosley, S.E. 1996, ApJ, 471, 903
- (52) Nomoto, K., Sugimoto, D., & Neo, S. 1976, Ap&SS, 39, L37
- (53) Nomoto, K. 1982, ApJ, 253, 798
- (54) Nomoto, K., Thielemann, F. -K., & Yokoi, K. 1984, ApJ, 286, 644
- (55) Nomoto, K., Yamaoka, H., Shigeyama, T., Kumagai, S., & Tsujimoto, T. 1994, in Supernovae, ed. S. A. Bludman, R. Mochkovitch, & J. Zinn-Justin, 199
- (56) Nomoto, K., Iwamoto, K., & Kishimoto, N. 1997, Science, 276, 1378
- (57) Nugent, P., Baron, E., Branch, D., Fisher, A., & Hauschildt, P. H. 1997, ApJ, 485, 812
- (58) Pastorello, A., et al. 2007, MNRAS, 377, 1531
- (59) Perlmutter, S., et al. 1999, ApJ, 517, 565
- (60) Phillips, M. M. 1993, ApJ, 413, L105
- (61) Phillips, M. M., Lira, P., Suntzeff, N. B., Schommer, R. A., Hamuy, M., & Jose, M. 1999, AJ, 118, 1766
- (62) Pignata, G., et al. 2008, MNRAS, 388, 971
- (63) Riess, A. G., et al. 1998, AJ, 116, 1009
- (64) Röpke, F. K., Hillebrandt, W., Schmidt, W., Niemeyer, J.C., Blinnikov, S. I., & Mazzali, P. A. 2007a, ApJ, 668, 1132
- (65) Röpke, F. K., Niemeyer, J. C. 2007b, A&A, 464, 683
- (66) Röpke, F. K., Woosley, S. E., & Hillebrandt, W. 2007c, ApJ, 660, 1344
- (67) Ruiz-Lapuente, P., & Lucy, L. B. 1992, ApJ, 400, 127
- (68) Salvo, M. E., Cappellaro, E., Mazzali, P. A., Benetti, S., Danziger, I. J., Patat, F., Turatto, M. 2001, MNRAS, 321, 254
- (69) Sim, S. A., Sauer, D. N., Röpke, F. K., & Hillebrandt, W. 2007, MNRAS, 378, 2
- (70) Sollerman, J., et al. 2004, A&A, 428, 555
- (71) Spyromilio, J., Gilmozzi, R., Sollerman, J., Leibundgut, B., Fransson, C., & Cuby, J. -G. 2004, A&A, 426, 547
- (72) Stanishev, V., et al. 2007, A&A, 469, 645
- (73) Tanaka, M., Mazzali, P. A., Maeda, K., Nomoto. K. 2006, ApJ, 645, 470
- (74) Tanaka, M., Maeda, K., Mazzali, P. A., Nomoto. K. 2007, ApJ, 668, L19
- (75) Taubenberger, S., et al. 2009, MNRAS, 397, 677
- (76) Timmes, F. X., Brown, E. F., & Truran, J. W. 2003, ApJ, 590, L83
- (77) Turatto, M., et al. 1996, MNRAS, 283, 1
- (78) Wang, L., Wheeler, J. C., Li, Z., & Clocchiatti, A. 1996, ApJ, 467, 435
- (79) Wheeler, J. C., Harkness, R. P., Khokhlov, A. M., & Höflich, P. 1995, Phys. Rep., 53, 221
- (80) Woosley, S. E., & Weaver, T. A. 1994, ApJ, 423, 371
- (81) Woosley, S. E., Wunsch, S., & Kuhlen, M. 2004, ApJ, 607, 921
- (82) Yamaoka, H., Shigeyama, T., Nomoto, K., & Thielemann, F. -K. 1992, ApJ, 393, L55