Optical Transients from the Unbound Debris of Tidal Disruption
Abstract
In the tidal disruption of a star by a black hole, roughly half of the stellar mass becomes bound and falls into the black hole, while the other half is ejected at high velocity. Several previous studies have considered the emission resulting from the accretion of bound material; we consider the possibility that the unbound debris may also radiate once it has expanded and become transparent. We show that the gradual energy input from hydrogen recombination compensates for adiabatic loses over significant expansion factors. The opacity also drops dramatically with recombination, and the internal energy can be radiated by means of a cooling-transparency wave propagating from the surface layers inward. The result is a brief optical transient occurring week after disruption and lasting 3-5 days with peak luminosities of , depending on the mass of the disrupted star. These recombination powered transients should accompany the x-ray/ultraviolet flare from the accretion of bound material, and so may be a useful signature for discriminating tidal disruption events, especially for lower and intermediate mass black holes.
1. Introduction
Stars unfortunate enough to pass too close to a massive black hole are torn apart by tidal gravity forces. In the process, roughly half of the stellar material becomes bound, circularizes, and may eventually accrete onto the black-hole. The other half of the star is ejected from the system at high differential velocities.
Tidal disruption events offers one means of probing a central black hole in quiescent galaxies. The dominant observational signature should be a bright x-ray flare powered by accretion of bound material onto the black hole (Rees, 1988; Ulmer, 1999; Ramirez-Ruiz & Rosswog, 2009). Candidate disruption flares have been detected in x-ray/ultraviolet surveys (Donley et al., 2002; Gezari et al., 2006; Esquej et al., 2007) in some case with counterpart emission in the optical (Gezari et al., 2009). The light curves decline as power laws with luminosities comparable to the Eddington luminosity for black holes. Nevertheless, it can be difficult to uniquely identify these flares as tidal disruption events as opposed to other forms of nuclear activity.
It is therefore useful to determine additional discriminating signatures of tidal disruption events. A few possibilities have been suggested. For deeply penetrating orbits, strong tidal compression perpendicular to the orbital plane leads to the formation of shocks, which breakout out in short ( sec) but bright ( ) x-ray bursts (Kobayashi et al., 2004; Brassart & Luminet, 2008; Guillochon et al., 2008). Later on, streams of material falling onto the black hole may undergo collisions producing short UV flares of luminosity (Cannizzo et al., 1990; Kim et al., 1999). In addition, the x-ray/UV luminosity from accretion may be absorbed and reprocessed by the unbound debris into optical emission, leading to optical luminosities of (Bogdanović et al., 2004; Strubbe & Quataert, 2009). If a substantial fraction of the accreting material is blown in a wind, the optical radiation escaping from this outflow may be much brighter, (Strubbe & Quataert, 2009). Optical emission is of particular interest, as observational surveys are typically most sensitive at these wavelength.
Little attention has been given to emission from the unbound debris of disruption. This material, which expands differentially with velocities in some ways resembles a supernova remnant, though usually lacking any radioactive isotopes to power the light curve. While the initial internal energy of the star can be fairly significant ( ergs), most of it will be lost to adiabatic expansion before the ejecta becomes sufficiently transparent to radiate. For an ideal gas with adiabatic index , the energy and temperature evolve adiabatically as . A decline in density by at least a factor of is required before the debris might become translucent, at which point the internal energy and temperature will have decreased by a factor . Hence the apparent lack of interest in diffusive thermal emission from the unbound remnants of tidal disruption.
There is, however, another important energy reservoir of the debris – ionization energy, which amounts to ergs per solar mass of ionized hydrogen and is not subject to adiabatic degradation. When recombination eventually sets in at temperatures K, the energy released per atom is an order of magnitude greater than the mean thermal energy, . Recombination is therefore a gradual process, steadily inputting energy to maintain the gas temperature near . The thermodynamic evolution is described by where is the third generalized adiabatic index, now a function of density and temperature. In the region of partial ionization (see §3) so that the energy decline is indeed gradual.
When the effects of ionization are included, the debris can expand by a much larger factor, and reach much lower densities, before the internal energy is depleted. When near neutrality is reached, the opacity also drops sharply due to the elimination of electron scattering. It may be possible for radiation to escape at this time, taking the form of a cooling-transparency wave that propagates from the surface inwards. The escape of photons will be aided by the aspherical geometry of the debris, which has been stretched by tidal forces into a thin stream, with lower optical depth along the direction perpendicular to the orbital plane
It is therefore plausible that the unbound debris of tidal disruptions gives rise to a brief optical transient powered primarily by the energy tapped from recombination. We call such an event a recombination transient (RT). The light curves, even if they are dim, might be relevant for upcoming synoptic optical surveys which will probe for the first time extra-galactic transients with luminosities between classical novae ( mag) and supernovae ( mag). Here we elaborate on the basic physical ideas and make approximate predictions of the light curves.
2. The Debris of Tidal Disruption
The dynamics of tidal disruption have been widely studied, both analytically and numerically (e.g., Rees, 1988; Carter & Luminet, 1983; Kochanek, 1994; Brassart & Luminet, 2008; Lodato et al., 2009; Guillochon et al., 2008; Ramirez-Ruiz & Rosswog, 2009). Disruption occurs when a star passes within the tidal radius , where is the black hole mass, and and the stellar mass and radius. The penetration factor describes the depth of the encounter, where is the radius at pericenter. The velocity at pericenter is or
| (1) |
where , , and . Because the initial velocity of the star at infinity ( ) is much less than , it is assumed to approach on an essentially parabolic orbit.
Within , the self-gravity of the star becomes sub-dominant. Material on the far side of the star, being more distant to to the black hole by , possesses an excess specific energy relative to the center of mass, . This material becomes unbound with an expansion velocity at infinity or
| (2) |
The half of the star nearer to the black hole, with specific energy , becomes bound and eventually may accrete onto the black hole.
The unbound material is ejected from the system on hyperbolic orbits, and the debris elongates into a thin stream (Khokhlov & Melia, 1996; Kochanek, 1994; Rosswog et al., 2009). We describe the final geometry with the parameters , and which denote, respectively, the spatial extant of the debris in the orbital direction, the transverse direction within the orbital plane, and the direction perpendicular to the orbital plane. The thickness of the stream within the orbital plane is related to the difference in specific energy between the leading and trailing edges of the star as it approaches pericenter, . Comparing the corresponding velocity at infinity to provides a estimate of the axis ratio .
| (3) |
In the dimension perpendicular to the orbital plane (the -direction) tidal forces compress the star into a pancake (Guillochon et al., 2008). The compression raises the central density by a factor proportional to (Carter & Luminet, 1983), with a corresponding adiabatic increase in temperature of . Eventually the star rebounds under the increased central pressure. For deep penetrations (), shocks form and propagate outward in the -direction. The temperature of the shocked material will be of order the virial temperature
| (4) |
where is the mean particle mass of ionized hydrogen. The velocity in the z-direction of the shocked material will be of order
| (5) |
Comparable shock velocities can be seen in the hydrodynamical calculations of Brassart & Luminet (2008). This z-velocity serves to increase final the spatial extent of the unbound debris in the -direction. The orbital plane of a gas element with non-zero z-velocity at pericenter will be inclined to the plane of the stellar orbit by an angle . The axis ratio of the debris in the direction perpendicular to the orbital plane is then approximately
| (6) |
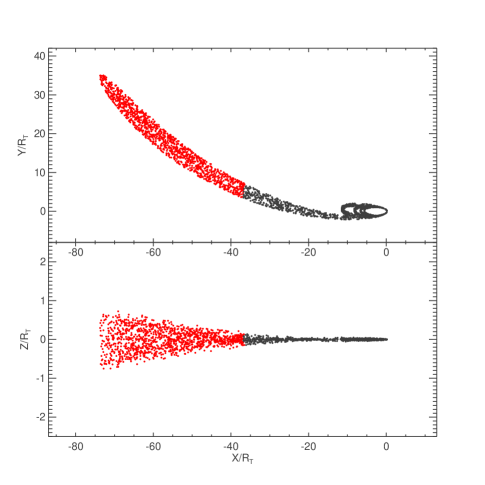
We can model approximately the final shape of the unbound debris by simply following the orbits of collisionless test particles in the gravitational potential of the black hole, while ignoring self-gravity. For initial conditions at pericenter we take a uniform pancake of radius moving in the y-direction with speed and with a -component of velocity given by Eq. 5. Two days later, the final thin stream geometry (Figure 1) is roughly described by axis ratios of and .
The unbound debris eventually enters a homologous phase and the volume scales as where we define the expansion parameter:
| (7) |
We can also write where the expansion time is defined
| (8) |
Initially, the stellar mass and energy are centrally concentrated, but shocks largely homogenize the density and temperature structures in the vertical direction (Brassart & Luminet, 2008; Guillochon et al., 2008; Rosswog et al., 2009). This outward transport of entropy is an important factor in obtaining a bright transient. The total internal energy of the unbound debris after it has rebounded to its original volume will be of order its original value
| (9) |
where is a constant of order unity. By comparison, the total kinetic energy at infinity of the unbound debris is of order ergs. The ratio of internal to kinetic energy is initially , which can be contrasted with that of shock driven Type II supernovae, . The difference in initial entropy results in a distinct thermodynamic evolution and light curve for the two events.
3. Thermodynamic Evolution
Following disruption, the evolution of the expanding debris follows the thermodynamics of ionizing gases (Krishna Swamy, 1961; Mihalas & Weibel Mihalas, 1984). Initially the material is extremely optically thick and the evolution essentially adiabatic, , where the pressure is
| (10) |
with the number of nuclei and the volume. The mean ionization state is , where is the ionization fraction and the abundance fraction of species . For our purposes, only hydrogen and two ionization states of helium need be considered. The total internal energy is
| (11) |
Excitation energy terms can be ignored. Once the temperature is high enough to excite the atoms the gas will quickly become ionized.
Assuming local thermodynamic equilibrium the ionization state of each species is given by the Saha equation:
| (12) |
where is a constant, and is the partition function, which we take to be independent of temperature and density.
From Eq. 11 we have
| (13) |
while the logarithmic derivative of Eq. 12 gives:
| (14) |
Because the ionization energies of hydrogen and helium are fairly well separated, we approximate
Combining Eqs. 13, 14, and 10 gives for adiabatic evolution
| (15) |
where
| (16) |
were is the ratio of radiation pressure to gas pressure. The sum here runs over both ionization states of helium, treated independently.
When either the gas or radiation terms dominate, Eq. 16 reduces as expected to or , respectively. The terms under the sums, which incorporate the effects of ionization, are zero for and but maximal in the region of partial ionization of hydrogen. For we get the smallest values of
| (17) |
where we used the fact that for temperatures K.
From Eq 17 we can estimate the amount of expansion the debris will undergo before recombination is complete. For an initial temperature of K and density , gas energy dominates and one has at first . The debris will expand by a factor before the temperature drops into the regime of recombination at K. Hydrogen remains partially ionized for only a narrow temperature range, however this occurs over an extended period of time – to reduce from K down to requires additional expansion by a factor . Thus, for these initial conditions, we anticipate total expansion of before recombination is complete.
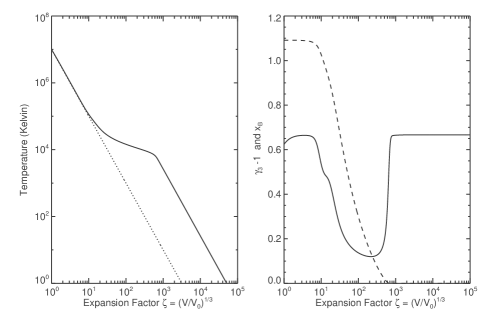
Figure 2 shows the thermodynamic evolution of a parcel of gas with the above initial conditions, as determined from a direct numerical integration of Eq. 15. The initial law plateaus at , after which the gradual input of energy from recombination maintains the temperature at a near constant value. As expected, recombination is essentially complete by , and the behavior resumes. Naturally, a higher initial temperature allows for larger expansion factors, but so does a lower density. This is because at lower density recombination occurs at a lower temperature, which implies a lower in the recombination regime (Eq. 17).
4. Opacity and Radiative Transfer
After the debris has expanded by a factor and recombined, its internal energy is around ergs per of hydrogen. This is times greater than what is predicted for a constant evolution, demonstrating the critical importance of the ionization effects. If the energy can be radiated on the time scale of days, a bright transient may be produced. However, if the debris remains optically thick the energy will lost quickly to expansion in the gas dominated regime.
Radiation will preferentially escape along the z-direction, the shortest dimension with extant . The total optical depth along this direction is , or taking an average value for the density
| (18) |
where and is the Rosseland mean opacity in units of cm2 g-1. The debris is very optically thick for , the value for Thomson scattering in ionized hydrogen. However, the opacity drops dramatically with hydrogen recombination. From Eq. 12, the free electron density decreases by a factor as the temperature changes from K to K.
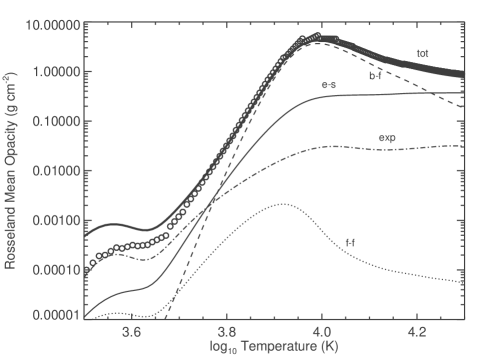
Other relevant sources of opacity likewise decline sharply for ; free-free because of the declining electron density and bound-free because of the reduced occupation number of excited levels. The and molecular opacities, however, may start to become more significant at lower temperatures. In addition, Doppler broadening in the differentially expanding debris enhances the line opacity from numerous iron group lines. In Figure 3 we plot the various sources of opacity as a function of temperature. The opacity reaches a minimum value of at K.
The unbound debris may thus begin to radiate effectively when the outermost layers of material have cooled to the “transparency” temperature K. This emission should begin at roughly a time after pericenter passage
| (19) |
Around this time, a sharp recombination front develops in the outer layers of debris – ionized material below the front is optically thick, while neutral material above will be optically thin if the densities are sufficiently low. Radiative cooling at the front promotes further recombination, causing this surface to move progressively inward in mass coordinates. The so-called transparency wave (Zel’Dovich & Raizer, 1967; Grasberg & Nadezhin, 1976) allows for a more rapid release of the internal energy.
The condition for a transparency wave to successfully propagate is that the optical depth evaluated at the minimum opacity be of order unity. From Eq. 18 and this occurs for expansion factors . The thermodynamic evolution of §3 predicts expansion factors of before recombination is complete. The coincidental near equality of these numbers indicates that it is possible, though just marginally so, for a recombination wave to occur and radiate away a significant fraction of the remaining internal energy.
The photosphere of the debris, which is coincident with the recombination front, cools by radiating a flux . Assuming that gas interior to the front is nearly neutral at a temperature near , the speed at which transparency wave releases the internal energy and propagates inward is
| (20) |
The timescale for the light curve to decline after peak will be comparable to the time it takes the transparency wave to propagate the distance
| (21) |
The luminosity of the light curve, as viewed perpendicular to the orbital plane, will be roughly that of a blackbody at with the given projected surface area.
| (22) |
The disruption of solar mass stars should give rise to rather brief, dim transients, while those of more massive stars will be significantly brighter given their greater and .
5. Light Curves
A realistic calculation of the optical emission from tidal disruption would require a 3-dimensional coupled radiation-hydrodynamics simulation. Here we perform simple 1-D calculations to illustrate the approximate luminosity and duration of the light curves.
The hydrodynamic simulations of Brassart & Luminet (2008) show that shocks tend to homogenize the debris structure in the z-direction. We consider models of initially uniform temperature and density , where the ejected mass is and the initial volume . The initial energy is given by Eq. 9 with or 2. To estimate the light curves for stars of different masses, we apply a simple mass-radius relation .
Radiation transport is most relevant along the -direction, which we resolve with 1000 zones. The diffusion time is long in the ionized central regions, so radiation transport is only of critical importance in the surface layers. We therefore calculate the adiabatic evolution as described in §3 while including radiative losses relevant for the cooling recombination wave, namely
| (23) |
where is the duration of the timestep. The isotropic equivalent luminosity at a given time, as seen from the brightest viewing angle, is
| (24) |
where is the optical depth along the z-direction (Eq. 18). Given the small z-dimension, we neglect light crossing times.
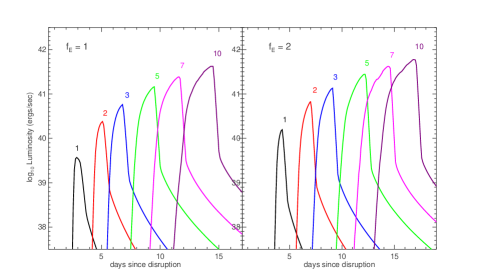
Figure 4 shows light curves of disruption events for stars of masses . We have taken a penetration factor of and axis ratios . As expected, the light curves rise at about 3 to 5 days after disruption, and last around a few days. Following the peak there is a more slowly declining light curve tail in which the neutral, cold ( K) debris continues to radiate in the infrared. A proper description of the transport in this late phase would require inclusion of molecular opacities.
A solar mass star reaches a peak luminosity of ergs/sec for and ergs/sec for . The brightnesses increases strongly with , mainly because the more massive stars have larger radii and hence greater surface area. In addition, more massive stars have initially larger internal energies and lower average densities, which allows for larger expansion factors (§3). The disruption of stars, though presumably rare events, would produce quite luminous recombination transients, approaching the brightness of Type II supernovae ( ergs/sec) although with much shorter durations.
The emission of the recombination transient will be anisotropic due to the asymmetry of the debris. To first order this angular dependence is given by the projected surface area of the photosphere along different viewing angles. For the angular dependence is essentially , where is the viewing angle relative to the direction perpendicular to the orbital plane.
The spectrum of the recombination transient should be roughly blackbody at the transparency temperature K. The ongoing recombination may also lead to strong emission in . Thus the RT will likely be brightest in the R-band. The spectral features should is some ways resemble those of Type II supernovae, with P-Cygni profiles. The observed Doppler shifts, however, should be significantly lower, corresponding to velocities . Given the extreme asymmetry, high levels of continuum linear polarization, near the limit of in plane parallel electron scattering atmospheres (Chandrasekhar, 1960) should be observed from some viewing angles.
6. Prospects for Detection
6.1. Domain of Astrophysical Relevance

The recombination transient is just one of several sources of electromagnetic radiation in a tidal disruption event. An important question is whether the luminosity of the RT can compete with the other emission mechanisms, in particular the fallback of the bound stellar debris and its subsequent accretion onto the black hole.
The energy radiated during the fallback phase may dominate the luminosity at early times. The most tightly bound debris moves on an elliptical orbit with semi-major axis and returns to pericenter on the orbital timescale , or
| (25) |
with less bound material falling back continually thereafter. The streams of fallback material undergo collisions which, after a few orbital timescales, circularize the orbits at a radius determined by total angular momentum conservation (Ramirez-Ruiz & Rosswog, 2009). The final binding energy of this circular orbit is much less than the binding energy of the initially elliptical orbits. Assuming the energy difference is radiated with efficiency over a few orbital timescales, , the luminosity is would be
| (26) |
where is highly uncertain. Assuming the photosphere is near , the emission temperature is
| (27) |
It is possible that some of the energy available in fallback goes into driving a mass outflow (Strubbe & Quataert, 2009). This matter adiabatically expands to large radii until becoming optically thin. For certain choices of the fraction of mass ejected, the resulting optical luminosity can be quite bright .
After circularization, the fallback material forms a torus which will spread out viscously and accrete onto the black hole. The timescale for this stage of the evolution is determined by the viscous timescale (Cannizzo et al., 1990; Ulmer, 1999)
| (28) |
where is the standard viscosity parameter (Shakura & Sunyaev, 1973), and is the ratio of the disk height to radius and is approximately of order unity for thick disks. The emergent radiation may have a strong dependence on the structure and orientation of the disk. As a simple estimate we consider the luminosity to be at the Eddington limit and emanating from the radius . This gives an accretion temperature
| (29) |
Both the fallback and the accretion temperature depend weakly on . In the case where emission peaks in the soft x-rays, we will observe in the optical the Raleigh-Jeans tail of the blackbody, where the flux is reduced by a factor from its peak value.
From the above discussion, we can estimate the conditions under which the recombination transient is a relevant source of emission. Using Eq. 24 and assuming a simple mass-radius relation , we find that the optical luminosity of the RT exceeds that of fallback and accretion, respectively, when the mass of the disrupted star exceeds
| (30) |
and
| (31) |
Figure 5 depicts the relevant - domain where the RT is likely to contribute significantly to the optical luminosity. While these estimates are subject to several uncertainties, it appears that the RT of disruptions will be most relevant when . For more massive black holes, disruption of larger stars may be necessary. The RT appears to be comparable to or brighter than the optical emission resulting from the reprocessing of x-rays in the unbound debris, studied by Strubbe & Quataert (2009). However, if the super-Eddington outflows also discussed by Strubbe & Quataert (2009) occur, their optical luminosity can, for certain wind parameters, be as high as ergs, which would completely dominate the RT of even massive stars, at least at early times.
Even if the RT luminosity falls below the other sources, it may be discernible if it is separated in time. From Eq. 19, the ratio of the RT timescale, to the accretion/fallback timescales, , is
| (32) |
Thus for black holes the RT might be observable as a precursor to the black hole accretion and fallback signatures (Figure 5). In this case it may serve as a confirming signature that the event being witnessed is in fact a tidal disruption event.
The detection of disruption transients also requires that the optical emission reach some significant fraction of the luminosity of the host galaxy nucleus. At a distance of 400 Mpc, ground based optical surveys with a resolution of a ” will only resolve a kiloparsec-sized bulge. McLure & Dunlop (2002) give a empirical correlation between bulge luminosity and central black hole mass. For , the bulge luminosity , and only the disruption of stars could contribute of the core brightness for galaxies. For , on the other hand, the disruption of stars would outshine the galaxy and be easily detectable. However, firm evidence for the assumed correlation below is still lacking.
6.2. Detection Rates
Observational surveys are being designed which will probe the magnitude range ( to ) of the recombination transients. LSST, for example, will reach an R-band magnitude of mag per shot. In this case, a disruption would be detectable out to Mpc, the distance to the Coma cluster, while an disruption would be detectable much further out, to .
Wang & Merritt (2004) derived a total disruption rate for early-type galaxies and bulges by combining an expression for the disruption rate
| (33) |
with Ferguson & Sandage (1991) E+SO luminosity function for the galaxy luminosities . They found a rate per unit volume of , with galaxies with dominating the consumption rate. Assuming that galaxies with hosting black holes are at least as common, we estimate that LSST may detect RTs of more massive stars at a rate of , where is the fraction of total disruptions of stars with .
The major uncertainty in this rate is whether low luminosity galaxies contain a nuclear black hole, as M32 is currently the faintest system () for which there is solid kinematical evidence. The galaxies in question are dwarf elliptical (dE) galaxies, which are the most numerous type of galaxy in the Universe. Tidal disruption events are also more common in dE galaxies, and if they contain nuclear black holes they should dominate the total tidal flaring rate. Assuming that only nucleated dE galaxies (dEn) contain black holes, Wang & Merritt (2004) found a total tidal disruption for dEn in Virgo of . The overall rates in the Coma Cluster are expected to be significantly larger. These event rates will be even higher if moderately massive black holes are present in every dE galaxy or in bulges of late-type spirals.
Suggestive evidence has accumulated that intermediate mass black holes () exist in some globular clusters (e.g. Noyola et al., 2008). The rate of tidal disruption events in these systems is expected to be per globular cluster (Baumgardt et al., 2004). Taking a globular cluster space density of (Brodie & Strader, 2006) we estimate the density rate of RT to be at most . In this case, LSST should detect RT events arising from the disruption of a star with a rate of . The globular cluster luminosity function in the galaxies studied to date (Brodie & Strader, 2006) is well fit by a Gaussian distribution with a peak and . The RT should thus easily outshine the cluster’s optical luminosity. Non-detection of flares after a few years would argue against the existence of intermediate mass black holes in globular clusters.
7. Summary and Conclusions
The purpose of this paper is has been to explore whether the unbound debris of tidal disruption might give rise to luminous optical emission, and to determine under what conditions this emission may be observationally relevant. The analytical results predict a brief (3-5 day) optical transient with peak luminosities in the range . The energy for the emission is stored mostly in the ionization energy of hydrogen, and is released when the ejecta becomes neutral and transparent at temperatures K. This physics will be relevant not only for the tidal disruption of stars by massive black holes, but to the weak ejection of hydrogen envelopes in general by, e.g., stellar collisions or pulsations.
The predicted bolometric luminosities of the recombination transients fall into the interesting – that is to say, relatively unexplored – range between novae and supernovae. Upcoming synoptic surveys will begin to probe these sorts of intermediate events. The RT of 1 stars are relatively dim events which would only be visible in the nearby universe ( Mpc). The disruption of more massive stars (), on the other hand, can be quite bright. Such events may not be as rare as one might first expect. There is strong evidence that the initial mass function of stars within the Galactic center is top heavy (Alexander, 2005). Perhaps massive stars are more common in the cores of other galaxies as well.
For massive black holes, , the optical luminosity from the accretion of bound material likely surpasses the emission from the unbound debris. Nevertheless, the RT may still be discernible as a precursor, and may provide a important complementary signature. While the properties of the accretion flare depends most sensitively on the black hole mass, the luminosity of the RT depends primarily on the properties of the disrupted star, with little dependence on . In principle observations of both components would allow one to solve for the parameters of the event, providing insight into both the black hole mass and stellar population in the centers of distant galaxies. More basically, detection of a RT would provide confirmation that the event witnessed was in fact a legitimate tidal disruption,
Recombination transients appear to be of greatest interest for probing lower mass black holes (). In these systems, the optical luminosity of the transient is likely to exceed that of accretion, and should outshine the nucleus of the galaxy. This offers one means of searching for low mass black holes in dwarf galaxies, or for intermediate mass black hole in globular clusters. If black holes do lurk in these numerous locations, the recombination transient might be the most prominent optical signature of a stellar disruption.
References
- Alexander (2005) Alexander, T. 2005, Phys. Rep., 419, 65
- Baumgardt et al. (2004) Baumgardt, H., Makino, J., & Ebisuzaki, T. 2004, ApJ, 613, 1143
- Bogdanović et al. (2004) Bogdanović, T., Eracleous, M., Mahadevan, S., Sigurdsson, S., & Laguna, P. 2004, ApJ, 610, 707
- Brassart & Luminet (2008) Brassart, M., & Luminet, J.-P. 2008, A&A, 481, 259
- Brodie & Strader (2006) Brodie, J. P., & Strader, J. 2006, ARA&A, 44, 193
- Cannizzo et al. (1990) Cannizzo, J. K., Lee, H. M., & Goodman, J. 1990, ApJ, 351, 38
- Carter & Luminet (1983) Carter, B., & Luminet, J.-P. 1983, A&A, 121, 97
- Chandrasekhar (1960) Chandrasekhar, S. 1960, Radiative Transfer (New York: Dover, 1960)
- Donley et al. (2002) Donley, J. L., Brandt, W. N., Eracleous, M., & Boller, T. 2002, AJ, 124, 1308
- Esquej et al. (2007) Esquej, P., Saxton, R. D., Freyberg, M. J., Read, A. M., Altieri, B., Sanchez-Portal, M., & Hasinger, G. 2007, A&A, 462, L49
- Ferguson & Sandage (1991) Ferguson, H. C., & Sandage, A. 1991, AJ, 101, 765
- Gezari et al. (2009) Gezari, S. et al. 2009, ApJ, 698, 1367
- Gezari et al. (2006) —. 2006, ApJ, 653, L25
- Grasberg & Nadezhin (1976) Grasberg, E. K., & Nadezhin, D. K. 1976, Ap&SS, 44, 409
- Guillochon et al. (2008) Guillochon, J., Ramirez-Ruiz, E., Rosswog, S., & Kasen, D. 2008, ArXiv e-prints
- Khokhlov & Melia (1996) Khokhlov, A., & Melia, F. 1996, ApJ, 457, L61+
- Kim et al. (1999) Kim, S. S., Park, M.-G., & Lee, H. M. 1999, ApJ, 519, 647
- Kobayashi et al. (2004) Kobayashi, S., Laguna, P., Phinney, E. S., & Mészáros, P. 2004, ApJ, 615, 855
- Kochanek (1994) Kochanek, C. S. 1994, ApJ, 422, 508
- Krishna Swamy (1961) Krishna Swamy, K. S. 1961, ApJ, 134, 1017
- Lodato et al. (2009) Lodato, G., King, A. R., & Pringle, J. E. 2009, MNRAS, 392, 332
- McLure & Dunlop (2002) McLure, R. J., & Dunlop, J. S. 2002, MNRAS, 331, 795
- Mihalas & Weibel Mihalas (1984) Mihalas, D., & Weibel Mihalas, B. 1984, Foundations of radiation hydrodynamics
- Noyola et al. (2008) Noyola, E., Gebhardt, K., & Bergmann, M. 2008, ApJ, 676, 1008
- Ramirez-Ruiz & Rosswog (2009) Ramirez-Ruiz, E., & Rosswog, S. 2009, ApJ, 697, L77
- Rees (1988) Rees, M. J. 1988, Nature, 333, 523
- Rosswog et al. (2009) Rosswog, S., Ramirez-Ruiz, E., & Hix, W. R. 2009, ApJ, 695, 404
- Shakura & Sunyaev (1973) Shakura, N. I., & Sunyaev, R. A. 1973, A&A, 24, 337
- Strubbe & Quataert (2009) Strubbe, L. E., & Quataert, E. 2009, ArXiv e-prints
- Ulmer (1999) Ulmer, A. 1999, ApJ, 514, 180
- Wang & Merritt (2004) Wang, J., & Merritt, D. 2004, ApJ, 600, 149
- Zel’Dovich & Raizer (1967) Zel’Dovich, Y. B., & Raizer, Y. P. 1967, Physics of shock waves and high-temperature hydrodynamic phenomena