THE PRESENCE OF TWO DISTINCT RED GIANT BRANCHES IN THE GLOBULAR CLUSTER NGC 1851
Abstract
There is a growing body of evidence for the presence of multiple stellar populations in some globular clusters, including NGC 1851. For most of these peculiar globular clusters, however, the evidence for the multiple red giant-branches (RGBs) having different heavy elemental abundances as observed in Centauri is hitherto lacking, although spreads in some lighter elements are reported. It is therefore not clear whether they also share the suggested dwarf galaxy origin of Cen or not. Here we show from the CTIO 4m photometry of the globular cluster NGC 1851 that its RGB is clearly split into two in the color. The two distinct RGB populations are also clearly separated in the abundance of heavy elements as traced by Calcium, suggesting that the type II supernovae enrichment is also responsible, in addition to the pollutions of lighter elements by intermediate mass asymptotic giant branch stars or fast-rotating massive stars. The RGB split, however, is not shown in the color, as indicated by previous observations. Our stellar population models show that this and the presence of bimodal horizontal-branch distribution in NGC 1851 can be naturally reproduced if the metal-rich second generation stars are also enhanced in helium.
1 INTRODUCTION
The first photometric evidence for the presence of multiple stellar populations in globular clusters came from the discoveries of the discrete distributions of stars on the red giant-branch (RGB) and main-sequence (MS) of the most luminous globular cluster Cen (Lee et al., 1999; Bedin el al., 2004). The fact that the distribution of RGB stars is not just showing a spread but is discrete is a compelling evidence for the heavy elements enrichment and the formation of successive metal-enhanced generations of stars in proto- Cen. The similarity of this feature to that of the M54, suggested as a nuclear star cluster of the Sagittarius dwarf galaxy (Layden & Sarajedini, 1997), together with other peculiarities of Cen, has led the community to conclude that Cen was once part of a more massive dwarf galaxy that merged with the Milky way, as the Sagittarius dwarf galaxy is in the process of doing now (Lee et al., 1999; Bekki & Freeman, 2003). In recent years, more and more evidence is reported for the presence of double or multiple stellar populations in other globular clusters, such as NGC 2808 (Piotto et al., 2007), NGC 1851 (Milone et al., 2008), NGC 6388 (Moretti et al., 2009), and M22 (Marino et al., 2009; Da Costa et al., 2009). For most of these peculiar globular clusters, however, the evidence for the discrete distribution of heavy elements as observed in the RGB of Cen is hitherto lacking, although spreads in some lighter elements (Carretta et al., 2008, and references therein) and helium (Lee et al., 2005; D’Antona et al., 2005; Piotto et al., 2007; Yoon et al., 2008) are reported. Therefore, the case of Cen, and now that of M22 (Marino et al., 2009; Da Costa et al., 2009), are still viewed as exceptional, and the presence of chemical inhomogeneity in other globular clusters is largely considered as due to the pollution mechanisms expected in normal globular clusters, such as the winds from the intermediate mass asymptotic giant branch (AGB) stars or fast-rotating massive stars (Ventura & D’Antona, 2008; Decressin et al., 2007).
The purpose of this Letter is to report that one of these globular clusters, NGC 1851, is showing a clear split in the RGB from our CTIO 4m photometry. This is compared with the - photometry (J.-W. Lee et al., 2009a) to confirm that the two distinct RGB populations are different in the abundance of heavy elements. Stellar population models are then constructed to show that, when the metal-rich second generation stars are also enhanced in helium abundance, the split of the RGB discovered in color would not be detected in usual optical colors, such as used in the survey.
2 OBSERVATIONS AND COLOR-MAGNITUDE DIAGRAMS
Our observations were performed using the CTIO 4m Blanco telescope during 2007 November 1316 and 2008 October 2731. The telescope was equipped with the Mosaic II CCD Imager consisting of eight 2k 4k SITe CCDs providing a plate scale of 0.27 arcsec pixel-1 and a field of view of 36 36 arcmin2. All of our science frames were obtained under photometric conditions. The total exposure times for were 3990, 676, and 573s, respectively, split into short, intermediate, and long exposures in each band. NGC 1851 was placed on chip 6, approximately 4.5 arcmin South and 6 arcmin East from the CCD center. Several standard fields (Landolt, 1992, 2007) were also observed during our observing runs. The IRAF111IRAF is distributed by the National Optical Astronomy Observatory, which is operated by the Association of Universities for Research in Astronomy, Inc., under cooperative agreement with the National Science Foundation. MSCRED package was used for preprocessing including bias correction and flat fielding. PSF photometry was then carried out using DAOPHOT II/ALLSTAR(Stetson, 1987), and DAOGROW was used for aperture corrections (Stetson, 1990).
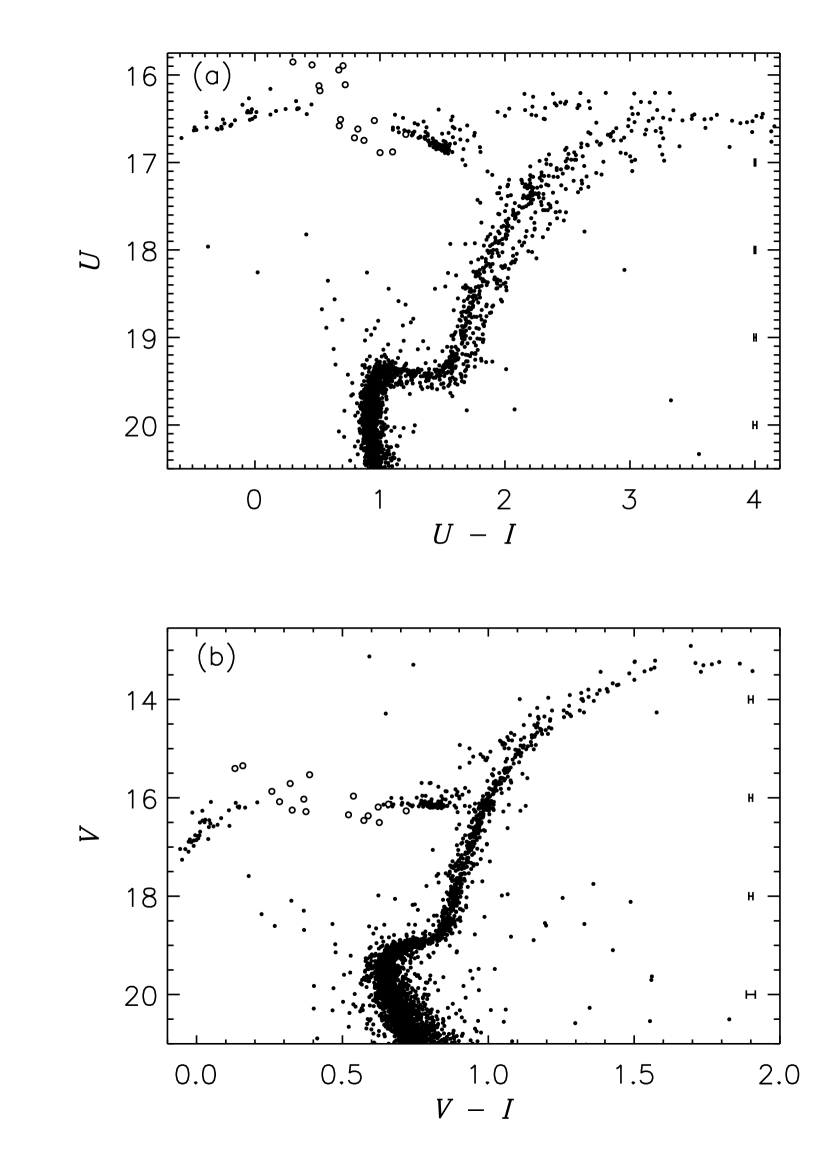
Figure 1 shows color-magnitude diagrams (CMDs) of NGC 1851 in (, ) and (, ) planes. Stars within 3.6 arcsec and outside of 4.5 arcmin from the cluster center are excluded from the CMDs to reduce blending effects and the field star contaminations, respectively. To examine the CMD features more carefully, we adopted the “separation index” (Stetson et al., 2003) for selecting stars that are relatively less affected by adjacent starlights. All the stars in our CMDs lie well within chip 6, and therefore our CMDs are not subject to any uncertainty stemming from the possible chip to chip variations of the mosaic CCDs. Open circles denote RR Lyrae variables in our program field among those identified by Walker (1998), plotted at random phase of pulsation. The most remarkable feature of Figure 1 is the presence of two distinct RGBs in the (, ) CMD. The discrete distribution is clear from the sub giant-branch (SGB) to the tip of RGB where the mean separation on the RGB is 0.27 mag in . When measured at given I magnitude, this value is reduced to 0.20 mag. For the bright RGB stars, some early hints for this feature were noted by Calamida et al. (2007) from the Strömgren (, ) CMD, and by J.-W. Lee et al. (2009a) from the - photometry (e.g. see their Figure 1). Note that Milone et al. (2008) only discovered a split in the SGB, and the split of RGB we discovered in this paper was not detected in their photometry employing F606W and F814W passbands. Similarly, the RGB split is not apparent in our (, ) CMD (Figure 1b). This is most likely because the -band is more sensitive to metal abundance variation than other passbands, as more metal atomic and molecular lines are located in the -band (see section 3).
Given the small foreground reddening value of E() 0.02 (Harris, 1996) toward NGC 1851, it is very unlikely that the differential reddening has caused the double RGBs. The color difference between the two RGBs in color, at given mag of the horizontal-branch (HB) level, is 0.20 mag, which is about three times larger than the maximum color difference expected in the extreme situation where one group of stars are all reddened by E() 0.02, while the other group has E() 0.00. Also, if the observed color difference in color is due to the differential reddening, it would result in the color difference of 0.10 mag, which would have been detected along the RGB in our (, ) CMD. Similar spatial distributions of stars on the bluer and redder RGBs also indicate that the differential reddening, if any, is not likely the cause of the double RGBs.
3 DISCUSSION
We have shown that the RGB of NGC 1851 is split into two distinct subpopulations. The fact that the distribution of RGB stars does not just show a spread but is discrete can naturally eliminate the possibilities such as (1) star formation from not well mixed inhomogenous interstellar matter, (2) differential reddening (see also section 2), and (3) photometric errors, as all of these would produce a in color rather than a discrete distribution. Consequently, the most plausible interpretation for the double RGBs is that the NGC 1851 underwent metal enrichment in its early stage of evolution and successively formed metal-enhanced second generation stars. Spectroscopic observations show star-to-star abundance variations of the lighter elements (elements lighter than Si, such as N, O, Na, & Al) in NGC 1851 (Hesser, 1982; Yong & Grundahl, 2008; Yong et al., 2009). This is generally interpreted as a result of pollution from winds of intermediate-mass AGB stars (Ventura & D’Antona, 2008) or fast-rotating massive stars (Decressin et al., 2007). Based on the elemental abundances observed by Yong & Grundahl (2008) and Yong et al. (2009) for eight bright RGB stars, we can estimate the differences in the lighter elements between the two RGB populations. Analysis of these data by J.-W. Lee et al. (2009a, see their Figure 3) indicates that, while N, Na, and Al are all enhanced in redder RGB ([N/Fe] 0.47, [Na/Fe] 0.53, [Al/Fe] 0.20), O is depleted ([O/Fe] 0.45), and no significant variation is shown in [C/Fe].
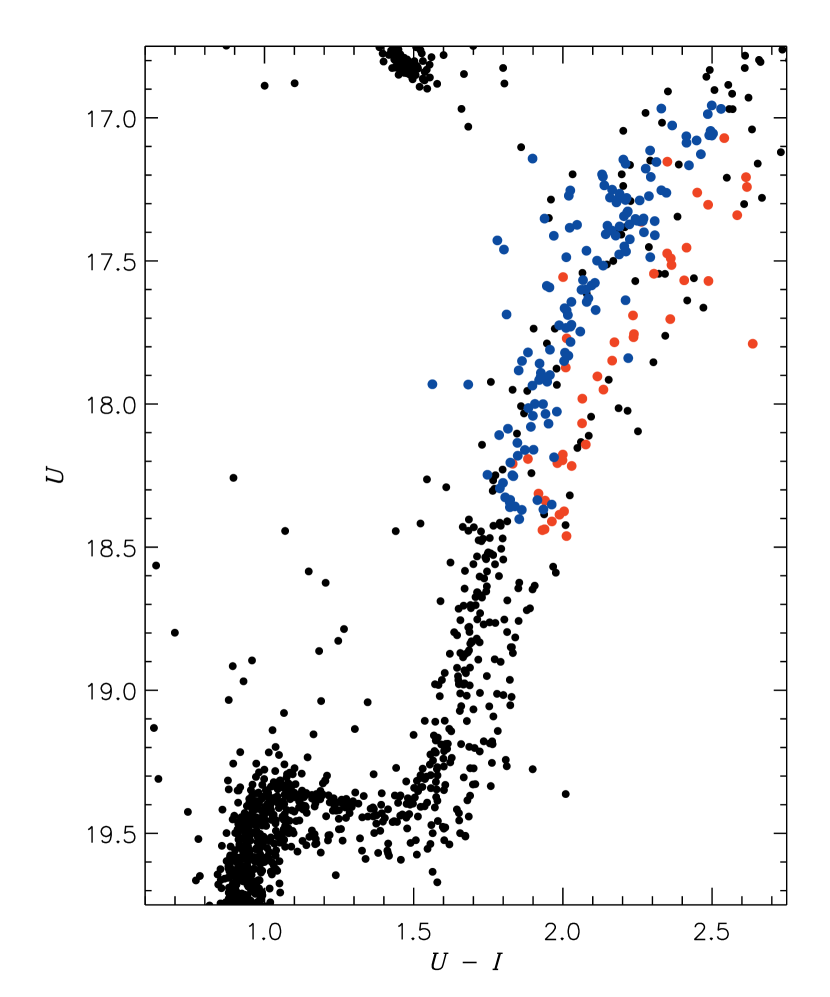
In order to investigate the effect of these elemental variations in the () color, in Figure 2, we have computed the differences in fluxes between two synthetic spectra using the spectral-synthesis program SPECTRUM (Gray & Corbally, 1994), one without and the other with these enhancements (and depletion for O) in lighter elements (panels a & b). Also shown in Figure 2 are for the two additional cases where (1) CNO and Na are enhanced by 0.3 dex while heavier elements are fixed (panels c & d), and (2) elements heavier than Al are enhanced by 0.3 dex while lighter elements are fixed (panels e & f). These simulations demonstrate that small variations either in lighter or heavier elements could cause significant change in () color. The observed variations in the lighter elements alone, however, would cause relatively small line blanketing equivalent to () 0.079 in terms of color difference. Despite uncertainties, taken at face value, this is only 41% of the observed color difference [() 0.195 0.011] at given magnitude and suggests that other effects may also be responsible for the RGB split in () color. Indeed, recent - photometry (J.-W. Lee et al., 2009a) shows that besides lighter elements variations, RGB stars of NGC 1851 also show bimodal distribution in Ca, which can only be supplied by Type II supernovae (SNe II; Timmes et al., 1995). In Figure 3, we show in our (, ) CMD the “Ca-normal” and “Ca-strong” stars from J.-W. Lee et al. (2009a). The Ca-strong stars lie well on the redder RGB sequence, whereas the Ca-normal stars are on the bluer RGB. According to J.-W. Lee et al. (2009b), the difference in Ca abundance is estimated to be [Ca/H] 0.15 dex, and other heavy elements, albeit small, are similarly enhanced in redder RGB population. We conclude therefore that the redder RGB population is richer than the bluer RGB population not only in lighter elements (N, Na, & Al) but also in heavy elements (such as Ca, Si, Ti, & Fe).
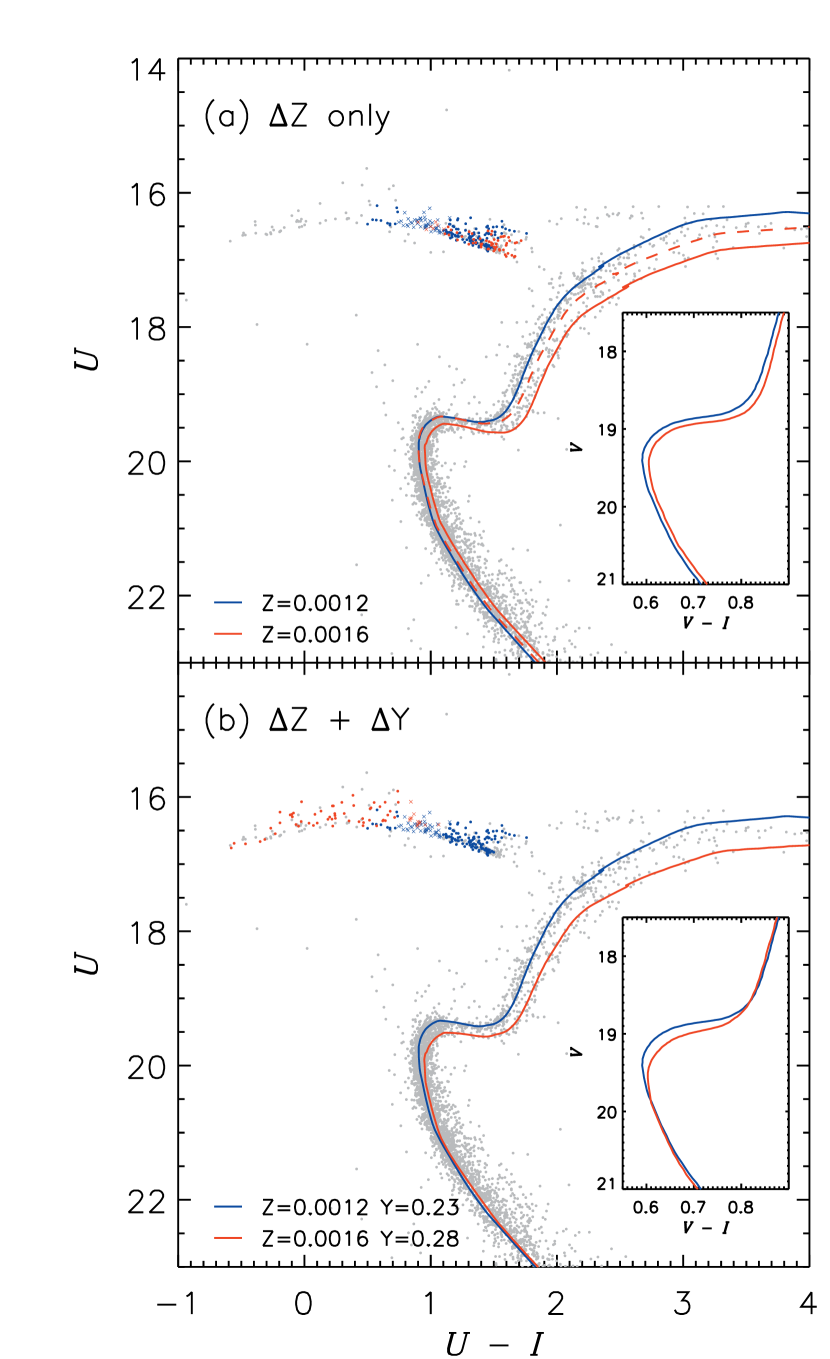
In order to better understand the origin of the RGB color difference in (), and to place stronger constraints on the chemical combinations of the two subpopulations, we have constructed stellar population models based on the updated version of the Yonsei-Yale () isochrones (Yi et al., in preparation) and HB evolutionary tracks (Han et al., in preparation). Readers are referred to Yoon et al. (2008) and references therein for the details of our model construction. Figure 4 presents our synthetic CMDs for NGC 1851 in (, ) and (, ) planes. Our models are constructed under two different assumptions regarding the chemical enrichment in NGC 1851. First, we assumed that the second generation population is more enhanced in metallicity, but not in helium (Figure 4a; hereafter Z-only model). Note that, while Cassisi et al. (2008) and Salaris et al. (2008) suggested the difference in only CNO abundance, here we are assuming the difference in overall metallicity of 0.15 dex as discussed above. Second, in Figure 4b, we then assumed that both metal and helium abundances are enhanced (hereafter Z+Y model). The flux is very sensitively affected by CN and NH bands, and therefore by N abundance. In order to reflect this effect in the (, ) CMD of the second generation population (redder RGB), we are also including the effects of the additional line absorptions from the enhancements in N and other lighter elements as discussed above, again by using SPECTRUM. More rigorous modeling should include the effects of these lighter elements enhancements in the construction of stellar evolutionary tracks, but we note that Dotter et al. (2007) found the enhancement in N has only negligible effect in the HR diagram morphology at globular cluster ages.
Comparison of the number ratio between the two subpopulations suggests that bluer RGB, brighter SGB, and redder HB are associated with one subpopulation, which we refer to as “Pop-1”, while the redder RGB, fainter SGB, bluer HB are associated with the other subpopulation, which we refer to as “Pop-2”. Pop-1 comprises about 75% of the total population, while Pop-2 takes about 25% of the whole population222We have compared the ratio of the two subpopulations with samples selected in different manners (e.g. entire sample and a sample selected with various separation indices) and for all cases, the ratio comes out to be similar. This is also more or less consistent with the population ratio based on the SGB stars reported in Milone et al. (2009).. The Z-only model in Figure 4a (Z = 0.0004 and age = 0.1 Gyr) matches well with the observed CMD from the MS through the RGB in (, ) CMD. Yet, the model fails to reproduce the blue HB and the narrow RGB in (, ) CMD (Figure 4a, inset). This is because metal enhancement in Pop-2 moves HB to the opposite direction, i.e., makes HB morphology redder (see for example Lee et al., 1994). At the same time, the increase in metallicity, albeit small, will create a gap in () color between the two RGBs which is not shown in the observed CMD (Milone et al., 2008). Therefore, the Z-only model is in conflict with the observed CMDs of NGC 1851. Figure 4b shows that the Y+Z model (Z 0.0004, age 0.1Gyr, and Y 0.05) is in good agreement with the observation from the MS to the HB. Note that, in our modeling, we are just employing the standard Reimers (1977) mass-loss law, and the same mass-loss parameter for both normal helium and enhanced helium populations. Input parameters adopted in our Y+Z model are listed in Table 1. The enhanced helium in Pop-2 easily overcomes the effect of metallicity on HB (see Lee et al., 2005), shifting HB morphology toward blue and reproducing the observed HB bimodality. At the same time, the increase in helium abundance in Pop-2 moves RGB slightly bluer and this effect cancels out the metallicity effect in (, ) CMD, making apparently single and narrow RGB. Also, the model (Figure 4b, inset) is in better agreement with the observed SGB split(Milone et al., 2008). The -band is much more sensitive to metal line blanketing, and therefore the increased helium has relatively small effect on color of RGB. One caveat to this helium enhanced scenario is that the blue HB in our model appears to be slightly brighter (0.05 mag) than the observation in -band, although this could be due to the uncertainty in bolometric correction of the -band.
The apparent helium enhancement in the second generation subpopulation in NGC 1851 is reminiscent of the cases of other globular clusters with multiple populations, including Cen (Norris, 2004; Lee et al., 2005; Piotto et al., 2005), NGC 2808 (Lee et al., 2005; D’Antona et al., 2005), NGC 6388 and NGC 6441 (Caloi & D’Antona, 2007; Yoon et al., 2008). Although the origin of this helium enhancement is currently not fully understood, general consensus is that it can be supplied either by SNe II (Norris, 2004; Piotto et al., 2005) or by the intermediate mass AGB stars or fast-rotating massive stars (Ventura & D’Antona, 2009; Decressin et al., 2007). In the case of NGC 1851, given the enhancements both in the lighter (such as N) and heavy (such as Ca) elements in the second generation population (Pop-2), all of the mechanisms seem to be responsible for the helium enhancement. A possible scenario is that, soon after the formation of the first generation stars (Pop-1), numerous SNe II explosions enriched both metal and helium of the leftover gas in the proto-NGC 1851. Winds and ejecta from the intermediate mass AGB stars may have added more helium and simultaneously enhance lighter elements. The second generation stars (Pop-2) would have then formed from the gas enriched in overall metallicity, helium, and lighter elements. We note that the present mass (; Pryor & Meylan, 1993) of NGC 1851 is too small to retain the ejecta from numerous SN explosions (Baumgardt et al., 2008; Dopita & Smith, 1986). Therefore, as in Cen (Lee et al., 1999; Bekki & Freeman, 2003), we suggest that NGC 1851 is most likely the remaining core of more massive primeval dwarf galaxies that merged and disrupted to form the proto-Galaxy, as recently proposed by Lee et al. (2007) for the origin of globular clusters with the extended HB. Our result presented here is calling a new survey of globular clusters employing and/or Calcium filters in order to detect small difference in metallicity expected in the yet to be identified globular clusters with multiple populations. High resolution spectroscopy of stars in the two distinct groups are also needed to confirm the small difference in the abundance of heavy elements.
References
- Baumgardt et al. (2008) Baumgardt, H., Kroupa, P., & Parmentier, G. 2008, MNRAS, 384, 1231
- Bedin el al. (2004) Bedin, L. R., Piotto, G., Anderson, J., Cassisi, S., King, I. R., Momany, Y., & Carraro, G. 2004, ApJ, 605, L125
- Bekki & Freeman (2003) Bekki, K., & Freeman, K. 2003, MNRAS, 346, 11
- Calamida et al. (2007) Calamida, A., et al. 2007, ApJ, 670, 400
- Caloi & D’Antona (2007) Caloi, V., & D’Antona, F. 2007, A&A, 463, 949
- Carretta et al. (2008) Carretta, E., Bragaglia, A., Gratton, R. G., & Lucatello, S. 2008, astro-ph 0811.3591
- Cassisi et al. (2008) Cassisi, S., Salaris, M., Pietrinferni, A., Piotto, G., Milone, A. P., Bedin, L. R., & Anderson, J. 2008, ApJ, 672, L115
- Da Costa et al. (2009) Da Costa, G. S., Held, E. V., Saviane, I., & Gullieuszik, M. 2009, astro-ph 0909.5265
- D’Antona et al. (2005) D’Antona, F., Bellazzini, M., Caloi, V., Pecci, F. F., Galleti, S., & Rood, R. T. 2005, ApJ, 631, 868
- Decressin et al. (2007) Decressin, T., Meynet, G., Charbonnel, C., Prantzos, N., & Ekström, S. 2007, A&A, 464, 1029
- Dopita & Smith (1986) Dopita, M. A., & Smith, G. H., 1986, ApJ, 304, 283
- Dotter et al. (2007) Dotter, A., Chaboyer, B., Ferguson, J. W., Lee, H.-c., Worthey, G., Jevremović, D., & Baron, E. 2007, ApJ, 666, 412
- Gray & Corbally (1994) Gray, R. O., & Corbally, C. J., 1994, AJ, 107, 742
- Green et al. (1987) Green, E. M., Demarque, P., & King, C. R. 1987, The Revised Yale Isochrones & Luminosity Functions (New Haven, CT: Yale Univ. Obs.)
- Harris (1996) Harris, W. E. 1996, AJ, 112, 1487
- Hesser (1982) Hesser, J. E., Bell, R. A., Harris, G. L. H., & Cannon, R. D. 1982, AJ, 87,1470
- Landolt (2007) Landolt, A. U. 2007, AJ, 133, 2502
- Landolt (1992) Landolt, A. U. 1992, AJ, 104, 340
- Layden & Sarajedini (1997) Layden, A., & Sarajedini, A. 1997, ApJ, 486, L107
- J.-W. Lee et al. (2009a) Lee, J.-W., Lee, J., Kang, Y.-W., Lee, Y.-W., Han, S.-I., Joo, S.-J., Rey, S.-C., & Yong, D. 2009a, ApJ, 695, L78
- J.-W. Lee et al. (2009b) Lee, J.-W., Kang, Y.-W., Lee, J., & Lee, Y.-W. 2009b, Nature, in press
- Lee et al. (2007) Lee, Y.-W., Gim, H. B., & Casetti-Dinescu, D. 2007, ApJ, 661, L49
- Lee et al. (2005) Lee, Y.-W., et al. 2005, ApJ, 621, L57
- Lee et al. (1999) Lee, Y.-W., Joo, J.-M., Sohn, Y.-J., Rey, S.-C., Lee, H.-c., & Walker, A. R. 1999, Nature, 402, 55
- Lee et al. (1994) Lee, Y.-W., Demarque, P., & Zinn, R. 1994, ApJ, 423, 248
- Marino et al. (2009) Marino, A. F., Milone, A. P., Piotto, G., Villanova, S., Bedin, L. R., Bellini, A., & Renzini, A. 2009, astro-ph 0905.4058
- Milone et al. (2009) Milone, A. P., Stetson, P. B., Piotto, G., Bedin, L. R., Anderson, J., Cassisi, S., & Salaris, M. 2009, A&A, 503, 755
- Milone et al. (2008) Milone, A. P., et al. 2008, ApJ, 673, 241
- Moretti et al. (2009) Moretti, A., et al. 2009, A&A, 493, 539
- Norris (2004) Norris, J. E. 2004, ApJ, 612, L25
- Piotto et al. (2007) Piotto, G., et al. 2007, ApJ, 661, L53
- Piotto et al. (2005) Piotto, G., et al. 2005, ApJ, 621, 777
- Pryor & Meylan (1993) Pryor, C., & Meylan, G. 1993, Structure and Dynamics of Globular Clusters (ASP Conf. Ser. 50), ed. S. G. Djorgovski & G. Meylan (San Francisco, CA: ASP), 357
- Reimers (1977) Reimers, D. 1977, A&A, 57, 395
- Salaris et al. (2008) Salaris, M., Cassisi, S., & Pietrinferni, A. 2008, ApJ, 678, L25
- Stetson (1990) Stetson, P. B. 1990, PASP, 102, 932
- Stetson (1987) Stetson, P. B. 1987, PASP, 99, 191
- Stetson et al. (2003) Stetson, P. B., Bruntt, H., & Grundahl, F. 2003, PASP, 115, 413
- Timmes et al. (1995) Timmes, F. X., Woosley, S. E., & Weaver, T. A. 1995, ApJS, 98, 617
- Ventura & D’Antona (2009) Ventura, P., & D’Antona, F. 2009, A&A, 499, 835
- Ventura & D’Antona (2008) Ventura, P., & D’Antona, F. 2008, MNRAS, 385, 2034
- Walker (1998) Walker, A. R. 1998, AJ, 116, 220
- Yong & Grundahl (2008) Yong, D., & Grundahl, F. 2008, ApJ, 672, L29
- Yong et al. (2009) Yong, D., Grundahl, F., D’Antona, F., Karakas, A. I., Lattanzio, J. C., & Norris, J. E. 2009, ApJ, 695, L62
- Yoon et al. (2008) Yoon, S.-J., Joo, S.-J., Ree, C. H., Han, S.-I., Kim, D.-G., & Lee, Y.-W. 2008, ApJ, 677, 1080

| Parameter | Population 1 | Population 2 |
|---|---|---|
| 0.0012 | 0.0016 | |
| 0.2324 | 0.282 | |
| /Fe | 0.3 | 0.3 |
| Age | 10.7 Gyr | 10.6 Gyr |
| aaReimers (1977) mass-loss parameter | 0.59 | 0.59 |
| bbMean mass-loss on the RGB () | 0.2337 | 0.2218 |
| ccMass dispersion on the HB () | 0.015 | 0.015 |
| Population ratio | 0.7 | 0.3 |