Adaptive Optics Imaging of A Massive Galaxy Associated with a Metal-rich Absorber
Abstract
The damped and sub-damped Lyman-alpha absorption line systems in quasar spectra are believed to be produced by intervening galaxies. However, the connection of quasar absorbers to galaxies is not well-understood, since attempts to image the absorbing galaxies have often failed. While most DLAs appear to be metal-poor, a population of metal-rich absorbers, mostly sub-DLAs, has been discovered in recent studies. Here we report high-resolution K-band imaging with the Keck Laser Guide Star Adaptive Optics system of the field of quasar SDSSJ1323-0021 in search of the galaxy producing the sub-DLA absorber. With a metallicity of 2-4 times the solar level, this absorber is of the most metal-rich systems found to date.
Our data show a large bright galaxy with an angular separation of only 1.25 from the quasar, well-resolved from the quasar at the high resolution of our data. The galaxy has a magnitude of , which corresponds to a luminosity of . Morphologically, the galaxy is fit with a model with an effective radius, enclosing half the total light, of kpc and a bulge-to-total ratio of 0.4-1.0, indicating a substantial bulge stellar population. Based on the mass-metallicity relation of nearby galaxies, the absorber galaxy appears to have a stellar mass . Given the small impact parameter (9.0 kpc at the absorber redshift), this massive galaxy appears to be responsible for the metal-rich sub-DLA. The absorber galaxy is consistent with the metallicity-luminosity relation observed for nearby galaxies, but is near the upper end of metallicity. Our study marks the first application of laser guide star adaptive optics for study of structure of galaxies producing distant quasar absorbers. Finally, this study offers the first example of a massive galaxy with a substantial bulge producing a metal-rich absorber.
1 Introduction
Quasar absorption line systems provide a unique means to probe the evolution of interstellar gas to high redshifts (). The damped Lyman-alpha absorbers (DLAs), with H I column densities log and the sub-DLAs ( log ), constitute a large fraction of the neutral gas in galaxies and are thus believed to be an important link in understanding the star formation history of the Universe. DLAs/subDLAs remain the only class of galaxies at cosmologically significant redshifts with detailed measurements of element abundances and can thus trace chemical evolution of galaxies over of the cosmic history.
In order to fully use the DLA abundance data to study cosmic chemical evolution in the context of present-day galaxies, it is necessary to combine the abundance information with information on morphologies, luminosities, colors, and star formation rates from direct imaging. However, it has proven hard to obtain this information for most DLA absorbers and as a result, the type of galaxies giving rise to the DLAs is far from clear. DLAs are thus variously thought to arise in luminous spirals (e.g., Wolfe et al. 1986), or gas-rich dwarf galaxies (e.g., York et al. 1986; Matteucci, Molaro, & Vladilo 1997), or merging proto-galactic fragments in cold dark matter cosmologies (e.g., Haehnelt et al. 1998), or low surface brightness galaxies (e.g., Jimenez et al. 1999), or collapsing halos with merging clouds (e.g., McDonald & Miralda-Escude 1999).
The lack of substantial chemical evolution found in studies of element abundances in DLAs (e.g., Kulkarni et al. 2005, Péroux et al. 2006b) shows that the currently known population of DLAs seems to be dominated by metal-poor objects. On the other hand, there are some recent indications that a few low- absorbers may be highly enriched–with near-solar or supersolar metallicities (see, e.g., Konig et al. 2006; Péroux et al. 2006a; Gharanfoli et al. 2007; Meiring et al. 2009b and references therein). Such metal-rich absorbers could potentially contribute substantially to the cosmic metal budget (e.g., Péroux et al. 2006b; York et al. 2006; Prochaska et al. 2006; Kulkarni et al. 2007; Khare et al. 2007). It is therefore of special interest to image the metal-rich absorbers.
The primary difficulty in imaging the galaxies producing DLA/sub-DLA absorbers is the small angular separation of the galaxy from the (much brighter) background quasars. High angular resolution imaging is thus essential to study the stellar nature of the absorber galaxies. Adaptive optics (AO) offers a greatly promising technique to achieve the necessary angular resolution. In an earlier work (Chun et al. 2006) we reported the first AO imaging study of a few low-redshift DLAs/sub-DLAs, which uncovered several faint compact objects near the quasars. Here, we report results from our Keck laser guide star AO observations of the field of SDSSJ1323-0021, a quasar at with an absorber at .
This absorber was chosen for our study because it is one of the highest metallicity absorbers known. The H I column density was derived by Khare et al. (2004) to be log from a Voigt profile fit to the Lyman- absorption line covered in archival HST UV spectra (from HST program GO 9382, PI Rao). Khare et al. (2004) reported a metallicity of [Zn/H]=+0.4 based on medium-resolution MMT blue channel spectra. To check this extremely high metallicity value, Péroux et al. (2006a) obtained 4.7 km s-1 resolution spectra using the Very Large Telescope (VLT) Ultra-violet Visible Echelle Spectrograph (UVES). Based on multi-component Voigt profile fitting of the metal lines in these high-resolution spectra, Péroux et al. (2006a) verified the high metallicity. Using the value derived by Khare et al. (2004), Péroux et al. (2006a) derived [Zn/H] = , [Fe/H] = , [Cr/H] , [Mn/H] = , and [Ti/H] = . We note that Prochaska et al. (2006) reported a value of log for the same absorber from the same HST data, while Rao et al. (2006) reported log . The uncertainty in the value stems from the low S/N in the HST UV spectrum. The metallicity estimate of course would be lower if a higher value was adopted. In any case, it appears that this absorber is at least 2 times solar in metallicity, and thus one of the most metal-rich absorbers known. Furthermore, the large depletions of Fe, Cr, and Ti relative to Zn indicate that the absorber is dusty. Throughout this paper, we adopt the metallicity [Zn/H] = +0.61 for the nearly undepleted element Zn derived by Péroux et al. (2006a) using log , which they point out gives the smallest residual with respect to the HST Lyman-alpha data.
The AO imaging data presented here were obtained with the goal of detecting and better understanding the galaxy underlying the absorber toward SDSSJ1323-0021. The Keck LGSAO system offers higher spatial resolution as well as sensitivity in the near-IR compared to previous imaging observations of DLAs, and thus offers an unprecedented look at a highly interesting absorber galaxy. Section 2 describes the observations and data reduction. Section 3 details the procedure adopted for the subtraction of the quasar point spread function. Section 4 describes the results, while section 5 presents a discussion.
2 Observations and Data Reduction
Near-infrared images of the field around SDSSJ1323-0021 were obtained on UT 23 May 2007 under photometric conditions with the Keck laser guide star adaptive optics system (Wizinowich et al. 2006) and the NIRC2 near-infrared camera. The narrow camera with a plate scale of per pixel, and a field of view of was used. 106 exposures of 30 second duration each were obtained in the K´ filter in a standard 9-point dither sequence for a total on-source integration of 3180 seconds.
Standard data reduction techniques for near infrared imaging were used to produce the final image. Individual frames were sky-subtracted and flat-fielded. Separate sky frames were constructed for each individual exposure by averaging source-masked dithered frames taken within 10 minutes of the individual exposure. Flat-fields were constructed from dome flat images with the lamps on and off. Bad pixels were identified as hot pixels in short dark frames, as dead pixels in flat frames, and as pixels with large standard deviations in either of the dark or flat sequences.
Individual frames were registered to the nearest pixel (10 milliarcseconds) using the centroid of the quasar and then combined with an average excluding bad pixels and deviations in the image stack. The integer pixel registration is sufficient for these data since in all cases we have at least six pixels across the FWHM of the images. In the final mosaiced image, the FWHM measured from the quasar is 80 milliarcseconds and the Strehl ratio was estimated to be between 12% using the Keck nirc2strehl IDL routine applied to the quasar image itself.
Object detection was performed using SExtractor (Bertin & Arnouts 1996) and the quasar subtracted images. Images were flux calibrated using observations of photometric standard stars taken before and after each quasar. We estimate a limiting magnitude of 21.8 magnitude per square arcsecond (, 1 square arcsec aperture).
3 Point spread function subtraction
Detecting and classifying objects close to the line of sight to the quasar in broadband images is limited by our ability to estimate the distribution of light from the quasar itself. For images obtained with adaptive optics systems we must contend with a PSF that varies with time. We have found that the most reliable means of obtaining a calibration PSF is from in situ measurements from the quasar images themselves. To explore the line of sight close to the quasar, we performed a two-step procedure. First, we removed the azimuthal average PSF constructed from the final mosaic image. This azimuthal high-pass filter removes the overall profile of the quasar and any component in the image centered on the quasar and azimuthally symmetric. An important negative consequence of this is that if the galaxy giving rise to the absorption is centered directly on the quasar line of sight and is azimuthally symmetric, it will be removed in this process. In addition to the azimuthal average PSF we remove the six-fold and four-fold azimuthally symmetric components of the PSF. The six-fold pattern arises from diffraction off the hexagonal shaped primary mirror and secondary support structure. The latter causes flares to sweep out across the image over the course of the observation. A four-fold pattern can arise due an alternating piston error in the deformable mirror actuators. This checkerboard or waffle pattern can lead to a 4-fold pattern from the diffraction off the surface of the mirror. This ”waffle” mode is suppressed largely within the system control software (van Dam et al. 2004) and we generally see little evidence of it in the PSFs except in the brightest of objects.
Removing the azimuthal average image leaves a number of positive and negative features in the image within about of the quasar. To understand if these features are artifacts of the PSF subtraction we project the residual image onto a basis set that describes the temporal variations of the PSF within the sequence (Chun et al. 2006). This procedure, commonly known as a Principle Component Analysis or the Karhunen-Loeve basis set, provides a set of eigenvectors describing the PSF variations and the eigenvalues as a measure of the importance of each eigenfunction in the basis set. Since we derive the basis set from the image sequences themselves, the basis set includes noise. We therefore first perform the azimuthal average subtraction, then run the object detection algorithm (e.g. SExtractor) to find candidate objects in the field. Any object found within of the quasar direction is then subjected to the question of whether it is a result of the PSF subtraction. The object image is then projected on to the first few terms in our basis set to provide an estimate of the image content that arises simply due to PSF variations. If the candidate object has any projection onto any of the first six eigenmodes, then we remove the object from the detection list. Inside of a radius of about the noise in the residual image is dominated by the residual from the PSF subtraction. In the end, there was only one detected object that satisfied these conditions.
4 Results
Fig. 1 shows the deepest region in the final image of the field of SDSSJ1323-0021. A galaxy (G) separated from the quasar is clearly detected and corresponds to the object found by SExtractor. Fig. 2(a) shows a section of this image. Fig. 2(b) shows the same region after PSF subtraction. Since the residuals within the central 0.5 ″are consistent with being produced in the PSF subtraction, we do not consider them real. To obtain a better visual understanding of galaxy G, we show in Fig. 2(c) the PSF-subtracted image after smoothing by a Gaussian profile with a kernel radius of 5 pixels. Finally Fig. 2(d) shows a contour plot of the smoothed PSF-subtracted image from Fig. 2(c).
The properties of the detected galaxy are listed in Table 1. While we do not have a spectral confirmation of the redshift, given the small angular separation, the chance of galaxy G being a random interloper is low. For example, based on Fig. 1(b) of Chen & Lanzetta (2003), the number of random galaxies within a radius of with luminosity of is . We therefore believe that galaxy G is associated with the absorber.
At the redshift of the absorber, the angular separation corresponds to a physical impact parameter of kpc (assuming km/s/Mpc, = 0.3, and ). Both GALFIT (Peng et al. 2002) and GIM2D (Simard et al. 2002) were used to analyse the object morphology. This analysis suggests a mostly elliptical profile (GALFIT) with a Sersic n=4.8 to a mixture of bulge and disk morphologies with a bulge-to-total ratio of (GIM2D). The GALFIT profile has an effective radius of 62 pixels or 4 kpc if at the redshift of the absorber. Within this radius the mean signal-to-noise ratio is 1.2 per pixel. Our simulations of n=1 and n=4 galaxies input to GALFIT and GIM2D agree with Häußler et al. (2007) and find that even at these signal-to-noise ratios the two packages can distinguish gross morphological parameters such as the difference between an exponential disk and a pure spheroidal profile.
The apparent magnitude (GALFIT) corresponds to an absolute magnitude of , -25.0, or -25.0 using k-corrections for E, Sa, or Sc type spectral energy distributions, respectively. The k-corrections were estimated using the IRAF-based cosmopack package. (See http://www.iac.es/galeria/balcells/publ_mbc.html). Adopting from Kochanek et al. (2001) but converted to the above cosmology ( for an elliptical and for a late-type galaxy) the galaxy toward Q1323-0021 would have a luminosity of (elliptical) or (late-type spiral). For (GIM2D), the corresponding luminosities are 3.3 (elliptical) and 4.8 (late-type spiral).
We note that the morphological parameters are obtained at a mean signal-to-noise ratio of unity and, in this case, are done within the field of a bright point source. The measured quasar brightness is so there is a factor of approximately ten between the integrated brightnesses of the quasar and the extended galaxy. The gain brought by the adaptive optics system is two-fold: (a) to increase the angular resolution and (b) to dramatically reduce the light in the wings of the point spread function. Together these open the region close to the line of sight for study.
5 Discussion
We have detected a large luminous candidate galaxy that is very likely to be the sub-DLA absorber toward quasar SDSSJ1323-0021. To put the properties of galaxy G in context, in Fig. 3 we show the near-IR luminosity-metallicity relation for galaxies in the Kitt-Peak International Spectrographic Survey (KISS) from Salzer et al. (2005). The two panels show two different fits to the near IR luminosity-metallicity (-) relation from Salzer et al. (2005), based on different calibrations of the relation between emission-line metallicity and the strong-line diagnostic . The left panel shows the near-IR - relation derived using the calibration of Edmunds & Pagel (1984) , while the right panel uses the calibration of Kennicutt, Bresolin, & Garnett (2003). The larger solid filled circle shows the Zn absorption metallicity of the sub-DLA toward SDSSJ1323-0021 from Péroux et al. (2006a), translated into a corresponding O/H value. We have taken the solar abundance to be log O/H + 12 = 8.66. The absorber toward SDSSJ1323-0021 appears to be at the upper end of the metallicity-luminosity relation. If we adopt the alternative K-band - relation derived by Salzer et al. (2005) with the calibration of Kennicutt, Bresolin, & Garnett (2003), the absorber toward SDSSJ1323-0021 appears to be more extreme compared to the KISS galaxies. In either case, the absorber appears to be a highly luminous galaxy. This conclusion is not altered even if the metallicity of the absorber is somewhat lower.
Fig. 4 compares the stellar mass vs. metallicity (-) relationship for nearby galaxies from Tremonti et al. (2004) with the metallicity of the absorber toward SDSS1323-0021. Even at the upper envelope of the - relation, the metallicity of the absorber (adopted from Péroux et al. 2006a) implies a stellar mass of at least . (We note, however, that the stellar mass would be lower if the metallicity is lower. For example, if the metallicity is lower by 0.3 dex, the most likely stellar mass would be about , as inferred from the most probable - relation.)
We conclude that the supersolar metallicity absorber toward SDSS1323-0021 arises in a massive galaxy at an impact parameter of 9 kpc. The morphological detail seen visually in Fig. 2 suggests that the galaxy has a substantial bulge population. The large bulge-to-total ratio indicates a classical bulge, rather than a pseudo-bulge (e.g., Gadotti 2009).
One may wonder whether a line of sight passing through a galaxy at 9 kpc from the galaxy center can have gas of high metallicity. To which we note that the metallicity at the sun’s location (8.5 kpc away from the center of the Milky Way) is solar. Furthermore, the radial metallicity gradients observed in galaxies are weak, and it is not clear whether they even exist at high redshifts, so that the metallicity at a galacto-centric distance of 9 kpc need not be much lower than that near the center of the galaxy. Finally, if the galaxy G is a galaxy with a substantial bulge (as seems to be the case from the morphological analysis), one might expect it to be substantially metal-rich, and its interstellar material to be fairly uniformly enriched.
It is interesting to compare how the clues regarding the type of the absorber galaxy learnt from our imaging study compare with those derived from element abundance studies. Of particular recent interest is the relative abundance of Mn to Fe. In the Milky Way, [Mn/Fe] is found to increase with increasing [Fe/H]. This trend could indicate that Mn is produced primarily in type Ia supernovae (e.g., Samland 1998). Alternately, the trend could arise due to metallicity-dependent yields in type II supernovae (e.g., Woosley, & Weaver 1995; McWilliam et al 2003; Feltzing et al. 2007). Whatever the nucleosynthetic origin of Mn, a trend of increasing [Mn/Fe] with increasing metallicity is also seen in DLAs and sub-DLAs (e.g., Meiring et al. 2009a and references therein). It is possible for dust depletion effects to mask nucleosynthetic effects (e.g. Kulkarni, Fall, & Truran 1997; Ledoux, Bergeron, & Petitjean 2002). However, as discussed in Ledoux et al. (2002) and Meiring et al. (2009a), the [Mn/Fe] trend is likely to reflect nucleosynthetic effects more, because the dust depletion levels of Mn and Fe are roughly similar in warm halo clouds and not too different in warm disk clouds (e.g., Savage & Sembach 1996; Jenkins 2009). Ledoux et al. (2002) noted that the [Mn/Fe] vs. [Zn/Fe] trend in DLAs could not be fitted with any dust depletion sequence, even if non-solar values are considered for the intrinsic Mn/Fe ratio, without considering variations of the intrinsic [Mn/Fe] ratio. As noted by Ledoux et al. (2002), the [Mn/Fe] ratio is subsolar for DLAs, and resembles that in Galactic metal-poor halo stars. For sub-DLAs, the trend of [Mn/Fe] with increasing [Zn/H] resembles that in Galactic bulge stars (although larger abundance samples are clearly needed to verify this trend). This may suggest that sub-DLAs have an older stellar population that got enriched earlier. For the sub-DLA toward SDSSJ1323-0021, [Mn/Fe] = (Péroux et al. 2006a). This [Mn/Fe] value is one of the highest seen among the absorbers, and lies near the upper right end of the trend in Fig. 11 of Meiring et al. (2009a). Such high [Mn/Fe] values have been seen in metal-rich Galactic bulge stars (e.g., McWlliam et al. 2003; Alves-Brito et al. 2006). Thus, the indication from our AO imaging that the metal-rich absorber toward SDSSJ1323-0021 arises in a galaxy with a substantial bulge appears to be consistent with the relative abundances in the absorber.
Our study offers the first example of the LGSAO technique applied to the study of the structure of the stellar content of quasar absorber galaxies. The discovery of a massive, luminous, galaxy with a substantial bulge in one of the most enriched absorbers known is a striking success in finding galaxy counterparts of quasar absorbers. In this case the galaxy is easily detected one arcsecond from the quasar even at though the galaxy is 2.5 mag fainter and extended. Our success in detecting a galaxy counterpart to the supersolar absorber in SDSS1323-0021 is supported by other recent discoveries (though at lower resolution) of candidate galaxies producing other metal-rich absorbers (e.g., Straka et al. 2009; Péroux et al. 2009). Our results are also consistent with the suggestion that most sub-DLAs (at least the metal-rich ones) may arise in more massive galaxies than DLAs (e.g., Khare et al. 2007; Kulkarni et al. 2009).
Since the discovery of the metal-rich absorber toward SDSSJ1323-0021, several more absorbers (primarily sub-DLAs) with solar or supersolar metallicities have been found in other recent studies (e.g., Prochaska et al. 2006; Kulkarni et al. 2007, 2009; Péroux et al. 2008; Meiring et al. 2009b; and references therein). In future, systematic high spatial resolution imaging of more quasar fields with absorbers of known metallicities will be critical for understanding how the stellar populations of metal-rich and metal-poor galaxies differ. A comparison of the images of galaxies underlying DLA and sub-DLA absorbers will also be crucial in understanding whether these two populations are distinct, and how they are related. Spectroscopic confirmation of the galaxy reported in this study should be possible with an integral field spectrograph using AO. Unfortunately, the sensitivity of the near-infrared integral field spectrographs currently available is not adequate at the wavelengths of key interesting lines at the redshift of 0.716. It will therefore be interesting to obtain confirming observations with an AO-supported spectrograph in the future. A combination of high-resolution imaging, emission-line spectroscopy, and absorption-line spectroscopy for a large number of DLAs/sub-DLAs is essential to fully understand where quasar absorbers fit in the big picture of galaxy evolution.
VPK and SG gratefully acknowledge partial support from the National Science Foundation grant AST-0607739 (PI Kulkarni). VPK is also grateful for partial support from the National Science Foundation grant AST-0908890 (PI Kulkarni). Finally, we thank an anonymous referee for constructive comments that helped to improve the paper.
6 References
Alves-Brito, A., Barbuy, B., & Allen, D. M. 2006, IAUS, 241, 231
Bertin, E. & Arnouts, S., 1996, A&AS, 117, 393.
Chen, H.-W., & Lanzetta, K. M. 2003, ApJ, 597, 706
Chun, M. R., Gharanfoli, S., Kulkarni, V. P., & Takamiya, M. 2006, AJ, 131, 686
Feltzing, S., Fohlman, M., & Bensby, T. 2007, A&A, 467, 665
Gadotti, D. A. 2009, MNRAS, 393, 1531
Gharanfoli, S., Kulkarni, V. P., Chun, M. R., & Takamiya, M. 2007, AJ, 133, 130
Haehnelt, M. G., Steinmetz, M., & Rauch, M. 1998, ApJ, 495, 647
Häussler, B. et al. 2007, ApJS, 172, 615
Jenkins, E. B. 2009, ApJ, 700, 1299
Junkkarinen, V. T., Cohen, R. D., Beaver, E. A., Burbidge, E. M., Lyons, R. W. & Madejski, G. 2004, ApJ, 614, 658
Khare, P., Kulkarni, V. P., Lauroesch, J. T., York, D. G., Crotts, A. P. S., & Nakamura, O. 2004, ApJ, 616, 86
Khare, P., Kulkarni, V. P., Péroux, C., York, D. G., Lauroesch, J. T. & Meiring, J. D. 2007, A&A, 464, 487
Konig, B., Schulte-Ladbeck, R. E., & Cherinka, B. 2006, AJ, 132, 1844
Kulkarni, V. P., Fall, S. M., & Truran, J. W. 1997, ApJ, 484, L7
Kulkarni, V. P., Khare, P., Péroux, C., York, D. G., Lauroesch, J. T. & Meiring, J. D. 2007, ApJ, 661, 88 Mattucci, Molaro, & Vladilo 1997
Kulkarni, V. P., Khare, P., Som, D., Meiring, J. D., York, D. G., Péroux, C., & Lauroesch, J. T. 2009, MNRAS, submitted
Ledoux, C., Bergeron, J., & Petitjean, P. 2002, A&A, 385, 802
McDonald, P. & Miralda-Escudé, J. 1999, ApJ, 519, 486
McWilliam, A., Rich, R. M., & Smecker-Hane, T. A. 2003, ApJ, 592, L21
Meiring, J. D., Kulkarni, V. P., Lauroesch, J. T., Péroux, C., Khare, P., & York, D. G. 2009a, MNRAS, 393, 1513
Meiring, J. D., Lauroesch, J. T., Kulkarni, V. P., Péroux, C., Khare, P., York, D. G., & Crotts, A. P. S. 2009b, MNRAS, 397, 2037
Peng, Ho, Impey, &Rix 2002, AJ, 124, 266
Péroux, C., Kulkarni, V. P., Meiring, J., Ferlet, R., Khare, P., Lauroesch, J. T., Vladilo, G. & York, D. G. 2006a, A&A, 450, 53
Péroux, C., Meiring, J. D., Kulkarni, V. P., Ferlet, R., Khare, P., Lauroesch, J. T., Vladilo, G. & York, D. G. 2006b, MNRAS, 372, 369
Péroux, C., Meiring, J. D., Kulkarni, V. P., Khare, P., Lauroesch, J. T., Vladilo, G., & York, D. G. 2008, MNRAS, 386, 2209
Péroux, C., Bouché, N., Kulkarni, V. P., York, D. G., & Vladilo, G. 2009, to be submitted
Pettini, M. et al. 2000, ApJ, 532, 65
Prochaska J. X., O’Meara J. M., Herbert-Fort S., Burles S., Prochter G., Bernstein R., 2006, ApJL, 648, 97
Rao, S. M., Turnshek, D. A., & Nestor, D. B. 2006, ApJ, 636, 610
Salzer, J., Lee, J. C., Melbourne, J., Hinz, J. L., Alonso-Herrero, A., & Jangren, A. 2005, ApJ, 624, 661
Samland, M. 1998, ApJ, 496, 155
Savage, B. D., & Sembach, K. R. 1996, ARAA, 34, 279
Simard, L. et al. 2002, ApJS, 142, 1
Straka, L., Kulkarni, V. P., York, D. G., Woodgate, B. E., & Grady, C. 2009, AJ, submitted
Tremonti, C. A. et al. 2004, ApJ, 613, 898
van Dam, M. A., Le Mignant, D., & Macintosh, B. A. 2004, SPIE, 5490, 174
Wizinowich, P. L. et al. 2006, PASP, 118, 297
Wolfe, A. M. , Turnshek, D. A., Smith, H. E., & Cohen, R. D. 1986, ApJS, 61, 249
Woosley, S. E., & Weaver, T. A. 1995, ApJS, 101, 181
York, D. G., Dopita, M., Green, R., & Bechtold, J. 1986, ApJ, 311, 610
York, D. G. et al. 2006, MNRAS, 367, 945

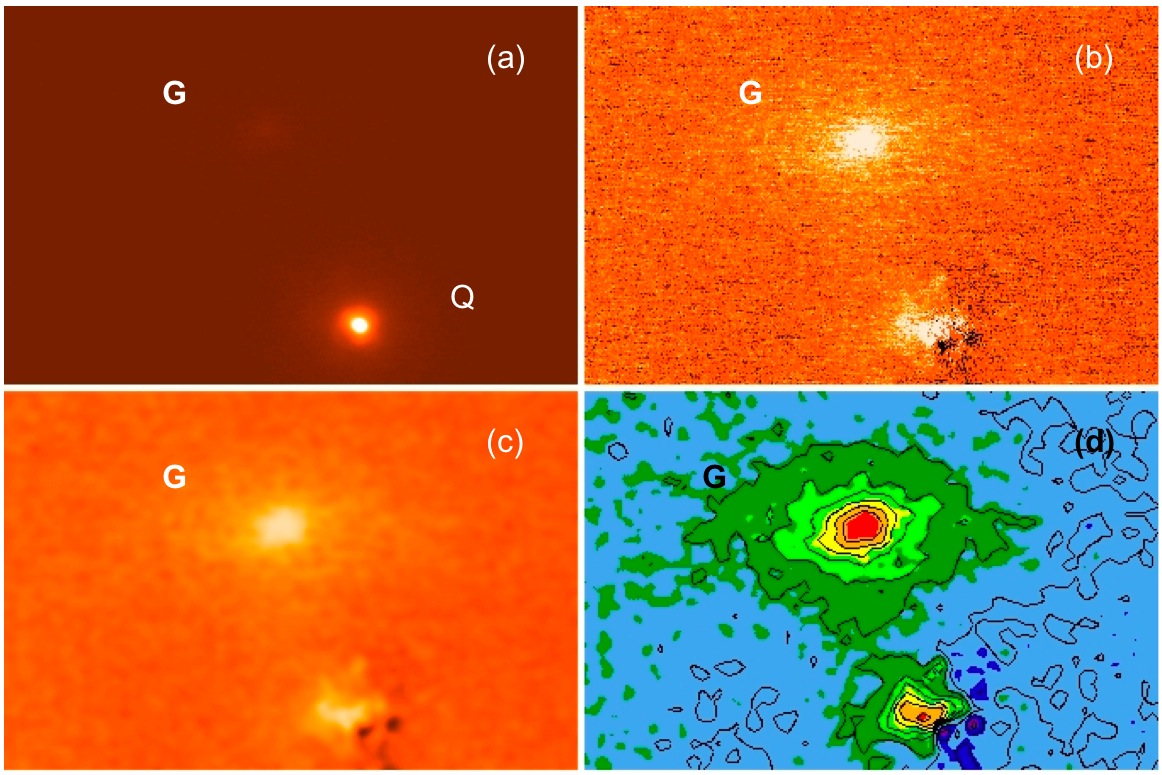
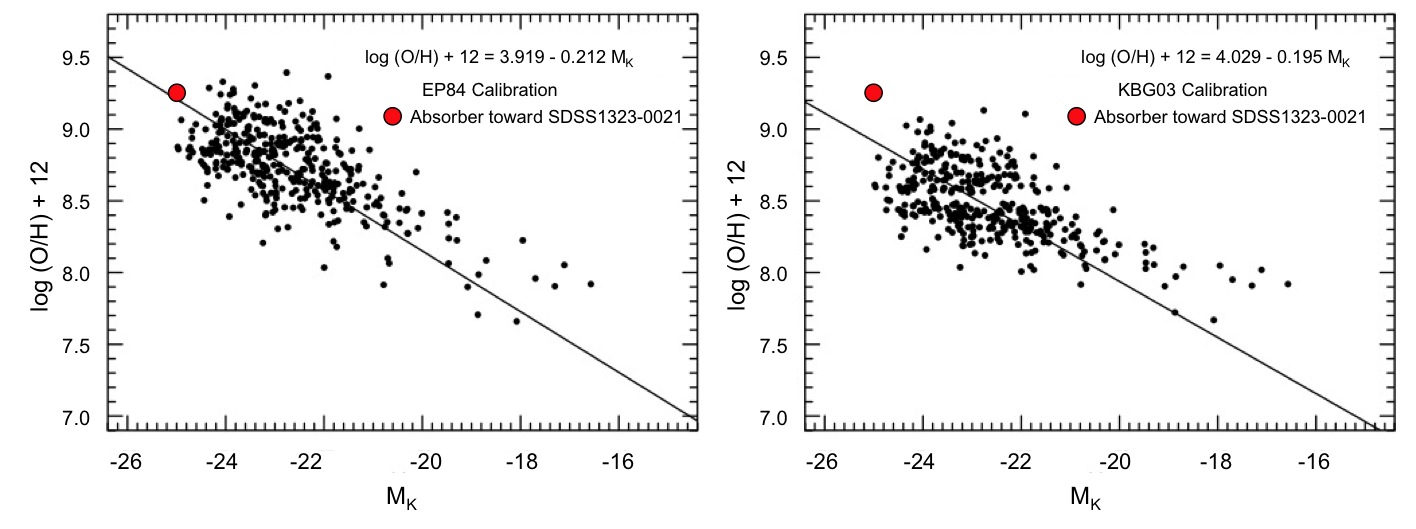
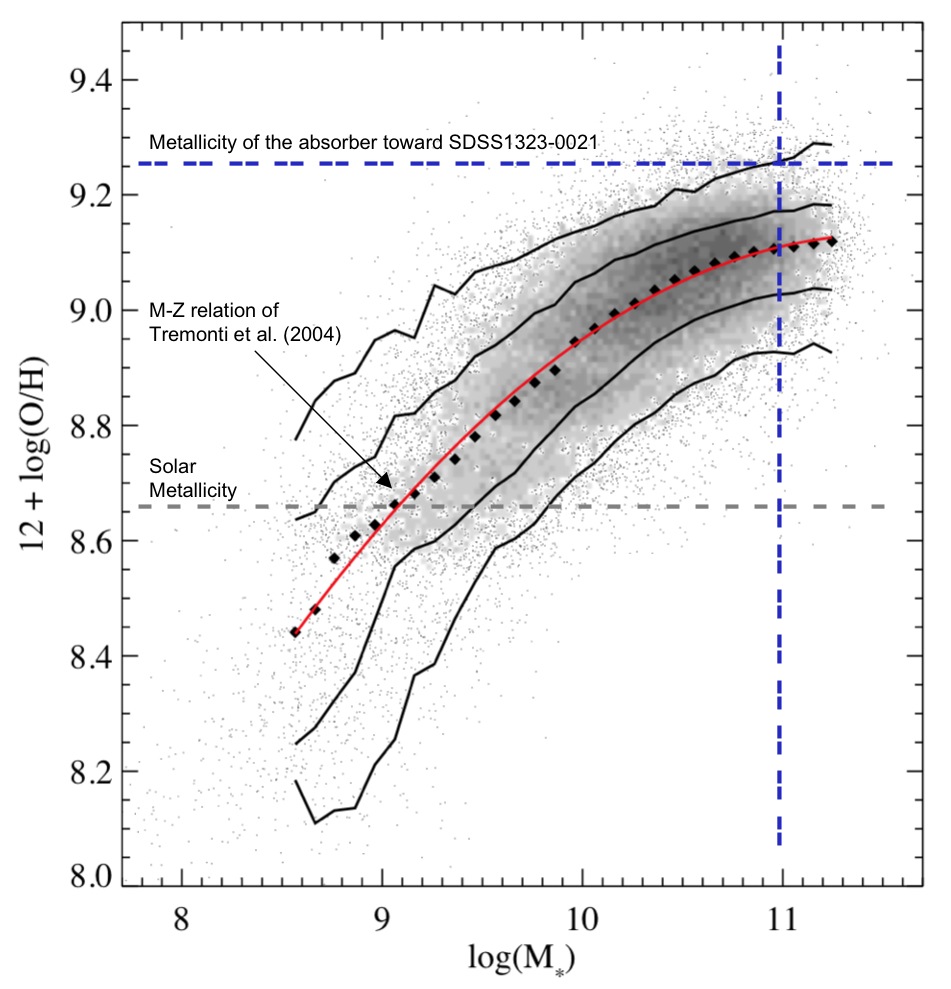
Table 1
Summary of Absorber and Galaxy Properties
| Absorber Redshift () | 0.716 |
|---|---|
| Absorber H I Column Density (log ) | 20.21 |
| Absorber Metallicity [Zn/H] | +0.61aaAdopted from Péroux et al. 2006a. |
| Galaxy-Quasar RA separation ( RA) | +0.52 ″ |
| Galaxy-Quasar Dec. separation ( Dec) | +1.14 ″ |
| Total Galaxy-Quasar Angular Separation () | 1.25 ″ |
| Impact Parameter (at ) | 9.0 kpc |
| Apparent Magnitude () | 17.6-17.9bbQuasar measured apparent brightness is . |
| Bulge-to-Total Ratio () | |
| Effective Radius () | 4.0 kpc |
| Absolute Magnitude () | -24.7 to -25.1 |
| Luminosity | 3.3-6.3 |
| Stellar Mass | |