X-rays from Saturn: A study with XMM-Newton and Chandra
over the years 2002-05
Abstract
Aims. We approach the study of Saturn and its environment in a novel way using X-ray data, by making a systematic and uniform spectral analysis of all the X-ray observations of the planet to date.
Methods. We present the results of the two most recent (2005) XMM-Newton observations of Saturn together with the re-analysis of an earlier (2002) observation from the XMM-Newton archive and of three Chandra observations in 2003 and 2004. While the XMM-Newton telescope resolution does not enable us to resolve spatially the contributions of the planet’s disk and rings to the X-ray flux, we can estimate their strengths and their evolution over the years from spectral analysis, and compare them with those observed with Chandra.
Results. The spectrum of the X-ray emission is well fitted by an optically thin coronal model with an average temperature of 0.5 keV. The addition of a fluorescent oxygen emission line at 0.53 keV improves the fits significantly. In accordance with earlier reports, we interpret the coronal component as emission from the planetary disk, produced by the scattering of solar X-rays in Saturn’s upper atmosphere, and the line as originating from the Saturnian rings. The strength of the disk X-ray emission is seen to decrease over the period 2002 – 2005, following the decay of solar activity towards the current minimum in the solar cycle. By comparing the relative fluxes of the disk X-ray emission and the oxygen line, we suggest that the line strength does not vary over the years in the same fashion as the disk flux. We consider possible alternatives for the origin of the line. The connection between solar activity and the strength of Saturn’s disk X-ray emission is investigated and compared with that of Jupiter. We also discuss the apparent lack of X-ray aurorae on Saturn; by comparing the planet’s parameters relevant to aurora production with those of Jupiter we conclude that Saturnian X-ray aurorae are likely to have gone undetected because they are below the sensitivity threshold of current Earth-bound observatories. A similar comparison for Uranus and Neptune leads to the same disappointing conclusion, which is likely to hold true also with the planned next generation International X-ray Observatory. The next step in advancing this research can only be realised with in-situ X-ray observations at the planets.
Key Words.:
Planets and satellites: individual: Saturn1 Introduction
In recent years X-ray observations have provided a novel way of furthering the study of planets in our solar system and our understanding of the physical processes taking place on them and in their environments (for a review see Bhardwaj et al. Bhardwaj_07 (2007) and references therein). For planets with a significant magnetic field, namely Jupiter and the Earth, the X-ray emission has been found to separate essentially into two components: a high-latitude auroral one, and a low-latitude disk component, which has different spectral properties, relating it to solar X-rays (Maurellis et al. Mau_00 (2000), Gladstone et al. Glad_02 (2002), Branduardi-Raymont et al. BR_04 (2004), Bhardwaj et al. 2005c , Elsner et al. El_05 (2005), Branduardi-Raymont et al. 2007a,b, Bhardwaj et al. Bhardwaj_07 (2007)). Naively we would expect to observe a similar dichotomy on Saturn, given the strength of its magnetic field and its fast rotation (as for Jupiter) and its powerful UV aurorae (Gérard et al. Gerard_04 (2004), Gérard et al. Gerard_05 (2005)), but this is not the case. While the characteristics of Jupiter’s UV aurorae are dictated by the rotation of plasma internal to its magnetosphere (Bhardwaj and Gladstone BG_00 (2000), Clarke et al. Clarke_04 (2004)), those of Earth are solar wind driven (Clarke et al. Clarke_05 (2005)); Saturn’s UV aurorae appear to be at variance with both these scenarios, rather than being intermediate between the two, as originally expected (Bhardwaj and Gladstone BG_00 (2000)). In Saturn’s case the UV aurora responds strongly to the solar wind dynamic pressure (Crary et al. Crary_05 (2005)), whose compression of the magnetosphere may induce reconnection leading to auroral brightenings (Cowley et al. Cowley_05 (2005)); compared to Earth, though, where aurora brightenings are very rapid ( tens of minutes), those on Saturn can last for days (Clarke et al. Clarke_05 (2005)). Moreover, UV auroral activity has also been observed on Saturn during a period (Oct. - Nov. 2005) of quiet solar wind conditions, suggesting an intrinsically dynamic magnetosphere with injections of plasma occasionally taking place in the night or dawn sectors (Gérard et al. Gerard_06 (2006)). Recent work by Clarke et al. (Clarke_09 (2009)) has added to this picture: from an extensive campaign of observations by the Hubble Space Telescope (HST), coupled with planetary spacecraft and solar wind data, they find evidence for a direct relationship between Saturn’s auroral activity and solar wind conditions, while the correlation is not so strong at Jupiter.
| Observation | Observation | Apparent | Heliocentric | Geocentric | ||
|---|---|---|---|---|---|---|
| Satellite | mid-epoch | duration | diameter | distance | distance | References |
| (ks) | (AU) | (AU) | ||||
| XMM-Newton (1) | 2002 Oct. 01, 14:00 UT | 21 | 18.8” | 9.0 | 8.8 | Ness et al. 2004a , this paper |
| Chandra (1) | 2003 Apr. 14, 18:00 UT | 66 | 17.5” | 9.0 | 9.5 | Ness et al. 2004b |
| Chandra (2) | 2004 Jan. 20, 05:30 UT | 37 | 20.5” | 9.0 | 8.1 | Bhardwaj et al. 2005a , 2005b , |
| this paper | ||||||
| Chandra (3) | 2004 Jan. 26, 20:00 UT | 36 | 20.4” | 9.0 | 8.2 | Bhardwaj et al. 2005a , 2005b |
| XMM-Newton (2) | 2005 Apr. 22, 10:00 UT | 84 | 18.1” | 9.1 | 9.2 | This paper |
| XMM-Newton (3) | 2005 Oct. 28, 21:00 UT | 74 | 18.2” | 9.1 | 9.1 | This paper |
Early observations of Saturn with XMM-Newton and Chandra (Ness et al. 2004a , Ness et al. 2004b ) unambiguously detected X-ray emission, found it to be concentrated in the equatorial regions of the planet, and indicated that any X-ray auroral component, if present at all, is not easily detectable. More recent Chandra observations have provided us with a remarkable view of the X-ray morphology of the Saturnian system, and of its temporal behaviour in the X-rays: both the planet’s disk and the rings have been separately detected, and strong variability, closely following the behaviour of the solar X-ray flux, has been discovered in the disk X-ray emission (Bhardwaj et al. 2005a , Bhardwaj et al. 2005b ). This suggests that its origin may lie in the scattering of solar X-rays in the upper layers of Saturn’s atmosphere, as is the case for Jupiter’s disk emission (Bhardwaj et al. 2005c , Bhardwaj et al. Betal_06 (2006), Cravens et al. Cravens_06 (2006)). Unlike Jupiter, though, no difference is found in the spectral characteristics of Saturn’s disk and polar emissions, thus no evidence for X-rays of auroral origin is provided by the Chandra data. In fact, Bhardwaj et al. (2005a ) remark that the X-ray emission from the polar regions appears to be anticorrelated with the strength of the FUV aurora, measured by the HST Imaging Spectrograph simultaneously with the Chandra observations. Moreover, only relatively little detail has been published so far about Saturn’s X-ray spectral characteristics: an optically thin, coronal model is a good match for the disk emission (Ness et al. 2004a , Ness et al. 2004b , Bhardwaj Bhardwaj_06 (2006)), while the rings spectrum is practically made up of a single O K emission line, which has been attributed largely to scattering of solar X-rays on the icy water ring material (Bhardwaj et al. 2005b ). However, solar fluorescence alone could not explain the ring X-ray brightness completely. To follow up on these issues, we made more extensive XMM-Newton observations of Saturn in 2005: this was a particularly appropriate time to take a deeper look at the planet, while a campaign of HST observations was taking place, and the Cassini spacecraft (which entered orbit around Saturn in July 2004) was making coordinated in-situ measurements of a variety of physical parameters in its environment.
In this paper we report the results from our 2005 observations, together with a re-analysis of the earlier (2002) data extracted from the XMM-Newton archive (sec.s 2 and 3). We also model the Chandra X-ray spectra from the 2003 and 2004 observations (which have already been described by Ness et al. 2004b , Bhardwaj et al. 2005a and Bhardwaj et al. 2005b see sec. 3). We discuss our findings in sec. 4, also making comparisons with Jupiter and Earth, as well as Uranus and Neptune, and draw our conclusions in sec. 5.
2 XMM-Newton observations of Saturn
In Table 1 we list in time order all the X-ray observations of Saturn which have been carried out so far with XMM-Newton and Chandra, identifying them by sequential numbers; those with Chandra were all performed with the Advanced CCD Imaging Spectrometer (ACIS), so that spectral information was available. Table 1 includes the mid-epochs and durations of the observations, as well as the apparent size of the planet’s disk, its distance from the Sun and the Earth at those times, and relevant references. During our 2005 XMM-Newton observations the CCD European Photon Imaging Cameras (EPIC-pn, Strüder et al. struder (2001), EPIC-MOS, Turner et al. turner (2001)) were operated in Full Frame mode with the thick filter at all times, to avoid any optical leak contamination (see Ness et al. 2004a for a discussion of the optical light leak affecting thin and medium filters). In 2002 only one exposure (with the EPIC-pn camera) was carried out with the thick filter, so the analysis had to be restricted to it for this epoch. In order to make a direct and consistent comparison of all XMM-Newton data, the analysis of the 2005 observations reported here is also limited to the EPIC-pn camera. We note, though, that the best fit of the combined EPIC-pn and MOS datasets for 2005 is consistent, within the parameters errors, with that obtained using the EPIC-pn camera on its own. During all XMM-Newton observations the Reflection Grating Spectrometer (RGS, den Herder et al. denHerder (2001)) was run in Spectroscopy mode, but the source brightness is too low to enable high resolution spectroscopy to be carried out. The Optical Monitor telescope (Mason et al. Mason (2001)) had its filter wheel kept in the BLOCKED position, because Saturn’s optical brightness exceeds the safe limit for the instrument (thus no OM data were collected).
At all 2002 and 2005 observing epochs Saturns’s path on the sky was essentially in RA, and very slow (8”/hr max). Each one of the longer, 2005 observations was broken into two intervals, with a small pointing trim in between, to ensure the planet would be imaged on the same CCD chip at all times. The two intervals were combined during the data processing and the subsequent analysis.


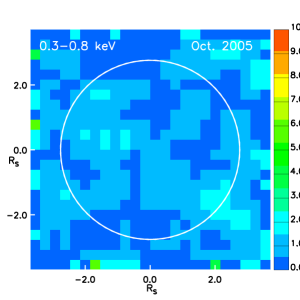
The two XMM-Newton 2005 observations, as well as the archival one from 2002, were processed and analysed in a uniform fashion under SAS (Science Analysis Software) v. 7.1; the 2002 observation (Ness et al. 2004a ) had never been processed in this now standard way, because of the lack, at the time, of dedicated software to re-register the XMM-Newton events in the rest frame of a moving target. After this was done for the three Saturn datasets, images at the location of the planet were constructed with the data from the EPIC cameras. Fig. 1 shows the EPIC-pn images of Saturn in the energy range 0.3 – 0.8 keV for the XMM-Newton observations 1 (top of the colour panels), 2 (middle) and 3 (bottom; the planet is undetected on this occasion). Overposed to each image, at the nominal location of the planet’s centre, is a white circle of 26” radius. At the top of Fig. 1 is a diagram showing the appearence of Saturn and its rings in Oct. 2002 (the view, with the South Pole unobstructed, was very similar in Apr. and Oct. 2005).
From visual comparison of the three panels in Fig. 1 it is clear that the planet was X-ray brightest in 2002, dimmer in Apr. 2005 and weakest, in fact undetected, in Oct. 2005 (see sec. 3 and Table 2 for X-ray upper limits at this epoch).
Despite the relatively broad XMM-Newton Point Spread Function (PSF, of 15” Half Energy Width) compared with the planet’s image size (20” diameter), the morphology of the X-ray emission at both 2002 and Apr. 2005 epochs does not appear circularly symmetric, but is seen to stretch along the direction of the rings plane. In the following we will analyse the XMM-Newton data as encompassing both, disk and ring emissions.
We also searched for evidence of X-ray emission from Saturn’s satellite Titan in the XMM-Newton datasets, but none was found. Similarly no detection was obtained with the Chandra observations.
3 Spectral fitting: XMM-Newton EPIC and Chandra ACIS data
In principle Saturn occults the cosmic X-ray background originating beyond it, so we could expect that background subtraction may not be required in the analysis of its spectra; however, the contribution of particle background (dominant at higher energies), and any ‘spill over’ of the cosmic X-ray background onto the planet’s disk due to the width of XMM-Newton PSF may become significant if we use a region to extract the X-ray events for the planet which is large compared with the size of its disk. This is our case, where we are using an extraction circle of 26” radius, in order to include as much as possible of the X-ray flux from the source (Saturn’s disk diameter 20”). For an XMM-Newton point source (which, for this purpose, Saturn can be approximated to), an extraction radius of 26” corresponds to an encircled energy of 80%, so all fluxes quoted in the following for the planet are corrected for this factor. Fig. 2 shows a comparison of Saturn’s 2002 and Apr. 2005 EPIC-pn spectra (black crosses) extracted from the regions delimited by white circles in Fig. 1, with those (red crosses) from background regions (devoid of sources) of the same shape and size, from the same EPIC-pn CCD. The plots indicate that the emission from the planet lies above the background in the band 0.3 – 2 keV, and that it practically disappears under it at higher energies. The XMM-Newton spectral fitting results presented below refer to the Oct. 2002 and Apr. 2005 observations (the planet was undetected in Oct. 2005).
In the case of the Chandra data, unlike the analysis carried out by Bhardwaj et al. (2005a,b), we extracted the full planet data, i.e. the combined emission from the disk, the polar cap and the rings, for the purpose of comparing with XMM-Newton which cannot resolve these morphological details. As already pointed out by Bhardwaj et al. (2005a ), the spectrum of Saturn’s polar region is very similar to that of the planet’s disk. Here we present results from the fits made to the Apr. 2003, the 20 and the 26 Jan. 2004 Chandra data. The 2003 observation was made up of two exposures: we show the best fits for the two datasets combined, since individually they give very similar results. The source was weaker by a factor of three on 26 Jan. 2004 than a week earlier (Bhardwaj et al. 2005a ), when Saturn brightened in the X-rays in direct response to a powerful X-ray flare taking place on the solar hemisphere visible from the planet.


Before fitting, the spectra were binned so as to include at least 15 counts per energy channel (10 counts for the low-flux Chandra observation of 26 Jan. 2004), to validate the applicability of testing for parameter estimation (Cash cash (1979)). We used XSPEC v. 12.4.0 for the fitting and modeled the spectra with an optically thin mekal component (to represent the scattered solar X-ray contribution) and a Gaussian line at 0.53 keV to take into account the O K line emission from the rings. The mekal temperature and normalisation, and the energy and normalisation of the emission line were left free to vary in the fit. Elemental abundances for the coronal model were set at the solar level; the width of the emission line was kept fixed, and taken to be due only to instrumental broadening. This model combination provides good fits to the EPIC-pn spectra from the XMM-Newton observations in 2002 and Apr. 2005, and also to the Chandra ACIS spectra for Saturn and its rings combined, from the 2003 and 2004 observations. Fig. 3 shows the data (black crosses) and the best fits (red histograms) for all the XMM-Newton and Chandra datasets in time sequence (from top to bottom).


Table 2 lists the total numbers of source counts in the spectra, the best fit parameters and their 90% confidence errors, as well as energy fluxes for the two spectral components separately, for all the spectra from the two observatories. The fluxes were obtained from the best fit models by setting to zero the normalisation of one or the other of the components and have been converted to emitted powers (also listed in Table 2) by multiplying by 4d2, where d is the geocentric distance of Saturn at each epoch.
We have checked whether the presence of the oxygen emission line in the spectra is statistically significant by setting its normalisation to 0 and re-fitting the spectra. The resulting best fit values are listed in the last column of Table 2 and demonstrate that ignoring the presence of the line worsens the fits significantly.
Both Apr. 2003 and Apr. 2005 spectra in Fig. 3 show one bin deviating in excess of the best fit at 0.75 keV (16.5 Å); in both cases this feature can be accounted for by a narrow emission line at the instrumental resolution. Interestingly, Fe XVII lines at 15 and 17 Å are characteristic of the solar coronal spectrum; however, the statistical quality of the data (and in particular the hard-to-constrain strength of the line) does not warrant exploring this further.
The XMM-Newton (3) observation (Oct. 2005) shows no evidence of X-ray emission from the planet (see bottom panel of Fig. 1), and we extract a 3 upper limit of 44 counts in the EPIC-pn camera over the full duration (74 ks) of the dataset. Adopting the spectral parameters that best fit the Apr. 2005 XMM-Newton (2) EPIC-pn observation, assuming the same relative strengths for the disk and line emissions, and normalising to the shorter exposure and the slightly smaller geocentric distance, we obtain an upper limit of 19 MW to the disk emitted power in Oct. 2005, down by more than a factor of 10 from the level observed three years earlier during the XMM-Newton (1) observation (Table 2).
4 Discussion
4.1 Separating Saturn’s disk and rings X-ray emission
Our spectral fitting of Saturn’s XMM-Newton and Chandra data, gathered over the period Oct. 2002 Oct. 2005, shows that the X-ray emission is well described by a combination of two components, an optically thin coronal model (mekal) and an O K emission line; in accordance with the earlier results of Ness et al. (2004a,b) and Bhardwaj et al. (2005a ), we interpret the mekal component in Saturn’s X-ray spectrum as representing its disk emission, which varies over the years 2002 – 2005 according to the diminishing strength of the solar X-ray output. The average temperature of the coronal emission is 0.5 keV, which is similar to that measured (0.4 0.5 keV) on three occasions in 2003 for Jupiter’s disk X-rays (Branduardi-Raymont et al. 2007a ); this strengthens the idea that in both cases the emission originates from the scattering of solar X-rays in the planets’ upper atmospheres (cf. Bhardwaj et al. 2005a,c, Bhardwaj 2006, Cravens et al. Cravens_06 (2006)).
The presence of an additional spectral component, in the form of an oxygen emission line, had already been suggested by the early fits of the 2002 and 2003 XMM-Newton and Chandra data by Ness et al. (2004a,b); this line was later associated with the planet’s rings by Bhardwaj et al. (2005b ) using the Chandra data, by spatially selecting only events coincident with the Saturnian rings. We have taken the different approach of attempting to separate spectrally the two emission components through a uniform analysis of the spectra of the whole planet + rings system from both observatories. This solves the problem of the spatial resolution of XMM-Newton being too limited to allow us to separate spatially the planet’s disk from the rings; then we can study the variability of both emission components over the solar cycle by examining XMM-Newton and Chandra spectral fitting results, under the assumption that all the line emission originates in the rings.

As a consistency check, we have compared the parameters of our best fits and the values of emitted power derived from them (Table 2) with those previously published for the 2002 XMM-Newton observation and the 2003 and 2004 Chandra datasets. In the first case, Ness et al. (2004a ) use the apec model in XSPEC to describe the scattered solar spectrum, and combine it with a narrow oxygen line: their best fit temperature of 0.33 keV is consistent with our value of 0.28 keV (for a mekal model) within the errors; they derive apec and line fluxes of 1.36 and 0.22 10-14 erg cm-2 s-1 respectively, which are 30% and 10% higher than our mekal and line fluxes respectively, but again consistent within the spectral parameters errors. For the Chandra 2003 observation, Ness et al. (2004b ) fit only the emission from the circular region coinciding with the planet’s disk (30% of which is occulted by the rings), deriving a best fit mekal temperature of 0.39 keV, with a 0.1 2 keV flux of 0.6 10-14 erg cm-2 s-1, and a line flux of 0.13 10-14 erg cm-2 s-1. In this case our results are somewhat different (see Table 2) because we include the full rings emission in the fit (thus our oxygen line is stronger). We can make a more direct comparison with the results obtained by Bhardwaj et al. (2005b ) on the rings line emission observed by Chandra. These authors quote a line flux of 0.5 10-14 erg cm-2 s-1 for the 20 Jan. 2004 observation which is in very good agreement with our value (0.48 10-14 erg cm-2 s-1). Note that their flux is derived by fitting the rings spectrum on its own in XSPEC, while here we obtain the rings flux by extracting and modelling the combined disk and rings spectrum (in order to compare with the un-separated spectra from XMM-Newton). The consistency of the two results gives confidence in our approach. However, the line powers which we derive from the 2003 and 26 Jan. 2004 Chandra data are factors of 2 and 1.7 above what Bhardwaj et al. (2005b ) quote respectively. A possible explanation of the discrepancy may be the presence of oxygen line emission from the rings area occulting the disk, which was excluded by Bhardwaj et al. but is included in our analysis. In fact, Ness et al. (2004b ) find that the inclusion of a small amount of line emission does improve their fit of the Chandra 2003 full disk region (including the part covered by the rings). If this is the case, the additional line contribution from this rings area may become more relevant when the disk flux is lower, as indeed can be seen in the Chandra observations (1) and (3) (Fig. 3).
Turning to the power emitted by the disk, inspection of Bhardwaj et al. (2005a ) Fig. 4 indicates 0.2 2.0 keV powers of 380, 170, 250 and 90 MW in 2002, 2003 and on 20 and 26 Jan. 2004 respectively; these are a factor between 1.5 and 2.4 larger than those we derive and list in Table 2. The different analysis approach may be responsible for this discrepancy. However, since we are interested in studying trends over time, our uniform approach to the whole dataset ought to give more comparable results.
| Year | Satellite | Source | mekal | mekal | mekal | mekal | Gauss | Gauss | Gauss | Gauss | GOES-10 | ||
|---|---|---|---|---|---|---|---|---|---|---|---|---|---|
| of | (observation | net | kTa | normb | fluxc | 0.2 2.0 keV emitted | energy | norme | fluxf | emitted | /d.o.f.g | /d.o.f.g | 1 – 8 Å |
| obs. | number) | counts | powerd (MW) | (keV) | powerd (MW) | no line | fluxi | ||||||
| 2002 | XMM-Newton (1) | 112 | 0.28 | 4.3 | 1.04 | 230 | 0.48 | 2.6 | 0.20 | 44 | 0.9/5 | 7.0/7 | 1.13 |
| 2003 | Chandra (1) | 137 | 0.650.19 | 1.30.4 | 0.37 | 94 | 0.55 | 5.91.5 | 0.530.13 | 13534 | 8.6/9 | 32.6/11 | 2.12 |
| 2004 | Chandra (2) | 112 | 0.59 | 3.1 | 0.90 | 167 | 0.570.03 | 4.9 | 0.44 | 82 | 12.2/10 | 16.7/12 | 3.23 |
| 2004 | Chandra (3) | 42 | 0.61 | 0.7 | 0.19 | 36 | 0.56 | 4.3 | 0.39 | 74 | 0.22/1 | 5.2/3 | 0.16 |
| 2005 | XMM-Newton (2) | 146 | 0.33 | 1.10.4 | 0.27 | 65 | 0.520.02 | 1.70.7 | 0.150.06 | 3615 | 17.4/16 | 33.3/18 | 0.22 |
| 2005 | XMM-Newton (3) | 44h | 0.33 | 0.3h | 0.08h | 19h | 0.52 | 0.51h | 0.05h | 12h | 0.004 |
-
a
mekal temperature in keV
-
b
mekal normalisation at 1 keV in units of 10-6 ph cm-2 s-1 keV-1
-
c
Total 0.2 – 2.0 keV energy flux in the mekal component in units of 10-14 erg cm-2 s-1; the errors on the fluxes were obtained by varying the mekal temperatures and normalisations between their 90% confidence limits
-
d
Powers and errors calculated by multiplying the values in the previous column by 4d2, where d is the geocentric distance of Saturn at the given epoch.
-
e
Gaussian line normalisation in units of 10-6 ph cm-2 s-1
-
f
Total energy flux in the line in units of 10-14 erg cm-2 s-1
-
g
value and degrees of freedom
-
h
3 upper limit
-
i
Solar X-ray flux (1.5 – 12.4 keV) in units of 10-6 Watt m-2, corrected for solar rotation (see text)
| Planet | Average solar | Rotation | Equatorial | Surface | Magnetic | FUV aurora | X-ray aurora | Disk X-ray | Magnetospheric |
|---|---|---|---|---|---|---|---|---|---|
| distance | period | radius | magnetic field | moment | average input | total average | average | ions max. | |
| (AU)a | (hrs)a | (Earth = 1)a,b | (G)a | (Earth = 1)a | power (GW)c | power (MW)d | power (MW) | density (cm-3)a | |
| Earth | 1.0 | 23.9 | 1 | 0.31 | 1 | 1 100 | 10 30 | 40d | 1 4000 |
| Jupiter | 5.2 | 9.9 | 11.2 | 4.28 | 20,000 | few 104 | 400 1000 | 500 2000d | 3000 |
| Saturn | 9.6 | 10.7 | 9.4 | 0.22 | 600 | 102 103 | ? | 230e | 100 ? |
| Uranus | 19.2 | 17.2 | 4.0 | 0.23 | 50 | 40f | ? | ? | 3 |
| Neptune | 30.1 | 16.1 | 3.9 | 0.14 | 25 | 0.1f | ? | ? | 2 |
-
a
From The New Solar System, Ed.s J. K. Beatty, C. Collins Petersen & A. Chaikin, 1999, Cambridge University Press
-
b
For the outer planets, radius at 1 bar atmospheric pressure
-
c
Clarke et al. (Clarke_05 (2005))
-
d
Bhardwaj et al. (Bhardwaj_07 (2007))
-
e
This paper
-
f
Bhardwaj and Gladstone (BG_00 (2000))
Then we can use the whole sequence of XMM-Newton and Chandra observations to study how the fluxes in the two X-ray spectral components, the emission from the planet’s disk and the oxygen line (assumed to be confined to the rings), varied relative to each other over a period of three years. From Fig. 3 it is already clear that the line is more prominent when the disk flux is lower (Apr. 2003, 26 Jan. 2004 and Apr. 2005) and is less visible when the disk is brighter (Oct. 2002 and 20 Jan. 2004). This suggests that the two components vary over time in different ways: Fig. 4 shows the power emitted in the oxygen line plotted against that from the disk (from Table 2). The trend of the disk emission to decrease with time (mirroring the decay of the solar X-ray output as the solar cycle progresses towards a minimum), originally identified by Bhardwaj et al. (2005a ), is apparent from the temporal sequence of the data in Fig. 4. However, despite the large errors, it is clear that there is no similar trend in the oxygen line; although both disk and line powers change by factors of 6 and 4 respectively over the three years of observations, their variability appears to be un-correlated: in particular, the line strength is consistent with being the same in 2002 and Apr. 2005, while the disk has dimmed by a factor of 3.5. In addition, as reported by Bhardwaj et al. (2005b ), the response of the disk to the solar flare on 20 Jan. 2004 is not clearly matched by a similar increase in the rings line power. Both disk and rings have disappeared by Oct. 2005, which may argue for some correlation between the two; however, it is not clear that the line, if present but weak, would produce enough counts to be detectable on its own.
4.2 The solar connection
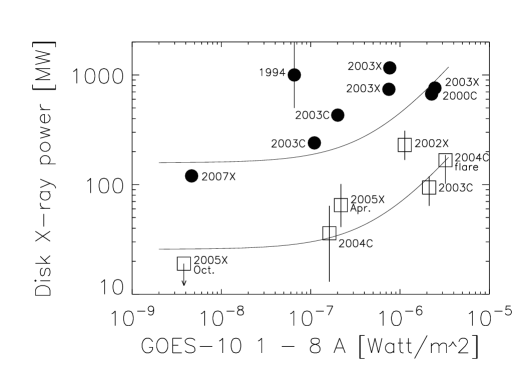
Fig. 5 shows Saturn’s disk 0.2 – 2.0 keV X-ray power from Table 2 (open squares) plotted against the solar 1 8 (1.5 12.4 keV) flux (also listed in Table 2) measured by the GOES-10 satellite at each observing epoch and averaged over the duration of the observations. These fluxes have been corrected for the Sun’s rotation except in the cases (Jan. 2004) when the Earth and Saturn were practically in opposition. We have neglected the travel time differences Sun-Earth and Sun-Saturn-Earth because these are very small with respect to the correction for solar rotation (and cancel out in opposition). As expected, there appears to be correlation between Saturn’s disk X-ray power and the solar X-ray flux. For comparison, the same parameters are also plotted for Jupiter’s disk (filled circles), which also has been shown to act as a mirror of solar X-rays (Maurellis et al. Mau_00 (2000), Bhardwaj et al. 2005c , Cravens et al. Cravens_06 (2006)). XMM-Newton and Chandra observations in Fig. 5 are identified by an X and a C, respectively.
For completeness here is a brief summary of Jupiter’s measurements used in Fig. 5. Waite et al. (Waite_97 (1997)) were the first to report an X-ray measurement for the low latitude regions of the planet from their ROSAT High Resolution Imager observation in July 1994. Chandra observed Jupiter with the High Resolution Camera (HRC) in Dec. 2000, with both the HRC and ACIS in Feb. 2003 and with ACIS in Feb. – March 2007; this last time the observations were simultaneous with XMM-Newton, which had looked at the planet also in April and Nov. 2003. Bhardwaj et al. (Betal_06 (2006)) report 0.5 – 1.5 keV fluxes for the two 2003 ACIS observations, which we have converted to 0.2 – 2.0 keV using their mekal best fit parameters. They also mention that the HRC flux was about 50% of that in Dec. 2000, so we have attributed twice the mean power measured by ACIS in 2003 to the Dec. 2000 epoch (when Gladstone et al. Glad_02 (2002) only had HRC data, without spectral information with which to characterise the spectrum properly). Emitted powers for the XMM-Newton observations of Jupiter in 2003 are reported in Branduardi-Raymont et al. (2007a ), but were computed using a factor of 2 between flux and power, so we doubled them to be comparable with the rest of the measurements. The 2007 XMM-Newton observations, which will be the subject of a future publication (Branduardi-Raymont et al., in preparation), took place at the time of the New Horizon Jupiter fly-by, and were contemporaneous with some by Chandra; at this epoch, close to solar minimum, the disk X-ray power had dimmed considerably (120 MW). The errors associated with the 2003 XMM-Newton mekal model normalisations are of the order of 10% (Branduardi-Raymont et al. 2007a ), so we attributed the same fractional error to the corresponding emitted powers, and to the Chandra measurements for which no errors are quoted. All these errors are contained within the size of the plotting symbols. Larger errors (100%,50%) apply to the 1994 ROSAT power (Waite et al. Waite_97 (1997)). The linear correlation coefficients are 0.60 and 0.31 for the Saturn and Jupiter datasets, respectively. The correlation in Jupiter’s case becomes stronger if we exclude the 1994 and 2000 measurements, for which we do not have spectral information (the coefficient increases to 0.54). Plotted in Fig. 5 are also lines derived from a linear square fit to each dataset, which reinforce the view of the flux trends. The correlation between Saturn’s and Jupiter’s disk X-ray powers and the GOES 0.5 – 3 Å (4 – 25 keV) flux is much weaker (coefficients of 0.39 and 0.18 respectively). This is not surprising, since the band covers higher energies than those at which the 0.5 keV solar spectrum, scattered by the planet’s atmosphere, peaks.
4.3 The origin of the rings X-ray emission
Our analysis of the complete set of Saturn’s X-ray spectra over the three year period from Oct. 2002 to Oct. 2005 suggests that the strength of the oxygen emission line from its rings does not vary in the same way as the disk emission does, following solar activity. This would be at variance with the interpretation of the origin of the rings emission as fluorescent scattering of solar X-rays from the icy rings material (Bhardwaj et al. 2005b ). However, only about one third of the ring X-ray emission could be explained in this way by Bhardwaj et al. (2005b ). While the fluorescence interpretation is attractive because is underpinned by the same mechanism which leads to the disk X-ray emission, and our spectral separation technique cannot prove that the line emission is truly all confined to the rings, nevertheless it is interesting to explore a possible alternative to the solar scattering interpretation.
Chandra imaging in both 2003 and 2004 appears to indicate that the X-ray emission concentrates on the East ansa (morning side) of the rings, where also spokes occur; indeed Bhardwaj et al. (2005b ) suggest that the higher X-ray brightness could be due to enhanced fluorescence on the ice-dust particles that are thought to make up the spokes, and to be created by meteoritic impacts, which are more likely in the early morning hours. On the other hand, Cassini measurements have shown the spokes to be related to electrons injection (Coates et al. 2005). Recently it has also been suggested that lightning-induced electron beams (following cosmic rays impacts) may produce the spokes (Jones et al. Jones_06 (2006)). Such electron beams may also energise the icy particles in the rings, which could then fluoresce and cause the oxygen line emission. Thus, if the X-ray line is related in this way to thunderstorms that are characteristically ’seasonal’, since seasons last a long time on Saturn (30 year sidereal period), one could expect the line strength to be more or less constant over the three year period for which we have observations.
On the other hand, recent modeling work by Tseng et al. (Tseng_09 (2009)) suggests that the oxygen atmosphere of the rings is strongly dependent on Saturn’s position in its orbit, and a much larger density is expected in the Southern rather than in the Northern hemisphere. Thus it should not come as a surprise that the oxygen X-ray emission from the rings may vary over different timescales from those of the disk emission, which is controlled by solar activity. Future observations may also be able to show whether the brightness of the oxygen X-ray emission changes after the equinox (11 August 2009).
4.4 Are there X-ray aurorae on Saturn? and on Uranus and Neptune?
Unlike for Jupiter (Branduardi-Raymont et al. 2007b ), there is no evidence of auroral X-ray emission in the Saturn data obtained so far. The X-ray spectrum of the Jovian aurorae is made up of two components: the softer one is generally assumed to be produced by energetic heavy ions precipitating in the planet’s atmosphere and radiating line emission following charge exchange with atmospheric particles; the other, becoming dominant above 2 keV, is due to energetic electrons also precipitating through the atmosphere and radiating bremsstrahlung. Recently, a morphological study of the spatial distribution of this high energy emission in Jupiter’s Northern polar region has shown it to be co-located with the main FUV auroral oval and bright FUV regions (Branduardi-Raymont et al. BR_08 (2008)). This, and the relative emission powers in the FUV and hard X-rays, support the view that on Jupiter these two emissions are produced by the same population of energetic electrons precipitating through the atmosphere. Given the bright and variable FUV aurorae observed on Saturn, one would expect some correlation with the X-ray emission to be present.
On the basis of model calculations by Singhal et al. (Sing_92 (1992)) and Waite et al. (Waite_92 (1992)), Branduardi-Raymont et al. (BR_08 (2008)) deduce that the power in the FUV emission is expected to be some 105 to 106 times that in hard X-rays if the same electrons are producing both and conclude that the observed emissions from Jupiter’s aurorae (i.e. 45 MW in hard X-rays and 340 GW in FUV) are broadly consistent with these ratios. We can make similar considerations for Saturn, which also possesses a dense atmosphere, like Jupiter’s: restricting the analysis to the more sensitive XMM-Newton observations, we extract 3 upper limits in the band 2.0 8.0 keV of 16, 35 and 37 counts for datasets (1), (2) and (3), respectively. Adopting a bremsstrahlung temperature of 10 keV (lower than the 90 keV best fitting the Jupiter spectra of Branduardi-Raymont et al. 2007b , since the precipitating electrons are generally of lower energy on Saturn than on Jupiter, Gustin et al. Gustin_09 (2009), Gérard et al Gerard_09 (2009)), and using the EPIC-pn response matrices to determine the conversion factor from countrate to energy flux, we find corresponding 3 upper limits to the emitted 2.0 8.0 keV power of 147, 94 and 107 MW. The XMM-Newton (3) observation (28 Oct. 2005, 06:34 to 29 Oct. 2005, 11:32 UT) was contemporaneus with three exposures of the Saturnian aurora taken with the HST Advanced Camera for Surveys, during a coordinated campaign with in-situ measurements by the Cassini spacecraft. This was a time of quiet solar wind conditions, and yet the UV aurora was seen to be very variable; the measured UV power at the time of the XMM-Newton observation varied between 3.3 and 8.0 GW (Gérard et al. Gerard_06 (2006)). If we apply to Saturn the ratios of 105 to 106 between hard X-ray and FUV powers calculated for Jupiter, it is clear that any electron bremsstrahlung emission would have been some 3 to 4 orders of magnitude fainter than our current XMM-Newton upper limits.
To make a further comparison of the most magnetised planets in the solar system, in Table 3 we summarise parameters that can be expected to be relevant to the auroral characteristics for all the outer planets, as well as Earth. With respect to Jupiter, Saturn is down by a factor of 20 and 30 in surface magnetic field and magnetic moment respectively. A similar ratio applies to the maximum average FUV aurora input power. Moreover, other parameters are likely to matter in the aurora production, such as the magnetospheric particle density: this is significantly higher, by at least another factor of 30, around Jupiter (being fed by Io’s volcanoes) than Saturn (where it is sustained by the rings and the icy moons). Thus, if Saturn’s total auroral X-ray power (including both soft X-rays of ionic origin and the higher energy electron bremsstrahlung) is lower than that of Jupiter by the combination of the magnetic field and particle density factors (around three orders of magnitude), it may measure only a few MW; this is equivalent to an X-ray flux at Earth of a few 10-17 erg cm-2 s-1, so it is no surprise that it is going undetected with current instrumentation. In fact, Saturn’s aurora may be at the limit of detectability even with the next generation most powerful International X-ray Observatory (IXO), being planned by ESA, NASA and JAXA, which is expected to have a sensitivity limit of 10-17 erg cm-2 s-1.
One may argue that our scaling approach is rather simplistic, but there are other examples in the planetary context where it seems to be applicable. Radio events reported by Louarn et al. (Lou_07 (2007)) at both Jupiter and Saturn suggest that plasma transport in the magnetosphere and the associated release of rotational energy may operate in a similar way at the two planets, but scale according to different timescales for internal processes. This is also in line with the conclusions of Stallard et al. (2008) that the differences in auroral emissions between the two giant outer planets are determined by scaling differences in their physical conditions and environments, while the processes leading to aurora formation are essentially the same (e.g. breakdown of co-rotation). There are terrestrial analogues to the scaling idea as well: solar wind disturbances at Earth are larger in amplitude and faster (order of minutes) than at Jupiter and Saturn (timescales of hours) because of the smaller magnetosphere and the lack of steady supply of plasma (Clarke et al. Clarke_09 (2009) and references therein).
Assuming that the same considerations are valid for Uranus and Neptune, and scaling on their dipole magnetic moments, which are down by a factor of 400 and 800 from Jupiter respectively, we would expect FUV auroral strengths of the order of 100 to 50 GW in the two cases. However, the magnetospheric particle density at these planets is some 103 times lower than at Jupiter (Table 3), suggesting that we should expect much lower FUV emitted powers than this initial extrapolation implies. The observed FUV powers, reported by Bhardwaj and Gladstone (BG_00 (2000)), are at most 40 and 0.1 GW: the latter value is of the order which we would expect for the low plasma content of Neptune’s magnetosphere, but Uranus does not seem to scale down in the same way; perhaps the very large tilt (59o) between its magnetic dipole and rotation axis and the 30% offset of the dipole from the planet’s centre, causing an order of magnitude difference in surface magnetic field strength between day- and night-side, have also the effect of enhancing the power output in the aurora. In any case, taking these estimates together with the vaste distances from Earth of these two planets excludes the possibility of detecting their X-ray auroral emissions with current instruments. Indeed Bhardwaj et al. (Bhardwaj_07 (2007)) report an unsuccessful attempt by Chandra to detect X-rays from Uranus in August 2002. These authors also suggest that Uranus and Neptune, as well as Saturn’s moon Titan, are likely to shine in X-rays, both by particle precipitation in the magnetosphere, and by scattering of solar X-rays. Looking to the future, let us consider the most optimistic case for Uranus, at about 4 times the distance from Earth than Jupiter, with an FUV output 1000 times lower than Jupiter: ignoring the much smaller magnetospheric particle density, and scaling from the observed Jovian 0.2 - 2 keV auroral emission (few times 10-14 erg cm-2 s-1, Branduardi-Raymont et al. 2007b ) implies a flux at Earth from Uranus of 10-18 erg cm-2 s-1, far too low for current X-ray observatories, and about an order of magnitude below IXO’s expected sensitivity limit.
5 Conclusions
-
1.
Statement 1. We report the results of all the X-ray observations of Saturn carried out to date. We present a detailed spectral analysis of the available data which reinforces the earlier conclusion (Bhardwaj et al. 2005a ) that the planet’s disk acts as a reflector of solar X-rays, much in the same way as observed for Jupiter, Earth, Venus and Mars (cf. Bhardwaj et al. Bhardwaj_07 (2007)).
-
2.
Statement 2. Our results also suggest that the strength of the X-ray emission from the Saturnian rings, in the form of a fluorescence oxygen line, does not systematically decrease, like that from the disk, while the solar activity cycle evolves towards its minimum. As a possible alternative to scattering of solar X-rays in the rings icy material, we suggest that the origin of the line may be related to the formation of the spokes, which appear on the East ansa of the rings as do the bright X-ray spots seen by Chandra, by lightning-induced electron beams.
-
3.
Statement 3. Unlike Jupiter and Earth, we do not find evidence for X-ray aurorae on Saturn. This can be explained by the limited sensitivity of the observations to date, if the auroral X-ray and FUV emissions on Saturn have relative strengths similar to those on Jupiter. Other factors, such as magnetic field strength, magnetospheric particle densities and internal plasma sources may also contribute.
-
4.
Statement 4. After comparison with Jupiter and Earth, we conclude that Saturn is unique in its X-ray characteristics as it is in the FUV (Clarke et al. 2005). We still have much to learn about the precise mechanisms operating in its aurorae, and in its rings, leading (or not, as it may be) to X-ray production. The effectiveness of further observations with Chandra and XMM-Newton will increase as we move out of the current (2009) minimum in the solar activity cycle, providing invaluable additional information on the evolution of both, disk and rings emissions, and of their response to the solar X-ray flux and the solar wind. However, a much more efficient way to pursue and enhance these studies, and relate the electromagnetic output of the planet to particle and magnetic field measurements, would involve flying an X-ray spectrometer to operate in-situ, onboard a spacecraft mission to the Saturnian system. We look forward to the possible realisation of this project in association with the missions to the outer planets currently being studied by both ESA and NASA. Such a mission to Saturn is most likely to involve a close encounter with Titan, and an X-ray spectrometer would return unique data on this enigmatic satellite, and its interactions with Saturn and the solar wind as well, especially at times when it is outside Saturn’s magnetosphere. In-situ X-ray observations are also the only feasible way to search for auroral X-ray emission from Uranus and Neptune.
Acknowledgements.
GBR acknowledges useful discussions with G. H. Jones and suggestions by T. E. Cravens. This work is based in part on observations obtained with XMM-Newton, an ESA science mission with instruments and contributions directly funded by ESA Member States and the USA (NASA). The Mullard Space Science Laboratory acknowledges financial support from the UK Science and Technology Facilities Council.References
- (1) Bhardwaj, A., & Gladstone, G. R. 2000, Rev. Geophys. 38, 295
- (2) Bhardwaj, A., Elsner, R. F., Waite, J. H., Jr., et al. 2005a, ApJ, 624, L121
- (3) Bhardwaj, A., Elsner, R. F., Waite, J. H., Jr. et al. 2005b, ApJ, 627, L73
- (4) Bhardwaj, A., Branduardi-Raymont, G., Elsner, R. F. et al. 2005c, Geochim. Res. Lett., 32, L03S08
- (5) Bhardwaj, A. 2006, Advances in Geosciences, World Scientific Publishing Co., Ed.s W.-H. Ip & A. Bhardwaj, 3, 215
- (6) Bhardwaj, A., Elsner, R. F., Gladstone, G. R. et al. 2006, J. Geophys. Res., 111, A11225
- (7) Bhardwaj, A., Elsner, R. F., Gladstone, G. R. et al. 2007, Planet. Space Sci., 55, 1135
- (8) Branduardi-Raymont, G., Elsner, R. F., Gladstone, G. R. et al. 2004, A&A, 424, 331
- (9) Branduardi-Raymont, G., Bhardwaj, A., Elsner, R. F. et al. 2007a, Planet. Space Sci., 55, 1126
- (10) Branduardi-Raymont, G., Bhardwaj, A., Elsner, R. F. et al. 2007b, A&A, 463, 761
- (11) Branduardi-Raymont, G., Elsner, R. F., Galand, M. et al. 2008, J. Geophys. Res., 113, A02202
- (12) Cash, W. 1979, ApJ, 228, 939
- (13) Clarke, J. T., Grodent, D., Cowley, S. W. H. et al. 2004, In: Jupiter. The planet, satellites and magnetosphere. Ed.s F. Bagenal, T. E. Dowling, W. B. McKinnon. Cambridge Planetary Science, Vol. 1, Cambridge University Press
- (14) Clarke, J. T., Gerard, J.-C., Grodent, D. et al. 2005, Nature, 433, 717
- (15) Clarke, J. T., Nichols, J., Gerard, J.-C. et al. 2009, J. Geophys. Res., 114, A05210
- (16) Coates, A. J., McAndrews, H. J., Rymer, A. M. et al. 2005, Geochim. Res. Lett., 32, L14S09
- (17) Cowley, S. W. H., Badman, S. V., Bunce, E. J. et al. 2005, J. Geophys. Res., 110, A02201
- (18) Crary, F., Clarke, J. T., Dougherty, M. K. et al. 2005, Nature, 433,720
- (19) Cravens, T. E., Clark, J., Bhardwaj, A. et al. 2006, J. Geophys. Res., 111, A07308
- (20) den Herder, J. W., Brinkman, A. C., Kahn, S. M. et al. 2001, A&A, 365, L7
- (21) Elsner, R. F., Lugaz, N., Waite, J. H. Jr. et al. 2005, J. Geophys. Res., 110, A01207
- (22) Gérard, J.-C., Grodent, D., Gustin, J. et al. 2004, J. Geophys. Res., 109, A09207
- (23) Gérard, J.-C., Bunce, E. J., Grodent, D. et al. 2005, J. Geophys. Res., 110, A11201
- (24) Gérard, J.-C., Grodent, D., Cowley, S. W. H. et al. 2006, J. Geophys. Res., 111, A12210
- (25) Gérard, J.-C., Bonfond, B., Gustin, J. et al. 2009, Geochim. Res. Lett., 36, L02202
- (26) Gladstone, G. R., Waite, J. H. Jr., Grodent, D. et al. 2002, Nature, 415, 1000
- (27) Gustin, J., Gérard, J.-C., Pryor, W. et al. 2009, Icarus, 100, 176
- (28) Louarn, P., Kurth, W. S., Gurnett, D. A. et al. 2007, Geochim. Res. Lett., 34, L20113
- (29) Jones, G. H., Krupp, N., Krüger, H. et al. 2006, Geochim. Res. Lett., 33, L21202
- (30) Mason, K. O., Breeveld, A., Much, R. et al. 2001, A&A, 365, L36
- (31) Maurellis, A. N., Cravens, T. E., Gladstone, G. R. et al. 2000, Geochim. Res. Lett., 27, 1339
- (32) Ness, J.-U., Schmitt, J. H. M. M., & Robrade, J. 2004a, A&A, 414, L49
- (33) Ness, J.-U., Schmitt, J. H. M. M., Wolk, S. J., Dennerl, K., & Burwitz, V. 2004b, A&A, 418, 337
- (34) Singhal, R. P., Chakravarty, S. C., Bhardwaj, A., & Prasad, B. 1992, J. Geophys. Res., 97, 18245
- (35) Stallard, T., Miller, S., Melin, H. et al. 2008, Nature, 453, 1083
- (36) Strüder, L., Briel, U., Dennerl, K. et al. 2001, A&A, 365, L18
- (37) Tseng, W.-L., Ip, W.-H., Johnson, R. E., Cassidy, T. A and Elrod, M. K. 2009, Icarus, in press
- (38) Turner, M. J. L., Abbey, A., Arnaud, M. et al. 2001, A&A, 365, L27
- (39) Waite, J. H. Jr., Boice, D. C., Hurley, K. C. et al. 1992, Geochim. Res. Lett., 19, 83
- (40) Waite, J. H. Jr., Gladstone, G. R., Lewis, W. S. et al. 1997, Science, 276, 104