First Detection of Ammonia in the Large Magellanic Cloud: The Kinetic Temperature of Dense Molecular Cores in N 159 W
Abstract
The first detection of ammonia (NH3) is reported from the Magellanic Clouds. Using the Australia Telescope Compact Array, we present a targeted search for the (,) = (1,1) and (2,2) inversion lines towards seven prominent star-forming regions in the Large Magellanic Cloud (LMC). Both lines are detected in the massive star-forming region N 159 W, which is located in the peculiar molecular ridge south of 30 Doradus, a site of extreme star formation strongly influenced by an interaction with the Milky Way halo. Using the ammonia lines, we derive a kinetic temperature of K, which is 2-3 times below the previously derived dust temperature. The ammonia column density, averaged over is cm-2 ( cm-2 over in the other six sources) and we derive an ammonia abundance of with respect to molecular hydrogen. This fractional abundance is 1.5-5 orders of magnitude below those observed in Galactic star-forming regions. The nitrogen abundance in the LMC (% solar) and the high UV flux, which can photo-dissociate the particularly fragile NH3 molecule, must both contribute to the low fractional NH3 abundance, and we likely only see the molecule in an ensemble of the densest, best shielded cores of the LMC.
Subject headings:
galaxies: individual(Large Magellanic Cloud) — ISM: molecules — (galaxies:) Magellanic Clouds — stars: formation — galaxies: ISM — radio lines: ISMLarge Magellanic Cloud (catalog ) Australia Telescope Compact Array
1. Introduction
Our position within the disk of the Milky Way makes it very difficult to understand galaxy–wide effects that may influence the formation of molecular clouds, their stability against gravitational collapse, and the subsequent formation of stars. Ideally, one would like to study a more face-on, nearby galaxy and fortunately such objects exist, the Magellanic Clouds. The Large and Small Magellanic Clouds (LMC, SMC) are at distances of kpc and kpc, respectively (Madore & Freedman, 1991; Gieren et al., 1998; Keller & Wood, 2006, this LMC distance is used throughout the paper). The proximity is ideal for observations to provide the high detail needed to study the formation and evolution of giant molecular clouds and even to “zoom” into individual prestellar cores (at the distance of the LMC 1″ corresponds to 0.24 pc). The LMC exhibits a favorable inclination of (van der Marel & Cioni, 2001). This value is ideal for both, a detailed census of all molecular clouds and their distribution as well as to determine their kinematics from radial velocities. The LMC may therefore be the very best object to study the influence that galaxy-wide processes exert on the star formation (SF) properties of an entire galaxy.
The “fuel” for SF is molecular gas. Good knowledge of its physical and chemical condition, such as temperature and density, is indispensable if we are to understand under which conditions, and through which processes, and phases the molecular clouds collapse to protostars. Molecular lines are a rich source for such information. The sites of actual SF, the prestellar cores, are typically very dense and cold and they may be surrounded by a warmer, more tenuous molecular envelope. However, rotational lines from linear molecules, such as the very abundant CO, have only limited power to distinguish between the two phases. Radiative transfer models, such as “Large Velocity Gradient” (LVG) codes (e.g. Scoville & Solomon, 1974; Kwan & Scoville, 1975; van der Tak et al., 2007), show that cold and dense gas on one hand, and hot and tenuous gas on the other hand, produce similar rotational line ratios. This degeneracy can, in principle, be broken by observing a large number of rotational lines, including a variety of isotopomeres or even different molecular species (e.g., Weiß et al., 2001a, 2007). Such an approach requires extremely well-calibrated spectra at millimeter and sub-millimeter wavelengths, which are difficult to obtain. Different beam sizes lead to additional complexity and resulting parameters also depend on the detailed properties of the applied radiative transfer model.
A much more direct and therefore more reliable path is to observe lines from molecules with non–linear structures. One of the most abundant non–linear molecule in the Universe is ammonia (NH3). NH3 is a tetrahedral symmetric–top with the exceptional ability for the nitrogen atom to tunnel through the plane defined by the three hydrogen atoms. This peculiar feature produces a series of energy doublets, and the transitions between the levels of such pairs are known as inversion transitions. As a symmetric-top, the level scheme of NH3 is not, as in the case of CO, characterized by a single (=0) rotational ladder. Instead, there is a multitude of -ladders, whose relative populations are determined by approximately Boltzmann-distributed collisional processes, providing direct information on kinetic temperatures.
Despite previous searches for ammonia in the Magellanic Clouds (e.g. Osterberg et al., 1997), the molecule has not been detected in the past. In this paper we provide deeper data and present the first detection of ammonia in the Magellanic system.
2. Observations and Data Reduction
The observations, all performed with the Australia Telescope Compact Array (ATCA222The Australia Telescope Compact Array is part of the Australia Telescope which is funded by the Commonwealth of Australia for operation as a National Facility managed by CSIRO.), were set up to accommodate two different ammonia search strategies, both with the same primary beam (field of view) of 24. One strategy was to perform a survey (project code C1372) toward seven different star-forming regions. The source names and positions are listed in Table 1 and were selected from samples of particularly prominent, line-rich regions studied in Chin et al. (1997) and Heikkilä et al. (1999). The second part of our strategy was to obtain a deep integration (project code CX058) toward one of the targets, the brightest molecular clump in the star-forming region N 159, N 159-West (hereafter “N 159 W”), which is known to be one of the two most intense molecular hot spots of the Magellanic Clouds.
The multi-source survey was performed on 2005 March 19 and 20 when the ATCA was in the H 214 antenna configuration. The calibrators PKS 1934-638, PKS 1921-293, and PKS 0454-810 were used for flux, bandpass, and gain/phase calibration, respectively. The integration time on each position was about 180 min split up into 9 different LST intervals, with gain/phase calibrator scans in between, for better uv–coverage. The receivers were tuned to observe the NH3(1,1) line at high resolution, centered on 23.673 GHz, with a bandwidth of 8 MHz and 512 channels. This sky frequency was chosen to accommodate a velocity range of km s-1 for the (1,1) line, centered on an LSR velocity of 255 km s-1 (rest frequency for the [1,1] line: 23694.4955 MHz, for the [2,2] line: 23722.6333 MHz333taken from the JPL Molecular Spectroscopy Database: http://spec.jpl.nasa.gov). The almost circular synthesized beam varies slightly from position to position but the linear resolution hovers around FWHM (for the sensitivity, see Sect. 3).
The deeper, targeted ammonia observations toward N 159 W were executed during three observing periods, 2006 April 27 ( hours integration time, H 214 array configuration), 2006 September 15 ( hours, H 75), and 2006 September 16 ( hours, H 75). We used the same flux and complex gain calibrators as before, but the bandpass was calibrated using observations of PKS 0537-441. To accommodate the NH3 (1,1) and (2,2) transitions simultaneously, we tuned the two available frequencies of the ATCA to 23.675 GHz and 23.703 GHz, respectively. The setup was not symmetric but has 8 MHz bandwidth and 512 channels for NH3 (1,1) (corresponding to 85 km s-1 velocity coverage and a resolution of km s-1), and 16 MHz bandwidth with 256 channels for NH3 (2,2) ( km s-1 with km s-1 resolution). To have consistent data cubes, we binned both uv data sets to the same channel spacing of km s-1. The rms noise per channel map is mJy within a (PA) synthesized beam. This corresponds to a brightness temperature of mK. For a better representation of the lines, we boxcar-smoothed the binned spectra with a width of five channels in velocity space. The smoothed data, which widens the true velocity widths by a factor of (see also Sect. 4.2), are used for all further analysis.
3. Results
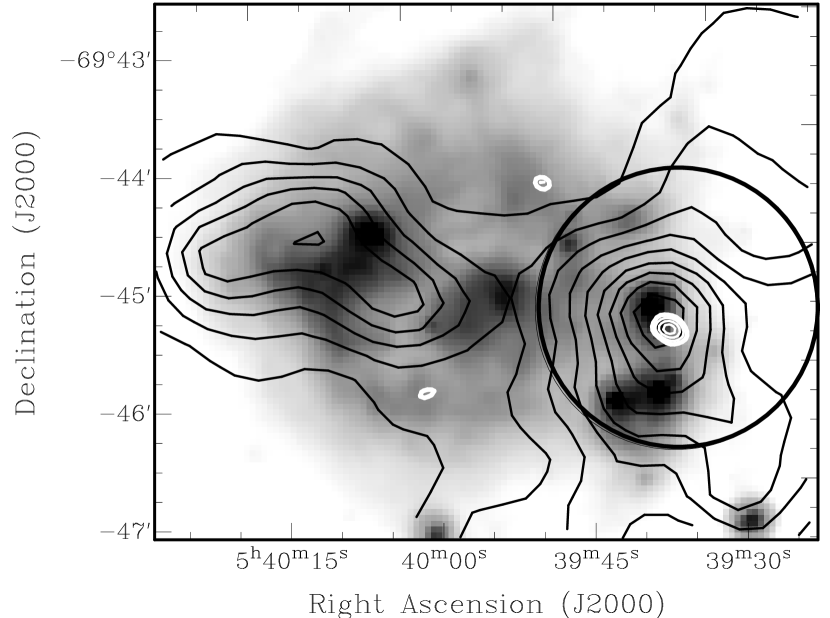
The survey toward the different regions results in non-detections with an rms of 4 mJy in a 0.8 km s-1 channel. With the rather small synthesized beam of ″, this translates to a brightness temperature of mK. The deeper (in terms of brightness temperature) integration towards N 159 W, however, clearly reveals the NH3 (1,1) line which breaks up into two different velocity components. The NH3 (2,2) line is detected with a lower statistical significance, in particular the low-velocity component. An overlay of the integrated intensity of the NH3(1,1) line on a Spitzer MIPS 24 m map is shown in Fig. 1. The ammonia emission, centered on , coincides with a peak seen in the transition of carbon monoxide (CO data, at a resolution of , taken from Ott et al. 2008, see also Pineda et al. 2009), and is located very close to the bright IR source N 159 W AN (e.g., see Jones et al., 2005). The ammonia emitting region has a very similar size and axis ratio as the beam of the observations, which indicates that it is unresolved. We also do not expect to lose extended flux by the spatial filtering of the interferometer as we observed in the most compact H75 antenna configuration of the ATCA. At the observed frequencies, this antenna configuration is sensitive to scales up to 80″, or 20 pc at the distance of the LMC (about 4-5 times the size of the synthesized beam). However, a visual inspection indicates that the position angle may deviate marginally from that of the beam (see Sect. 2). In the following, we assume that the emission is not resolved and leave a better characterization of the source structure to deeper observations at better spatial resolution. The NH3 (1,1) and (2,2) spectra are displayed in Fig. 2. Gaussian fits with a low- and a high-velocity component provide good descriptions for the individual line profiles. The fit parameters are listed in Table 2. The high, km s-1 velocity component is about a factor of stronger than the low, km s-1 velocity component and it is slightly broader.
We do not detect the typical ammonia satellite lines at offset velocities of km s-1 and km s-1. The strength of the satellite lines with respect to the main line depends on the optical depth of the line. Ho & Townes (1983) find that the peaks of the inner satellite lines with respect to the peak of the main line are described by . For the extreme case of optical thin lines () this ratio approaches ; in the optically thick case the ratio would be unity. At km s-1 we detect a faint feature that could correspond to an inner satellite line in the optically thin limit. Its significance over the smoothed data, however is only (note that the symmetric line blends with the low-velocity component; a feature at km s-1 may indicate an outer satellite line). A clear, detection of an inner satellite would correspond to an opacity of . This conservative upper limit allows thin and moderate opacities for the ammonia emitting gas and we are able to exclude the optically thick case. While we cannot prove it, we assume that the optical depth of the other, weaker NH3 velocity component also is only moderately optically deep at most.
4. Discussion
4.1. The Kinetic Temperature of N 159 W
Assuming the optically thin case (see above), the column densities of the upper ammonia levels of the metastable (,) inversion doublets, (,) (in units of cm-2), can be derived using
| (1) |
(e.g. Henkel et al., 2000, with denoting the main beam brightness temperature of the inversion line in Kelvin, being the velocity in km s-1, and representing the frequency in GHz). Our values for N 159 W are listed in Table 2. For a single ortho- or para- ammonia species (the observed lines in N 159 W all belong to para-ammonia) the Boltzmann distribution for a rotational temperature (in K) is described by
| (2) |
Here, the energy difference between the and level is given by [41.2 K between NH3 (1,1) and (2,2)]. We derive a rotational temperature of K for the high-velocity NH3 component and a very similar K for the low-velocity component (uncertainties are based on the values for derived in Eq. 1, not quadratically propagated but using the extremes). Rotational temperatures are always lower limits to the kinetic gas temperatures. However, for temperatures K the differences between and are less than 10% and thefore negligible (e.g. Walmsley & Ungerechts, 1983; Danby et al., 1988). We can safely assume for both components of N 159 W.
Thermal linewidths of gas at such cold kinetic temperatures are 0.2 km s-1. The measured NH3 linewidths are at least an order of magnitude larger than this figure and deconvolving the lines by the instrumental velocity resolution and the applied boxcar smoothing is not sufficient to reach the predicted thermal widths. The gas kinematics must thus be dominated by other processes such as turbulence or by systematic motions of spatially unresolved cloud components. This is supported by the line widths of other molecules which are similar to those of NH3 (e.g. Heikkilä et al., 1999).
The kinetic temperature of the gas traced by NH3 is colder than the 30-40 K dust temperature that is measured in N 159 W (Heikkilä et al., 1999; Bolatto et al., 2000). In their LVG analysis of high excitation molecular gas, Bolatto et al. (2005) establish a two-component model for N 159 W, which comprises a gas phase with K kinetic temperature and a volume density of cm-3, as well as a second phase with K and cm-2. Likely, the detected ammonia traces the low temperature component, albeit at larger volume densities (for volume density estimates based on NH3, see Sect. 4.2). This could be in the form of cold cores surrounded by a warmer envelope. As mentioned above, dust temperatures in the region have been estimated to be times that of NH3 and it is likely that the dust is not only present in the cold cores but also occupies the interface to the warm envelope, covering a rather wide range of densities.
The detailed dust and gas morphologies have implications for the shielding against UV radiation. The NH3 molecule is quite susceptible to photo-dissociation (Suto & Lee, 1983). N 159 W itself is a rather strong source of ionizing photons (e.g. Jones et al., 2005, also see Sect. 4.3) and a smaller contribution comes from the most luminous star-forming region in the Local Group, 30 Doradus, which is about pc away from N 159 W (see, e.g. Pineda et al., 2009). The flux of energetic UV photons may penetrate into the envelope and destroy ammonia. It requires dense cores to provide enough shielding to keep ammonia intact and it is therefore likely that the molecule resides within such dense, cold, compact cores. In addition, unlike CO, nitrogen-bearing species such as NH3 and N2H+ are less prone to depletion on dust grains at densities typical for cold dense cores such as protostellar cores ( cm-3; e.g. Tafalla et al., 2004; Flower et al., 2005, for a density estimate of N 159 W see Sect. 4.2) and NH3 is expected to be abundant in such objects.
4.2. Densities, Masses, and Abundances
For a given single rotational temperature, total NH3 column densities, , can be derived by extrapolating the level distribution over all energies. Ungerechts et al. (1986) provide this extrapolation in their Eq. A15, which only requires and to be determined. For N 159 W we derive a total, 17″ beam-averaged, ammonia column density of cm-2. Toward the same position, the integrated CO() intensity is K km s-1 over a 45″ beam (Mopra data taken from Ott et al., 2008, see also Fig. 1). Assuming a CO to H2 conversion factor of cm-2 (K km s-1)-1 for the LMC (Pineda et al., 2009), the H2 column density can be estimated to be cm-2. With this value, the fractional ammonia abundance in the N 159 W complex becomes . This number is based on a 45″ average of the H2 column density. The H2 distribution within that area, however, is most likely not smooth but exhibits some variation. To excite NH3, a critical density needs to be exceeded. We do not observe NH3 outside the smaller, 17″ ATCA beam, which indicates that the H2 density is likely higher at the position of the NH3 emission than further away from it. Consequently, the ammonia abundance of may be considered an upper limit and any H2 column exceeding the average over 45″ will dilute the ammonia abundance. Furthermore, larger factors, such as reported by Israel et al. (2003) or Fukui et al. (2008), would also drive the fractional ammonia abundance to smaller values.
The factor is just one way to estimate the total H2 content of the molecular cloud. A different approach is to derive virial masses , assuming that the system is virialized and the masses of the clouds are dominated by H2. For a cloud with a Gaussian density profile, the virial mass can be estimated using
| (3) |
(Protheroe et al., 2008) with the radius in pc, the full width at half maximum (FWHM) velocity in km s-1, and the virial mass in M☉ (note that the numerical factor changes with the shape of the radial density profile; e.g. it is times lower for , and times lower for a profile; MacLaren et al., 1988). The NH3 emission position angle may show some deviation from a pure point source but, given the faintness of the source, we use half of the FWHM ATCA beam size as an upper limit to the radius of the cloud, 8″ which corresponds to pc. Together with km s-1, the virial mass amounts to an upper limit of M☉ (for comparison, the virial mass based on the Mopra CO data over the much larger Mopra beam would be M☉). This limit also accounts for the boxcar smoothing of the data; a more narrow line would lower the upper limit and our estimate is therefore a more conservative one. In addition, this estimate also accounts for material other than H2 that is contributing to the virial mass, justifying the upper limit nature of the H2 mass based on the virial method.
Using a spherical geometry of the NH3 emission and assuming that all the virial mass is due to H2, the mean volume density of the molecular gas then can be estimated to cm-3. This value is fairly typical for dense gas in Galactic star-forming regions, spread over the physical size of the beam, pc (e.g. Foster et al., 2009). Finally, if we take the column density of ammonia of cm-2 (see above), we derive a beam averaged ammonia mass of M☉, or M⊕. With H2 masses and densities being upper limits, the fractional abundance of ammonia (molecule number density ratio) then follows as a lower limit of . This value is in agreement with the upper limit derived via above.
We cannot infer any robust variation in fractional ammonia abundance between the two velocity components. The CO(10) emission is about two orders of magnitude brighter (cf. Fig. 2) at the velocity of the ammonia high-velocity component. The ratio appears to be somewhat smaller for the low-velocity component, which would indicate some variation in the abundance. But, given the uncertainties in beam filling factors for the CO and NH3 observations (see also Table 2), better data is needed to reliably establish such a variation.
Using the above values for temperature and upper volume density limit for N 159 W, we estimate the pressure of the clumps in the N 159 W region to be K cm-3. This value is likely to increase substantially when the average value for H2 densities is resolved into individual, smaller clumps with relatively little H2 in between. For comparison, Wong et al. (2009) calculate the midplane pressure for the positions where molecular gas is observed in the LMC. Their highest value is close to our lower limit, which may indicate that the dense NH3 clumps are not in pressure equilibrium with their surroundings, a property that is typical for self-gravitating clouds. We like to note though that the volume density of our calculation is actually based on the virial theorem, i.e. a gravitational equilibrium of the molecular gas that is independent of its environment.
We can now revisit the upper limits of the ammonia survey toward the other six positions. If we assume the same linewidth and kinetic temperature that we find for the two components of N 159 W, the upper limits to the non–detections translate to ammonia columns and of cm-2, and cm-2 for a -sized region, respectively.
4.3. Star Formation Properties of N 159 W
If we take the upper limit to the virial mass of the ammonia emitting region of M☉ for the mass of the molecular clump (see Sect. 4.2 above), the typical SF efficiency of a few percent (Evans et al., 2009) would convert the gas to stellar masses of M☉. This falls within the mass range of open stellar clusters. To be independent of extinction effects (the very nearby ionizing source N 159 W AN is deeply enshrouded by dust as shown by Jones et al., 2005), we use the 1.4 GHz radio continuum map presented in Hughes et al. (2007) to estimate the current SF rate (SFR) via the conversions provided by Haarsma et al. (2000). For N 159 W AN, we measure a flux of mJy which corresponds to a current SFR of M☉ yr-1. The radio emission at that position, however, cannot be entirely separated from other nearby sources and we estimate an uncertainty to the flux and the SFR of up to 50%. If SF continues at that level, the available molecular gas will be fully converted into stars within the next Myr.
4.4. Comparison of N 159 W with Galactic and Extragalactic Star Forming Regions
The LMC has a lower mass and metallicity than the Galaxy. In addition, the N 159 W region is located in the molecular ridge south of the extremely active 30 Doradus star-forming region, at a location where the LMC’s regular disk becomes disturbed by tidal and ram pressure forces that act as the galaxy moves through the Milky Way halo (e.g. Ott et al., 2008). Do these peculiarities change the properties of the molecular clumps formed at this location? In order to address this question we compare our results to the properties of dense molecular cores in the Galaxy. A homogenized sample of molecular cores, drawn from Galactic star-forming regions such as Orion, Ophiuchus, Perseus, Taurus, Serpens, Cepheus, etc. is presented in Jijina et al. (1999). The authors have collected ammonia (1,1) and (2,2) observations for all of their sample and can therefore provide data that may act as a reference for comparison with clouds in other galaxies such as the LMC. More recently, Rosolowsky et al. (2008) (see also Suzuki et al., 1992; Foster et al., 2009) published a comprehensive ammonia survey of 193 dense molecular cores toward the Perseus molecular cloud, a cloud that may also be representative for typical star-forming regions in the Galaxy. The studies agree that Galactic dense molecular cores exhibit typical kinetic gas temperatures of K, with sizes of pc, velocity widths of km s-1, ammonia column densities of cm-2, and virial masses of M☉. In most aspects these values are clearly different from what we measure toward the LMC cloud N 159 W. The difference can be explained by observing an ensemble of cores within the ATCA beam. Such a site could potentially be the birth of an entire stellar cluster (see also Sects. 4.2 and 4.3). Along these lines, the N 159 W region may consist of individual, dense molecular cores that are at temperatures very similar to those found in the Galaxy along with some inter-clump material. Together, the line profiles of the clumps and the more diffuse gas blend to form the measured ammonia lines with a width of km s-1 (note that Rosolowsky et al. 2008 also largely attribute the upper end of their measured linewidths to blending of a number of cores along the line of sight). We would like to note that the N 159 W SF timescales as derived in Sect. 4.3 also match those that are typical in Galactic SF regions (Evans et al., 2009).
The differences in ammonia column densities and fractional abundances between Galactic cores and the emission in N 159 W, however, cannot be reconciled by beam filling arguments. The NH3 column densities in N 159 W are about 50 times lower ( for N 159 W, for Galactic SF regions). If beam filling would be responsible for the difference, the ATCA beam would be diluted by about the same factor. This implies that of the 20 pc2 ATCA beam area only 0.4 pc2 is covered by clouds. If these clouds are similar to Galactic cores (with typical sizes of 0.1 pc and masses of M☉, see above), the coverage corresponds to molecular cores adding up to a total mass of M☉. In Sect. 4.2 we derive an upper limit of M☉ to the virial mass in N 159 W, which is about two orders of magnitude larger. This indicates that the basic assumption for the calculation, the equality of Galactic and N 159 W ammonia column density, is wrong.
The virial mass is an upper limit due to unknown mass components other than H2 within the beam and due to the fact that the ATCA beam was taken as the virial radius of the unresolved emission. Can the parameters play together to create the M☉ mass as predicted from Galactic clumps? We measure a velocity width of 5 km s-1 within N 159 W and, according to Eq. 3, this determines the size of the gaseous emission for the M☉ to be pc if the clouds are in virial equilibrium. Such a small value is clearly unrealistic and we conclude that it is not possible to reconcile the ammonia column densities with those of Galactic SF regions based on beam filling arguments alone. It is likely that intra-clump gas covers a larger region of the beam and/or a larger number of cores is present in N 159 W. But this implies that the ammonia column densities in N 159 W are intrinsically lower than those in Galactic cores.
Similarly, the low fractional abundances of ammonia in N 159 W cannot be fully explained by clumping of the gas within the beam (note that the the abundances are independent of the beam size when applying the virial mass as in Sect. 4.2). Benson & Myers (1983) derive for Galactic Dark Clouds on average fractional ammonia abundances of and Mauersberger et al. (1987) obtain for a hot core. The resolved Galactic clumps as listed in the more recent Rosolowsky et al. (2008), Foster et al. (2009), and Jijina et al. (1999) studies have NH3 abundances of order . In contrast, we estimate a fractional ammonia abundance in N 159 W of (see Sect. 4.2). N 159 W thus exhibits at least orders of magnitude lower fractional ammonia abundance than seen in individual cores embedded in Galactic clouds. But N 159 W is not an exception: the upper limits towards the other LMC star-forming regions in our survey exhibit a limit of at least one order of magnitude below the Galactic ammonia abundances. Such a difference cannot be an effect of the overall lower metallicity of the LMC alone, which is % solar (Luck et al., 1998; Rolleston et al., 2002, based mostly on iron, carbon, oxygen and silicon). A combination of the times lower abundance of nitrogen in the LMC, % solar (Hunter et al., 2007), and the high UV flux at the N 159 W location (see Sec. 4.1 and also Deharveng & Caplan, 1992; Bolatto et al., 2000; Pineda et al., 2009) that can potentially photo-dissociate the fragile NH3 (Suto & Lee, 1983) must therefore contribute to its low fractional abundance.
We cannot exclude that the fraction of clump to interclump NH3 emission might be very different in N 159 W as compared to Galactic SF regions. In such a scenario, hardly any of the molecular gas parameters can be reconciled between the two galaxies. Beam dilution effects can explain most of the differences, except for the ammonia abundance and column density, and is therefore a more natural interpretation. To fully resolve this issue, sensitive observations at better spatial resolution are required.
Among extragalactic objects, only M 82 is known to exhibit a similarly low fractional ammonia abundance like N 159 W. Weiß et al. (2001b) derive a value of for this prominent starburst galaxy. The gas in M 82, at K, is warmer than in N 159 W and the metallicity of M 82 may also exceed that of the LMC, in particular close to the central starburst region (see, e.g. McLeod et al., 1993; Martin, 1997). The presence of nearby, strongly ionizing sources in both M 82 and N 159 W suggests that photo-dissociation plays an important role in regulating the ammonia abundances in both galaxies.
5. Summary
In this paper, we present a search for ammonia toward seven prominent star forming regions as well as deep observations towards the star-forming N 159 W region close to 30 Doradus. Observing the (,)=(1,1) and (2,2) NH3 inversion lines we find the following:
-
•
Two ammonia velocity components are observed toward N 159 W, both with linewidths of km s-1. The components are km s-1 apart. At least for the brighter line, we can exclude large optical depths. The linewidths and derived virial masses (of order M☉) indicate that we may see the molecular gas that forms an ensemble of stars similar to open clusters in the Galaxy.
-
•
We derive the kinetic temperature of the gas to be K for both components, 2-3 times colder than the dust in the region.
-
•
The ammonia column densities in all of the observed LMC star-forming regions are lower than typical values in our Galaxy, even after correcting for beam dilution effects.
-
•
In the absence of a large, diffuse and hot component in N 159 W, the fractional ammonia abundance relative to H2 is with within a ( pc) beam, about 1.5-5 orders of magnitude lower than in Galactic star-forming clouds and prestellar cores. The difference in abundances (based on this cloud) is therefore much larger than the metallicity difference of the LMC with respect to the Galaxy (LMC metallicity: % solar). NH3 photo-dissociation from the high UV flux in the LMC as well as its lower nitrogen abundance (% solar) potentially explain the NH3 deficiency.
-
•
If the gas is converted into stars with the current, radio continuum-based star formation rate, SF will cease within the typical SF timescale of a few Myr.
-
•
The multi-position survey did not reveal any detection down to a limit of mK in a 0.8 km s-1 velocity bin. If there are molecular clumps with properties similar to those in N 159 W, we derive upper limits to the total column densities at these positions to be cm-2 within a 9″ (2 pc) beam.
The Magellanic Clouds are unique as they allow us to perform analyses similar to that possible for Galactic star forming regions, but without the confusion that occur in edge-on systems. They are also ideal to trace the effects that low metallicity has on the state and chemistry of the dense molecular gas, the material that eventually forms the stars. The kinetic temperature of the gas is a very important parameter to understand the dense gas. It will be the focus of future studies to extend the use of ammonia as a thermometer for a larger number of gas clumps in order to obtain a more representative sample.
References
- Benson & Myers (1983) Benson, P. J., & Myers, P. C. 1983, ApJ, 270, 589
- Bolatto et al. (2000) Bolatto, A. D., Jackson, J. M., Israel, F. P., Zhang, X., & Kim, S. 2000, ApJ, 545, 234
- Bolatto et al. (2005) Bolatto, A. D., Israel, F. P., & Martin, C. L. 2005, ApJ, 633, 210
- Chin et al. (1997) Chin, Y.-N., Henkel, C., Whiteoak, J. B., Millar, T. J., Hunt, M. R., & Lemme, C. 1997, A&A, 317, 548
- Danby et al. (1988) Danby, G., Flower, D. R., Valiron, P., Schilke, P., & Walmsley, C. M. 1988, MNRAS, 235, 229
- Deharveng & Caplan (1992) Deharveng, L., & Caplan, J. 1992, A&A, 259, 480
- Evans et al. (2009) Evans, N. J., et al. 2009, ApJS, 181, 321
- Flower et al. (2005) Flower, D. R., Pineau Des Forêts, G., & Walmsley, C. M. 2005, A&A, 436, 933
- Foster et al. (2009) Foster, J. B., Rosolowsky, E. W., Kauffmann, J., Pineda, J. E., Borkin, M. A., Caselli, P., Myers, P. C., & Goodman, A. A. 2009, ApJ, 696, 298
- Fukui et al. (2008) Fukui, Y., et al. 2008, ApJS, 178, 56
- Gieren et al. (1998) Gieren, W. P., Fouque, P., & Gomez, M. 1998, ApJ, 496, 17
- Haarsma et al. (2000) Haarsma, D. B., Partridge, R. B., Windhorst, R. A., & Richards, E. A. 2000, ApJ, 544, 641
- Heikkilä et al. (1999) Heikkilä, A., Johansson, L. E. B., & Olofsson, H. 1999, A&A, 344, 817
- Henkel et al. (2000) Henkel, C., Mauersberger, R., Peck, A. B., Falcke, H., & Hagiwara, Y. 2000, A&A, 361, L45
- Hughes et al. (2007) Hughes, A., Staveley-Smith, L., Kim, S., Wolleben, M., & Filipović, M. 2007, MNRAS, 382, 543
- Hunter et al. (2007) Hunter, I., et al. 2007, A&A, 466, 277
- Ho & Townes (1983) Ho, P. T. P., & Townes, C. H. 1983, ARA&A, 21, 239
- Israel et al. (2003) Israel, F. P., et al. 2003, A&A, 406, 817
- Jijina et al. (1999) Jijina, J., Myers, P. C., & Adams, F. C. 1999, ApJS, 125, 161
- Jones et al. (2005) Jones, T. J., Woodward, C. E., Boyer, M. L., Gehrz, R. D., & Polomski, E. 2005, ApJ, 620, 731
- Keller & Wood (2006) Keller, S. C., & Wood, P. R. 2006, ApJ, 642, 834
- Kwan & Scoville (1975) Kwan, J., & Scoville, N. 1975, ApJ, 195, L85
- Luck et al. (1998) Luck, R. E., Moffett, T. J., Barnes, T. G., III, & Gieren, W. P. 1998, AJ, 115, 605
- Madore & Freedman (1991) Madore, B. F., & Freedman, W. L. 1991, PASP, 103, 933
- Martin (1997) Martin, C. L. 1997, ApJ, 491, 561
- Mauersberger et al. (1987) Mauersberger, R., Henkel, C., & Wilson,T. L. 1987, A&A, 173, 352
- MacLaren et al. (1988) MacLaren, I., Richardson, K. M., & Wolfendale, A. W. 1988, ApJ, 333, 821
- McLeod et al. (1993) McLeod, K. K., Rieke, G. H., Rieke, M. J., & Kelly, D. M. 1993, ApJ, 412, 111
- Osterberg et al. (1997) Osterberg, J., Staveley-Smith, L., Weisberg, J. M., Dickey, J. M., & Mebold, U. 1997, Publications of the Astronomical Society of Australia, 14, 246
- Ott et al. (2008) Ott, J., et al. 2008, Publications of the Astronomical Society of Australia, 25, 129
- Pineda et al. (2009) Pineda, J. L., Ott, J., Klein, U., Wong, T., Muller, E., & Hughes, A. 2009, ApJ, 703, 736
- Protheroe et al. (2008) Protheroe, R. J., Ott, J., Ekers, R. D., Jones, D. I., & Crocker, R. M. 2008, MNRAS, 390, 683
- Rolleston et al. (2002) Rolleston, W. R. J., Trundle, C., & Dufton, P. L. 2002, A&A, 396, 53
- Rosolowsky et al. (2008) Rosolowsky, E. W., Pineda, J. E., Foster, J. B., Borkin, M. A., Kauffmann, J., Caselli, P., Myers, P. C., & Goodman, A. A. 2008, ApJS, 175, 509
- Scoville & Solomon (1974) Scoville, N. Z., & Solomon, P. M. 1974, ApJ, 187, L67
- Suto & Lee (1983) Suto, M., & Lee, L. C. 1983, J. Chem. Phys., 78, 4515
- Suzuki et al. (1992) Suzuki, H., Yamamoto, S., Ohishi, M., Kaifu, N., Ishikawa, S.-I., Hirahara, Y., & Takano, S. 1992, ApJ, 392, 551
- Tafalla et al. (2004) Tafalla, M., Myers, P. C., Caselli, P., & Walmsley, C. M. 2004, A&A, 416, 191
- Ungerechts et al. (1986) Ungerechts, H., Winnewisser, G., & Walmsley, C. M. 1986, A&A, 157, 207
- van der Marel & Cioni (2001) van der Marel, R. P., & Cioni, M.-R. L. 2001, AJ, 122, 1807
- van der Tak et al. (2007) van der Tak, F. F. S., Black, J. H., Schöier, F. L., Jansen, D. J., & van Dishoeck, E. F. 2007, A&A, 468, 627
- Walmsley & Ungerechts (1983) Walmsley, C. M., & Ungerechts, H. 1983, A&A, 122, 164
- Weiß et al. (2001a) Weiß, A., Neininger, N., Hüttemeister, S., & Klein, U. 2001, A&A,365, 571
- Weiß et al. (2001b) Weiß, A., Neininger, N., Henkel, C., Stutzki, J., & Klein, U. 2001, ApJ, 554, L143
- Weiß et al. (2007) Weiß, A., Downes, D., Neri, R., Walter, F., Henkel, C., Wilner, D. J., Wagg, J., & Wiklind, T. 2007, A&A, 467, 955
- Wong et al. (2009) Wong, T., et al. 2009, ApJ, 696, 370

| Name | RA (J2000) | DEC (J2000) |
|---|---|---|
| N 83 A | ||
| N 105 A | ||
| N 113 | ||
| N 44 BC | ||
| 30 Dor 10 | ||
| N 159 W | ||
| N 159 S |
| Component 1 | Component 2 | ||||
|---|---|---|---|---|---|
| parameter | unit | NH3 (1,1) | NH3 (2.2) | NH3 (1,1) | NH3 (2,2) |
| [mK] | 5 | ||||
| [km s-1] | |||||
| [km s-1] | |||||
| [K km s-1] | |||||
| [ cm-2] | |||||
| [K] | |||||
| [ cm-2] | |||||