The Linearity of the Cosmic Expansion Field from 300 to and the Bulk Motion of the Local Supercluster with Respect to the CMB
Abstract
The meaning of “linear expansion” is explained. Particularly accurate relative distances are compiled and homogenized a) for 246 SNe Ia and 35 clusters with , and b) for relatively nearby galaxies with 176 TRGB and 30 Cepheid distances. The 487 objects define a tight Hubble diagram from implying individual distance errors of . Here the velocities are corrected for Virgocentric steaming (locally ) and – if – for a motion of the Local Supercluster towards the warm CMB pole at , ; local peculiar motions are averaged out by large numbers. A test for linear expansion shows that the corrected velocities increase with distance as predicted by a standard model with [corresponding to ], but the same holds – due to the distance limitation of the present sample – for a range of models with between and . For these models does not vary systematically by more than over the entire range. Local, distance-dependent variations are equally limited to 2.3% on average. In particular the proposed Hubble Bubble of Zehavi et al. and Jha et al. is rejected at the level. – Velocity residuals in function of the angle from the CMB pole yield a satisfactory apex velocity of and a coherence radius of the Local Supercluster of (Mpc), beyond which galaxies are seen on average at rest in co-moving coordinates with respect to the CMB. Since no obvious single accelerator of the Local Supercluster exists in the direction of the CMB dipole its motion must be due to the integral gravitational force of all surrounding structures. Most of the gravitational dipole comes probably from within .
1 INTRODUCTION
1.1 Preliminaries
The basic prediction of all models of ideal universes that are homogeneous and isotropic is that, if the expansion is real, there must necessarily be a linear relation between redshift and distance. There are many proofs, but among the earliest are those by Lemaître (1927, 1931) and Robertson (1928) even before the observational announcement by Hubble (1929) in which he, in the final sentence of his paper, suggested linearity may be only local.
Modern theoretical proofs for global linearity are set out in many of the standard text books at various levels of mathematical sophistication. Popular among the simpler proofs is that a linear relation is the only one that preserves relative shapes of geometrical shapes in an expanding manifold, and which is the same from all vantage points. Deeper proofs, based on properties of the metric of homogeneous, isotropic models, follow Robertson (1929, 1933) and Walker (1936), and lead to the Robertson-Walker line element of the metric.
A unique property of a linear velocity field is that every vantage point in the field appears to be the center of the expansion and has the same ratio of velocity to distance over the entire field. Because of this important property, much effort over the past 80 years has been made by the observers to prove, or disprove, linearity, either locally or globally. The first comprehensive result was that by Hubble & Humason (1931), enlarging the observational data available to Hubble in 1929.
Many summaries of the theoretical expectation of linearity and observational verification for the standard model exist. From the theoretical side the classic text books include those by Heckmann (1942), Bondi (1960), Robertson & Noonan (1968), Harrison (1981), Narlikar (1983), Peebles (1993), Peacock (1999). Bowers & Deeming (1984), and Carroll & Ostlie (1996) are exemplary at the high end of the intermediate level. On the observational side, text book-like chapters by Gunn & Oke (1975) and Sandage (1975, 1988, 1995) are useful.
Deviations from a linear velocity-distance relation divide into two categories. (1) The relation is non-linear everywhere, i.e. the deviation is global. (2) The deviation is local, going over into a linear relation at large distances.
The first category is the most fundamental because it denies the standard homogeneous model everywhere. The second contains models where either the local Hubble constant changes up to a certain distance such as increasing or decreasing outward, or where the local irregularities are due to streaming motions due, presumably, to a local inhomogeneous distribution of matter.
The most radical of the first category of global non-linear models can easily be disproved observationally, even as early as in Hubble & Humason (1931), by noting that the slope of the local log(redshift) - magnitude relation is close to 0.2 as expected in the case of linear expansion. This conclusion was much strengthened by the tight Hubble diagram from brightest clusters galaxies in Humason et al. (1956) and then, from 1972 to 1975, by a series of papers on the velocity-distance relation based on new redshifts and apparent magnitudes of galaxy clusters measured at Mount Wilson and Palomar (Sandage, 1999, Table 1 for a summary).
Non-linear models in the second category are more difficult to disprove because the deviations from the pure Hubble linear flow are much smaller than in the radical first group and can easily be mocked by systematic distance errors due to bias effects. The literature is large on deviations from a pure Hubble flow, either due to local streaming motions or to a variation of the Hubble constant outward, or to a local bulk motion relative to a globally significant distant kinematic frame. Some are easier to disprove than others.
One such non-linear model assumes that the local global distribution of matter is hierarchical. Following Charlier (1908, 1922) and using a suggestion by Carpenter (1938) of a density-size relation for all objects in the universe, de Vaucouleurs (1970, 1971) postulated a universe made of hierarchies of decreasing mean density with increasing volume size up to some limiting distance. The velocity-distance relation in such a universe was formulated by Haggerty (1970), and Haggerty & Wertz (1971), following a prediction of Wertz (1970), and was found to be nearly quadratic locally, but becoming linear at large distances. The model was shown, however, to be irreconcilable with observations (Sandage, Tammann, & Hardy, 1972).
It was early demonstrated (e.g. Sandage & Tammann, 1975; Teerikorpi, 1975a, b, 1984, 1987; Fall & Jones, 1976; Bottinelli et al., 1986, 1987, 1988; Sandage, 1988, 1994; Federspiel et al., 1994) that the claimed changes of the Hubble constant outward were often caused by uncorrected observational selection bias (see also Sandage, 1994, 1995, Chapter 10).111It is important to emphasize that bias of this nature is not the famous Malmquist bias, but rather is an incompleteness bias that increases with distance. In contrast, the Malmquist bias is distance independent. It only concerns the error made in assigning a number to an absolute magnitude calibration of a distance indicator when using a sample that is magnitude, rather than, distance limited. On the other hand, an incompleteness bias causes an error that increases with distance, which, if uncorrected, makes the Hubble constant appear to increase outward with distance. The error of calling the incompleteness bias as Malmquist is wide spread in the literature. It must also be stated that in the early papers some of the claimed distortions of the velocity field were due to the omission of velocity corrections for Virgocentric infall and – for the more distant galaxies – for CMB dipole motion.
Hence, despite many papers and conferences on proposed streaming motions and searches for variations of the Hubble constant with distance, the problem is still open. What has been needed are distance indicators that have very small intrinsic dispersion so as to eliminate, or greatly reduce, the effect of distance-dependent incompleteness selection bias. At small distances the increasing number of Cepheid and TRGB distances becomes most helpful here, whereas for large distances Type Ia supernovae at maximum light have emerged as the best standard candles, just as Zwicky (1962) had proposed.
1.2 The Complications: The Invisible World Map Must be Inferred from the Visible World Picture
The concept of linearity of a velocity-distance velocity field, so simple to describe, is most complicated to define properly in an expanding universe. Milne (1935) proposed language that clarifies the problem. Robertson (1955) also uses the same language.
The problems are these.
(1) Because we do not observe the universe at large redshift at the same cosmic time as at low redshift, we must distinguish between what Milne called the world map and the world picture. The world map is the state of the universe at a given cosmic time. The world picture is what appears to us. We cut the series of world maps at different cosmic times as we look to different redshifts.
By a linear “velocity”-“distance” relation is meant that at a particular cosmic time there is a linear relation in the world map between the coordinate distance as measured by the metric, and redshift. But the metric distance, , where is the time dependent expansion scale factor and is the invariant (constant for all time) comoving radial metric “distance”. It is not the same as a distance measured by an astronomer using observational data. There are many kinds of such “astronomical” distances, depending on the method by which they are measured. There is the distance when light left a galaxy, the distance when light is received, the luminosity distance by apparent magnitude, the distance by angular size, the round-trip distance by radar signals. All differ at large redshifts, and are the same only in the zero redshift limit. McVittie’s (1974) discussion is useful here. Which distance do we use in formulating a velocity-“distance” relation and proving that it is “linear”?
There is also the difficulty with “velocity”. What we measure is redshift, not velocity. The two are not the same except, again, in the zero redshift limit (Harrison, 1993).
The problem is solved by not using the complicated concepts of velocity and distance but by transforming the world map into the observer’s world picture using only observables. Before 1958 this mapping was done by making a Taylor series expansion of the expansion factor about the present cosmic time so as to sample the world map at the earlier cosmic times (Robertson, 1955). This could be called a tangent mapping, and is not very useful for redshifts larger than those at moderately local distances. What was needed was a general transformation mapping that is valid for all redshifts.
Mattig (1958) solved the problem with his famous equation that relates the metric distance of a galaxy, , at the time of light reception with the redshift, no matter how large, in models with zero cosmological constant. Metric distance is further replaced by apparent magnitude by the Robertson (1938) equation that connects the two. In addition to the apparent magnitude and the redshift the equation contains the Robertson (1955) deceleration parameter, , which, in the simplest models with no cosmological constant, is determined by the mean matter density of the model. In that case the values of and observed at the present epoch are used to parametrize the past and the future of the world map.
The Mattig equation, or more complicated versions for models that incorporate the cosmological constant (e.g. Mattig, 1959; Carroll et al., 1992) which we use in the next section, provides the connection between the world map and the world picture. It has properly been said that the Mattig equation is “one of the single most useful equations in cosmology as far as observers are concerned” (Peacock, 1999, p. 89). Mattig’s solution began the modern era of practical observational cosmology and has been used for many auxiliary and related problems concerning such observational data as galaxy counts, angular diameters, and others throughout the past 50 years.
Because the world map defined in the Robertson-Walker metric has a well defined linear relation between coordinate (metric) distance and redshift, and because a Mattig-like equation transforms the map in to the observed picture, the test for linearity becomes one of comparing the observed redshifts at a given apparent magnitude with the predicted redshifts from a model. The linearity test becomes, then, a search for residuals in the subtraction of the redshifts predicted from the model from the observed redshifts at a given photometric distance obtained from the observations as . Streaming motions and/or variations of the Hubble constant outward are searched for as correlations (or not) of the residuals with direction and photometric distance.
The test for linearity is, then, model-dependent: we must compare the observed redshift-magnitude relation with the prediction for some adopted world model as it is transformed into the world picture by a Mattig-like equation of . We can only test linearity relative to the adopted model. We test for the sensitivity to the adopted model in § 3.
1.3 This Paper
The purpose of this paper is: (1) To test the linearity of the local expansion field within . Beyond this limit the linearity of the expansion of space is well documented out to by the SNe Ia of Hicken et al. (2009), which have ample overlap with the present data, and which can be tightly fit to the SNe Ia compiled by Kessler et al. (2009) extending to . The high- data are essential to optimize the determination of the world model for which linear expansion is valid. But at smaller distances the character of the expansion field is still poorly known because so far the number of objects with sufficiently accurate distances has been small. Yet the test is important to understand the effect of the observed clumping of visible matter on the local dynamics. It is also important to find the minimum distance at which the cosmic value of can be found independent of peculiar velocities. Strong local deviations from linearity have in fact frequently been claimed up to the recent past by Zehavi et al. (1998) and Riess et al. (2009). (2) To determine the size of the comoving volume that partakes of our observed velocity relative to the dipole of the CMB.
The plan of the paper is this. In § 2 the data are specified. In § 2.1 accurate relative distances of 246 SNe Ia and 35 clusters within the adopted distance range are compiled from eight different sources. The distances have demonstrably rms errors of ; only relative distances are needed in the present context. The distances on an arbitrary zero point, reduced to the barycenter of the Local Group, are listed in Table 1 together with the appropriate velocities , (corrected for Virgocentric infall), and (corrected for motion with respect of the CMB dipole if ). In § 2.2 30 Cepheid and 176 TRGB distances which are equally accurate as those of SNe Ia are added in order to extend the sample down to . They are reduced to the barycenter of the Local Group and corrected for the Virgocentric flow as in § 2.1. We justify in § 2.3 why other distance indicators are not considered here.
In § 3 the problem of linear expansion is set out. The actual test in § 3.1 uses a Hubble diagram of all objects in the sample and analyzes the residuals from a Hubble line for a standard CDM model with and . (Note that this model implies a deceleration parameter of because it holds that for all Friedmann models [e.g. Sahni & Starobinsky 2000]). § 3.2 explores the dependence of linearity on the adopted model in terms of .
An analysis of the velocity residuals of objects with (the limit is set to avoid an overwhelming effect of distance errors) in function of direction is in § 4, showing the size of the Local Supercluster and its motion toward , which is the direction of the warm pole of the CMB after correction for our Virgocentric velocity vector.
Results and conclusions are in § 5.
2 THE DATA
In order to trace the local expansion field the most accurate relative distances are compiled of objects, comprising SNe Ia, clusters, Cepheids, and tip of the red-giant branch (TRGB) distances, with velocities from to .
All quoted distances are reduced to the barycenter of the Local Group (LG) which is assumed to lie on the line between the Galaxy and M31 and at a distance of one third of . The small random error of the distance moduli ( on average as shown below) makes the samples unusually insensitive to incompleteness bias.
Heliocentric velocities are available for all objects. They are reduced here to the barycenter of the LG following Yahil et al. (1977). The resulting velocities, , are then corrected for a self-consistent Virgocentric infall model by which is the vector sum of the infall vector at the position of the LG, (Peebles, 1976, 1980; Yahil et al., 1980a; Hoffman et al., 1980; Tonry & Davis, 1981; Dressler, 1984; Yahil, 1985; Tammann & Sandage, 1985; Kraan-Korteweg, 1986; de Freitas Pacheco, 1986; Giraud, 1990; Jerjen & Tammann, 1993) and the infall velocity of a particular object, both projected onto the line of sight between the observer and the object. The center of the Virgo cluster is taken to coincide with NGC 4486 at , . The infall vectors scale with Virgocentric distance like if a density profile of the Local Supercluster of is assumed (Yahil et al., 1980b). Since good (relative) distances are known for all objects including the Virgo cluster, the corrections can be calculated from equation (5) in Sandage et al. (2006). The velocities would be observed in the absence of any streaming towards the Virgo cluster center and if the infall model were exact, but deviation from the model (see e.g. Klypin et al., 2003) will add to the true peculiar velocities of local galaxies. The velocities of only the objects with are in addition corrected by ( being the angle from the CMB apex to compensate for the reflex of the Local Supercluster motion relative to the CMB [see § 4]).
2.1 SN Ia and Cluster Distances
Eight published sets of accurate relative distances that contain more than 10 SNe Ia or clusters are considered here.
Six sets are based on SNe Ia. Since SNe Ia are treated as standard candles it makes no difference whether their distance measures are published as corrected apparent magnitudes at maximum or as distance moduli. In either case the data are converted to “true” distance moduli by forcing each data set to give the same fixed mean value of . We have chosen here [km sMpc-1] as found from Cepheid-calibrated SNe Ia (Sandage et al., 2006; Tammann et al., 2008b). As mentioned before the absolute calibration is not necessary for the present investigation, but a realistic calibration will simplify some of the following discussions.
Two sets of relative cluster distances expressed in yield equally tight Hubble diagrams as SNe Ia. This is thanks to the large number of galaxy distances determined in each cluster. The mean cluster distances are normalized to the same fiducial value of .
The objects in each data set are separately plotted in Hubble diagrams vs. in Figure 1a-g. The Hubble line shown holds for the adopted CDM model with , and is defined by (Carroll et al., 1992)
| (1) |
The scatter about the Hubble line () is shown in each panel. The values refer to the velocity range of where they are least affected by peculiar motions, -corrections, and photometry at faint levels.
The sources of the eight samples – all normalized here to the fiducial value of – are detailed in the following:
(1) Maximum magnitudes are available for 105 Type Ia supernovae (SN Ia) (62 of which fall into the fiducial range ) from Reindl et al. (2005), excluding spectroscopically peculiar objects of type SN 1991T and 1991bg. They have been corrected for Galactic and internal absorption and homogenized as to decline rate and intrinsic color. The corresponding distances yield the Hubble diagram in Figure 1a.
(2) Wang et al. (2006) give corrected distance moduli based on maximum magnitudes and some adopted standard luminosity of 98 SNe Ia (55 of which fall into the fiducial velocity range). The magnitudes are corrected for absorption and homogenized as to decline rate and color index with somewhat different precepts as under (1). Their published SN magnitudes are brighter than in (1) because the intrinsic color of SNe Ia was assumed to be improbably blue causing large absorption corrections, but this does not disturb the internal consistency of the data. The data give the Hubble diagram in Figure 1b.
(3) Jha et al. (2007) have derived homogenized, absorption-corrected maximum magnitudes of 95 SNe Ia (72 of which fall into the fiducial velocity range) by fitting multi-color light curves to templates. The SNe Ia are plotted in Figure 1c.
(4) Maximum magnitudes of 33 SNe Ia (of which 26 fall into the fiducial velocity range) have been published by Wood-Vasey et al. (2008). They provide, without any homogenization for decline rate or color and with only insignificant absorption corrections, the Hubble diagram shown in Figure 1d.
(5) Maximum magnitudes, corrected for absorption and decline rate, for 21 SNe Ia (of which 19 fall into the fiducial velocity range) have been published by Freedman et al. (2009). The data have been added in Figure 1d.
(6) Hicken et al. (2009) have reduced SN data for a very large sample of SNe Ia in four different ways. Two methods follow Guy et al. (2005, 2007) and two methods follow the multi-color light curve fitting of Jha et al. (2007) with two different assumptions on the absorption-to-reddening ratio for SNe Ia ( and 1.7). The authors give distance moduli for all four cases on the assumption of . We have selected the 91 SNe Ia of 2001 and later in the range of for which we could find the parent galaxy, position, and a sufficiently accurate redshift in the NASA/IPAC Extragalactic Database (NED).222See http://nedwww.ipac.caltech.edu. For two SNe Ia (2002es and 2007qe) the available redshifts are discrepant; they are left out as well as the two deviating SNe Ia (2002jy and 2007bz) leaving 87 SNeIa. Their Hubble diagrams based on the reduction methods of Guy et al. have significantly larger scatter () than those following the method of Jha et al. We have adopted therefore the latter taking the mean of the moduli from and 1.7. These means, normalized to the present distance scale, are used to construct the Hubble diagram in Figure 1e.
(7) Masters et al. (2006) have derived relative mean cluster distances (in ) from 21cm line width distances of 26 member galaxies per cluster on average. Their sample of 31 clusters defines a tight Hubble diagram with the exception of the three nearest clusters (not shown) whose relative distances have been measured too large (see Tammann et al., 2008a). The reason for the discrepancy, seen already in the preceding work of Giovanelli et al. (1999), is not understood; it is apparently not possible to apply the same selection criteria for cluster members in nearby and distant clusters. The remaining 28 cluster distances, normalized as before, are shown in Figure 1f.
(8) Jørgensen et al. (1996) have determined relative distances (in ) of 10 clusters by averaging Fundamental Plane (FP) distances of about 23 galaxies per cluster. The sample is small, but it provides one of the few (relative) distance determinations of the Coma cluster. The Hubble diagram with the normalized cluster distances is in Figure 1g.
The sources (1)–(8) contain 502 entries for 246 different SNe Ia and 35 clusters and groups. The distance of objects with more than one entry have been averaged. The relevant parameters of the 281 objects are listed in Table 1.
The columns that need explanation are these: Columns (4) and (5) are the Galactic coordinates. Columns (6), (7), and (8) are the velocities relative to the Sun taken from the NED (Col. 6), the velocities corrected for the self-consistent Virgocentric infall model (Col. 7), and – in case – the velocities corrected to the inertial frame of the CMB as explained above (Col. 8). Column (9) is the distance modulus with the zero-point set as before by . Note that the moduli are given relative to the barycenter of the LG. Column (10) is the angle in degrees from the adopted CMB apex . Column (11) is the difference between the velocity and the model velocity predicted by equation (1) using the adopted distance moduli from Column (9). Column (12) gives the key to the original sources. 1: Reindl et al. (2005); 2: Wang et al. (2006); 3: Jha et al. (2007); 4a: Wood-Vasey et al. (2008); 4b: Freedman et al. (2009); 5: Hicken et al. (2009); 6: Masters et al. (2006); 7: Jørgensen et al. (1996).
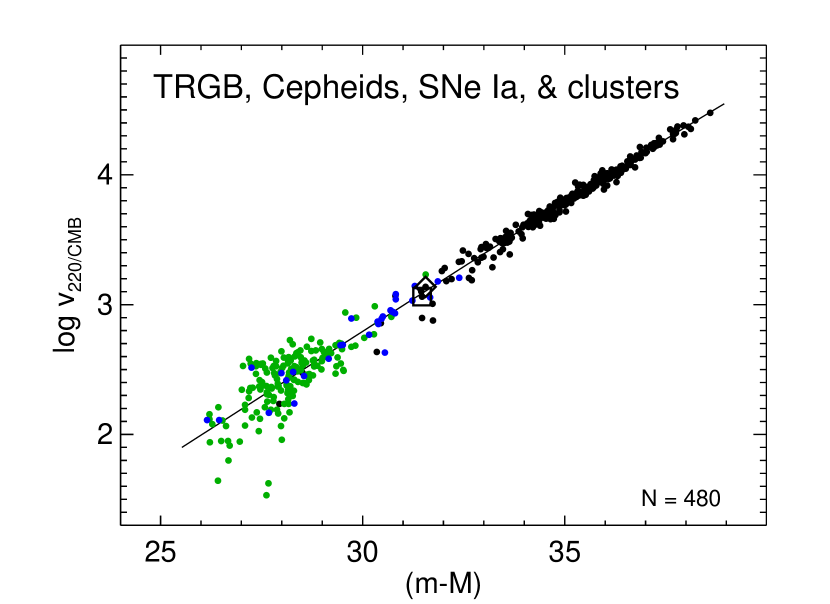
The 281 mean distances in Table 1 define the Hubble diagram in Figure 1h. The subset of 218 objects which fall into the interval scatter about the Hubble line by , which must be due in part to distance errors and to peculiar velocities.
The systematic distance difference of those SNe Ia occurring in at least two of the above sources is zero by construction. Their mean random differences are given in Table 2. The overall average difference is which implies a mean error of a single distance determination of . If this value is subtracted in quadrature from the scatter of observed in Figure 1h one is left with an error, read in velocity, of or 5%, which corresponds to a radial velocity dispersion of at and in three dimensions. The value compares well with the peculiar velocity of the Local Supercluster of toward the CMB apex (see § 4).
It is central to this paper to note that the free-fit linear regressions in the Hubble diagrams of Figure 1a-h in the well occupied range of , with the slopes set out in Table 3, are flatter than the canonical value of 0.2 in six out of seven cases; the mean slope is flatter by . The reason concerns the difference between the world picture seen in the data and the world map as derived by the Mattig (1958) transformation between them to be described in § 3.
2.2 The Extension of the Hubble Diagram to Smaller Distances
2.2.1 Cepheids
The uniformly reduced Cepheid distances of 30 galaxies with were compiled in Tammann et al. (2008b). They are, after exclusion of the deviating NGC 3627, plotted in Figure 2 where also the objects of Figure 1h are repeated.
The Cepheids can be added directly to the Hubble diagram of SNe Ia and clusters, because they all share the same zero point of the distance scale. This is by construction, because 10 of the Cepheid distances were used in Sandage et al. (2006) as the only luminosity calibrators of SNe Ia. The agreement is confirmed by the statistical equality of from only the 29 Cepheids () by Tammann et al. (2008b) and the value derived from the SNe Ia () by Sandage et al. (2006).
2.2.2 TRGB distances
The 78, through RR Lyr stars independently calibrated TRGB distances with yield a quite local value of (Tammann et al., 2008b). The close agreement of this value with the fiducial value of 62.3 is taken as justification to plot all 176 TRGB distances outside the LG into Figure 2 without any additional normalization. The combination of the SNe Ia and clusters in § 2.1 with the Cepheids and TRGB distances here defines the Hubble line in Figure 2 from the lowest recession velocities up to .
It could be objected that the fit of the galaxies with TRGB distances to the more distant objects depended solely on the similarity of the respective values of , but that the agreement was only the product of chance. Proponents of a high large-scale value of are actually forced to argue in this way. To answer this objection we have fitted separately the Hubble lines of the TRGB objects and that of the Cepheids and SNeIa in the region of overlap, i.e. . (The lower limit is chosen as elsewhere in this paper to avoid a dominant effect of peculiar velocities). The 29 Cepheids and 19 SNe in this interval fix the intercept of the Hubble line to within and the 78 TRGB distances in the same interval to within . Joining the two samples leaves therefore an uncertainty of , corresponding to a distance margin of (or 4% in linear distance). Without taken regress to the actual value of , the change of between the very local value from TRGB distances and the value on larger scales from Cepheids and SNe Ia can therefore be limited to .
2.3 Other Hubble Diagrams of Field Galaxies and Clusters
Different methods to determine the distances of field galaxies have been applied to map the velocity field. They are struck by random distance errors of (except field galaxies with SNe Ia) which causes severe statistical problems unless one has complete (or fair) distance-limited samples. Since it is not possible to define such samples much beyond the methods have been applied to apparent-magnitude-limited samples. In this case the less luminous galaxies are increasingly discriminated against as one progresses to larger distances. The result is that the mean luminosity of the catalogued galaxies increases with distance (incompleteness bias). If this effect is not allowed for one derives a compressed distance scale with seemingly increasing with distance. This then can lead to spurious peculiar velocities and galaxy streamings. Of course other reasons for distance-dependent biases exist, e.g. if the distance indicator depends on resolution or if it depends on galaxy size. In all cases deviations from linear expansion increasing systematically with distance are a sign of some kind of bias.
The problem of bias in the presence of large scatter is discussed for the following four examples.
2.3.1 The Hubble diagram from 21cm and optical line width distances of spirals
A Hubble diagram of a complete distance-limited sample of 104 field galaxies, yet extending out to only , has been constructed with 21cm line width distances (Tammann et al., 2008b, Fig. 3a). The slope of the Hubble line is consistent with 0.2, but the very large scatter of – much too large to be caused by peculiar velocities – prevents a rigorous test for linear expansion. Also an early magnitude-limited sample of 217 field galaxies has been presented by Aaronson et al. (1982). Combining 21cm line widths with magnitudes they have derived distances which – if cut at – define a Hubble line consistent with a slope of 0.2, but the error is substantial due to the large scatter.
Federspiel et al. (1994) have analyzed a magnitude-limited sample of 1355 galaxies out to for which Mathewson et al. (1992) have collected 21cm and optical line widths and corrected magnitudes. The galaxies, lying in two fields towards and perpendicular to the Great Attractor, define Hubble diagrams with dispersions of depending on line width, and which clearly reveal incompleteness bias by producing slopes significantly larger than 0.2. On the assumption of linear expansion the bias has been corrected out by means of so-called Spaenhauer-diagrams. The corrected distances show a local velocity anomaly in the direction of the Great Attractor of which, however, levels off at a distance of . The conclusion was that there is no streaming extending to the Great Attractor at .
In order to beat the large intrinsic dispersion of line width distances and the accompanying incompleteness bias very large all-sky samples of several thousand field and cluster galaxies have been studied (Springob et al., 2007, 2009; Theureau et al., 2007) and will be further increased in the future(Masters, 2008).
2.3.2 Hubble diagrams from D and FP distances of early-type galaxies
Faber et al. (1989) have derived D distances (in ) of 317 E and S0 galaxies out to . The corresponding Hubble diagram has a scatter of , which is reduced to by correcting for what the authors call “Malmquist correction”, but which is actually a correction for the population size of the aggregate from which a galaxy is drawn. In their Table 4 they list mean distances of 59 clusters and groups and distances of 58 single galaxies which define the Hubble diagram shown in Figure 3. The scatter is still large () and the slope () is flatter than the expected value of . This implies that if is assumed to be at it decreases to at . The decrease of is contrary to what is expected from an incompleteness bias; it may be that the specific “Malmquist correction” of the authors leads to an overcorrection of the distances.
All of Faber’s et al. (1989) galaxy distances were analyzed in a number of publications some of which preceded the paper by Faber et al. (e.g. Dressler, 1987; Faber & Burstein, 1988; Lynden-Bell et al., 1988; Faber et al., 1988; Burstein, 1990). The authors, taking the distances at face value, concluded that a coherent large-scale influx existed into a group of galaxy clusters centered on Abell 3627, called the “Great Attractor”, at a distance of , whose dominant attraction would be the main cause for the Local Group’s motion with respect to the CMB. – First doubts about the rôle of the “Centaurus Concentration” (synonymous for Great Attractor) came from Lynden-Bell et al. (1989), who concluded from the optical dipole from galaxy catalogs that most of the Local Group’s motion is caused from within and that the more distant cluster concentration about Abell 3627 was only a minor contributor. Additional evidence for this view is given in § 5.
Mean Fundamental Plane (FP) distances of 85 clusters with have also been derived by Colless et al. (2001), but they are based on average on only cluster members. The resulting Hubble diagram has a large scatter of and the Hubble line has too flat a slope (). For these reasons the data have not been used for the linearity test.
2.3.3 The Hubble diagram from surface brightness fluctuation (SBF) distances
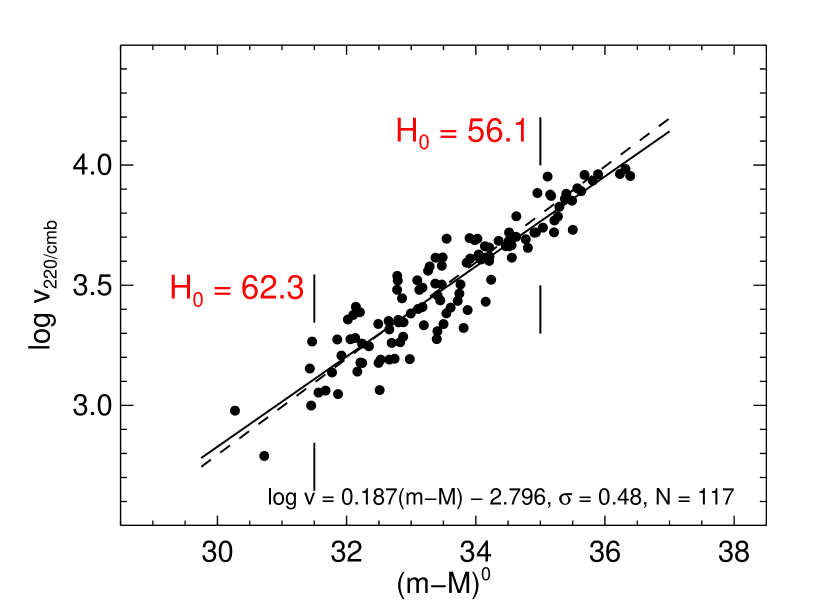
SBF distances of 124 mainly E and S0 galaxies have been published by Tonry et al. (2001). Their Hubble diagram is shown in Figure 4. The scatter of is large; even for this relatively nearby sample () only part of the scatter can be attributed to peculiar motions. Yet the most striking is the steepness of the Hubble line with slope 0.233; it implies values of at and of at . The seeming non-linearity of the expansion field is impossible and must be due to some bias of the data, which may be caused by a selection effect depending on apparent-magnitude (incompleteness bias) or some other distance-dependent bias of this sensitive method (perhaps due to incomplete removal of non-stellar images). The consequence is that the method should not be used to test the character of the expansion field nor for the determination of reliable galaxy distances.
2.3.4 The Hubble diagram of planetary nebula (PNLF) distances
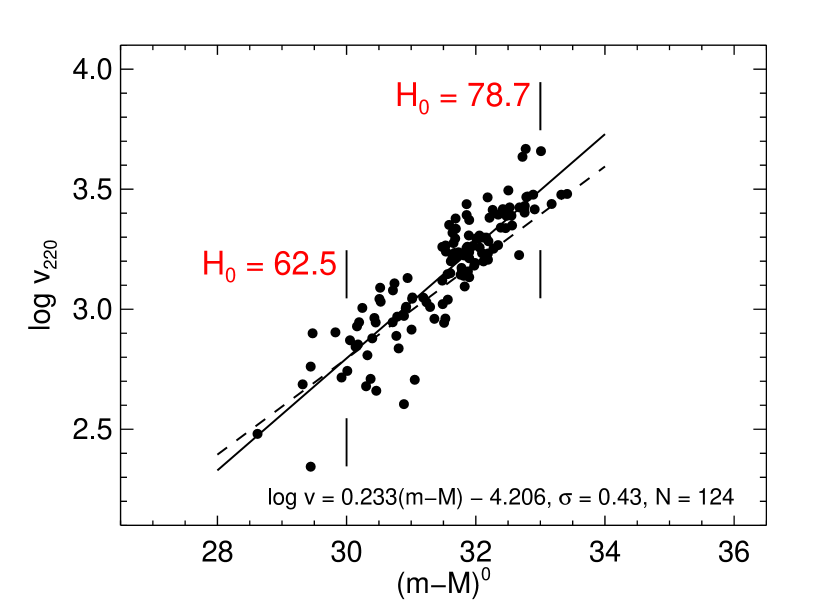
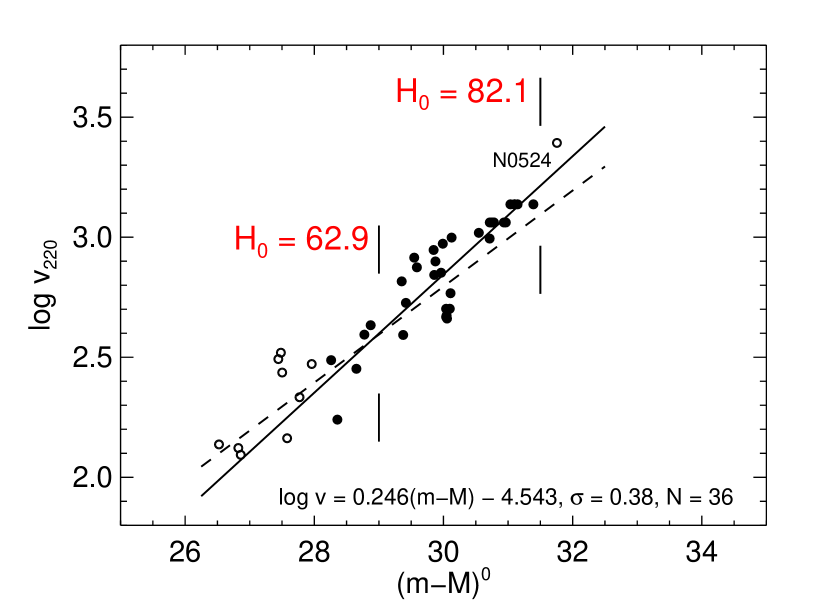
Galaxy distances derived from the bright tail of the luminosity function of the shells of planetary nebulae in the light of the Å line have been compiled from Ciardullo et al. (2002), Feldmeier et al. (2007), Herrmann et al. (2008), and the NED. Of the resulting galaxies 46 lie outside the LG. They define a Hubble diagram as shown in Figure 5. A free fit through the 36 points beyond (omitting NGC 524 with only a lower limit to its distance) leads to a Hubble line with large scatter () and very steep slope. The non-linearity is so pronounced that increases from 62.9 to 82.1 as one goes from to 31.5! The reason may be that the brightness of the brightest planetary nebulae depends on galaxy size (Bottinelli et al., 1991; Tammann, 1993). Whatever the reason, the luminosity function of planetary nebulae is not a useful distance indicator.
3 THE TEST FOR LINEARITY OF THE LOCAL EXPANSION FIELD
As said at the end of § 1.2, the test for linearity – the test if is or is not a function of distance in the world map – is model-dependent because it depends on transforming the world picture into the world map. This can only be done by using the scale factor which depends on the model, and by taking account of the streaming motions where they exist.
The problem and its evident degeneracy is illustrated by the deviation of the slopes in Table 3 from which is the value if the world map describes a homogeneous and isotropic universe in the mean. The naive interpretation of the mean slope of would be that the Hubble constant decreases outward such that if locally at say , then the value at would be 58.0.
However, such a conclusion is incorrect. It ignores the transformation of the world picture into the world map via a Mattig-like equation where a second parameter is required in the theoretical, model dependent equation for the Hubble diagram.
We test first in § 3.1 for linearity in case of a fixed value of and then investigate in § 3.2 the range of for which linearity cannot be excluded using only the local data with .
3.1 The Test for Linearity Using a World Model with
In a first step of the linearity test we adopt the values of the “concordance model” of , , which corresponds to .
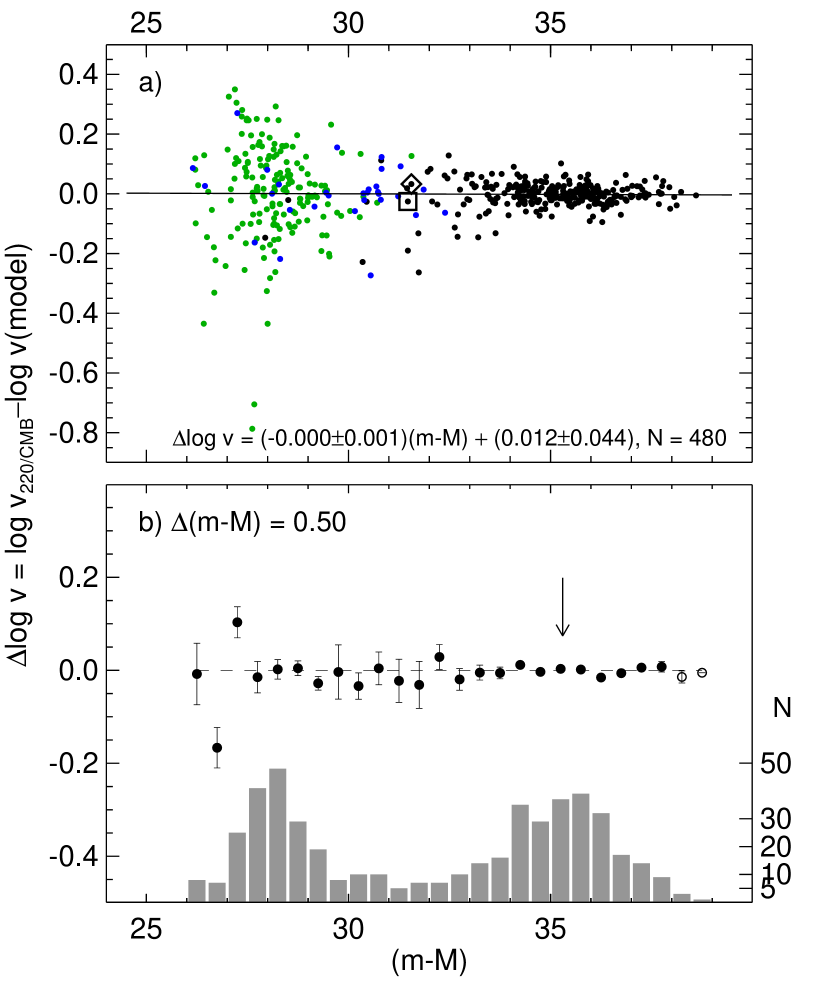
The velocity residuals of the objects in Figure 2 from the Hubble line calculated with equation (1) are plotted against the adopted distance moduli in Figure 6a. The scatter of the residuals increases towards smaller distances due to the relatively larger contribution of peculiar motions to the recession velocities. The distribution of the points is as flat as can be expected, giving a slope of . This implies that the value of remains constant to within over a modulus interval of , corresponding to a distance factor of 100.
In order to test for local distance-dependent variations of the data of Figure 6a are averaged per bins of width and shown in Figure 6b. The 21 averaged residuals between and 38.0 are about normally distributed and have an average rms deviation of from the adopted horizontal line, which restricts the local variations of to on average. Individual intervals with 10 or less objects deviate by up to 7%. Shifting the boundaries of the bins does not change this result.
Earlier suggestions of to decrease gradually by 5% out to (Tammann, 1999) cannot be maintained in the light of the present, much increased data, which also deny the so-called “Hubble Bubble”. This feature was proposed as a drop of by beyond a distance of (corresponding to in the adopted distance scale) by Zehavi et al. (1998) and Jha et al. (2007). This drop has been taken as support for a local overdensity and for a dark-energy-free cosmology (Wiltshire, 2008). Yet Giovanelli et al. (1999), Conley et al. (2007), and Hicken et al. (2009) have questioned the result as we do here. Indeed comparing the bin in Figure 6b just preceding the break with the one following the break – either bin containing more than 30 objects – shows the more distant bin to lie higher by or to be larger by . This rejects the Hubble Bubble at the level of 4 sigma. – It is also noted that the five intervals within and the five intervals within , embracing the break point and comprising a total of more than 100 objects each, give an increase of with distance of instead of the putative decrease of . This rejects a persistent decrease of at an even higher level of significance.
3.2 The Model Dependence of the Linearity Test
It is interesting to ask for the sensitivity of the test for linearity for a range of world models.
3.2.1 The linearity test for different values of
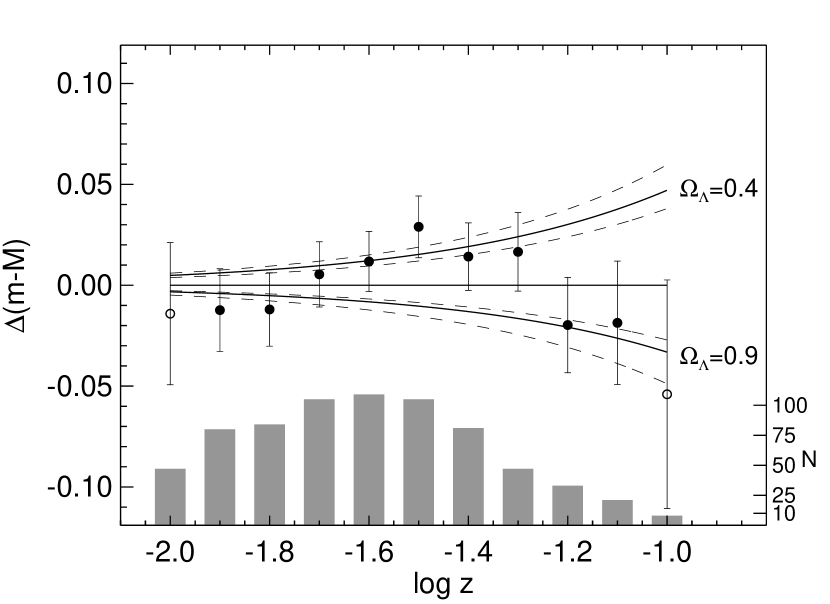
We first consider two flat CDM models with rather extreme values of () = (0.6, 0.4) and (0.1, 0.9) corresponding to and , respectively. The differences between the moduli for the two trial models from equation (1) and the moduli for the standard model under § 3.1 are listed in Table 4, Columns (3) & (4) for various values of . The differences are shown as smooth curves in Figure 7, where the differences are plotted against . Also shown are the mean values of of all objects in Figure 6 averaged over intervals of and plotted in steps of . The conclusion is that the averaged data points at larger distances fit reasonably within the boundaries of the two trial models. This means that linearity holds for all flat models with parameters between the two trial models. The weak restriction on the parameter space is no surprise in view of the short leverage in of the data used.
3.2.2 The linearity test for different values of
We now relax the condition of a flat model and specify the trial models only by . For this purpose we recall the derivation of the theoretical Hubble diagram of vs. apparent magnitude using a standard candle in various homogeneous, isotropic universes.
Robertson’s (1938) equation that relates the apparent luminosity, , with the metric distance at the present instant of cosmic time is
| (2) |
where is the absolute luminosity and is the metric distance where is the constant (for all time) dimensionless metric distance, and is given by the Mattig solution (for ) as
| (3) |
Combining equations (2) and (3) gives the equation for the theoretical Hubble diagram to be
| (4) |
where contains the Hubble constant and the intrinsic mean absolute magnitude of the distance indicator.
The series expansion of equation (4), is
| (5) |
For small values of equation (5) is also valid if . The effect of the third term is for and .
The values of are calculated from equation (5) for four trial values of , and and for various values of . Subtracting from these values the modulus resulting from and the corresponding values of , one obtains the values listed in Table 4 (Col. 5-8) and shown in Figure 7 as smooth dashed lines. As in § 3.2.1 the more distant data points lie within the boundaries for and . The conclusion is that is probably negative irrespective of the value of .
3.3 The Linearity of the Expansion at Large Scales
If linear expansion – albeit for a considerable range of parameters – was found in the foregoing from a sample arbitrarily cut at (), there is sufficient overlap with other SN Ia samples extending to higher redshifts to carry the linearity test to (§ 1.3).
4 THE SIZE OF THE VOLUME CO-MOVING TOWARDS THE CMB APEX
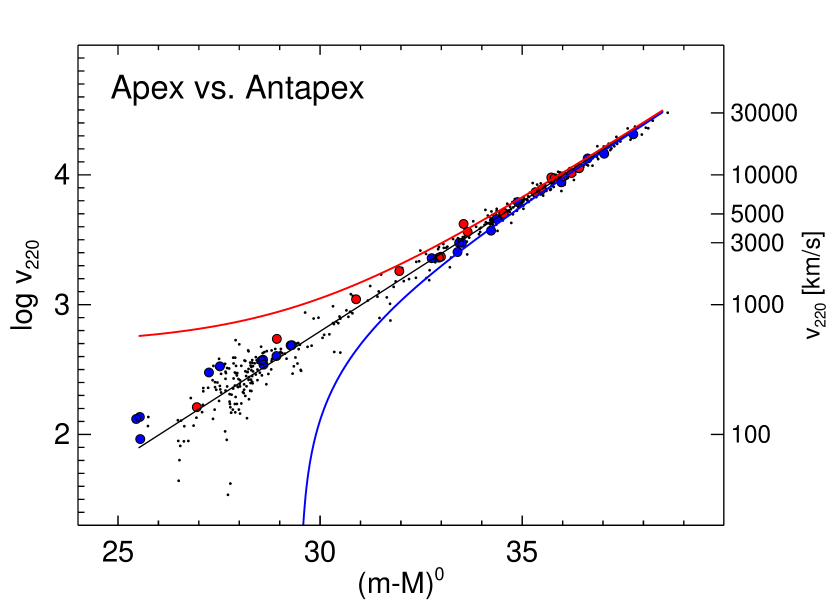
As evidenced by the dipole of the CMB radiation the LG partakes of a bulk motion in addition to the Virgocentric vector. The dipole, first received with disbelief, was discovered by Henry (1971), Corey & Wilkinson (1976), and Smoot et al. (1977). After attempts to explain the dipole as a primordial effect (Gunn, 1988; Paczynski & Piran, 1990) it soon became clear that it could be caused only by a local motion which, seen from the Sun, amounts to towards the observed apex at , (Bennett et al., 1996; Hinshaw et al., 2007) or, if translated to the barycenter of the LG following Yahil et al. (1977), to towards , . Subtracting the Virgocentric infall vector from one obtains a velocity of the LG of towards the corrected CMB apex at , (cf. also Sandage & Tammann, 1984). It was clear from the beginning that a velocity of such size must comprise a very large volume including the Virgo cluster and extending to at least because otherwise two galaxies at roughly equal distances in the apex and antapex direction would differ in redshift by ! The conclusion is that the whole Local Supercluster moves more or less coherently towards the CMB apex.
Figure 8 shows the aspect of the Hubble diagram if the Galaxy were the only object moving towards the CMB pole with a velocity of . In that case all other nearby galaxies, being at rest in co-moving coordinates with respect to the CMB, would exhibit large peculiar motions as seen from the LG and fill the Hubble diagram within the wide curved envelopes as shown in the Figure. The assumption, besides being unphysical, is clearly contradicted by the concentration of the observed galaxies (repeated from Fig. 2) towards the center line of the diagram. Most galaxies within say must share the CMB motion of the Galaxy. Beyond this point the diagram loses its diagnostic power because the vector of is drowned in the recession velocities of more distant galaxies and in the natural scatter.
The convergence radius of the Local Supercluster, i.e. the distance where field galaxies merge into the inertial frame of the CMB has been determined by several authors, some of which are compiled in Table 5. The size and direction of the bulk motion from the different authors are not listed in Table 5, because some authors postulate additional velocity vectors on larger scales to explain the full CMB dipole motion. One of the reasons – besides systematic distance errors which always lead to large-scale motions – may be that they have not allowed for Virgocentric infall vectors and that they have compared their results with the CMB apex instead of (i.e. after correction of the local Virgocentric infall vector of ).
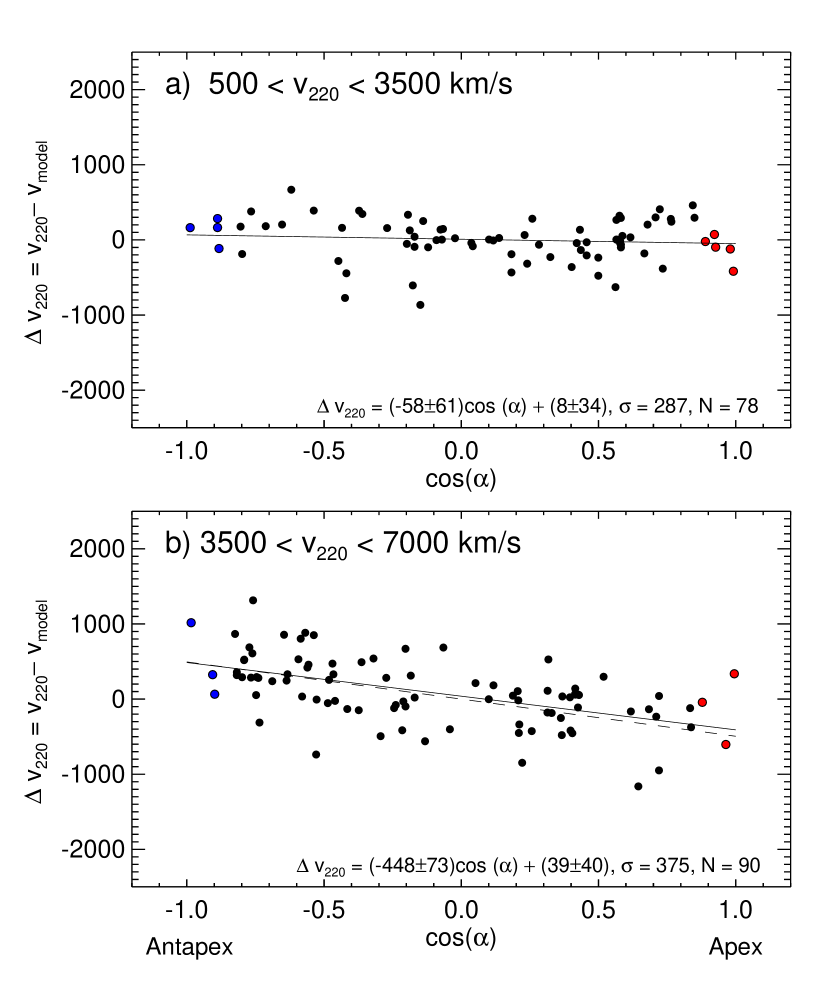
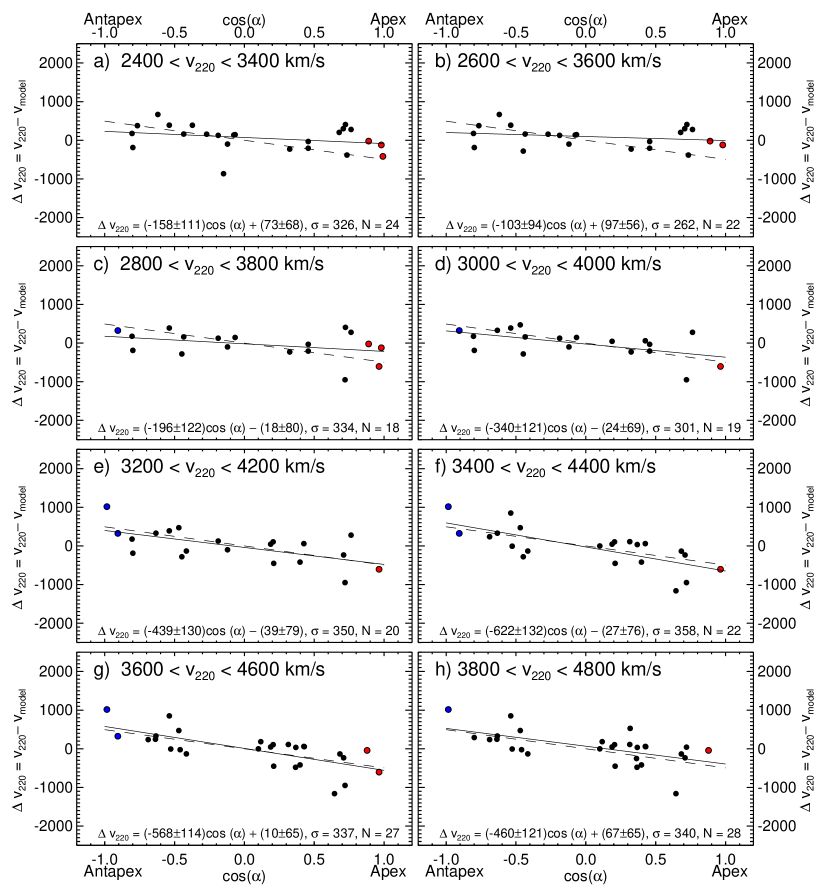
A direct determination of the size of the Local Supercluster and its bulk motion is obtained when one plots the velocity residuals from the Hubble line against the angle from the apex . Galaxies from Figure 2 are divided into two bins, and and their apex diagrams are shown in Figure 9a,b. The result is striking. The distribution of the nearer sample is flat and the more distant sample reflects a local peculiar velocity of in satisfactory agreement with the corrected CMB dipole motion of . Clearly the majority of galaxies within share the coherent bulk motion of the Local Supercluster, whereas the galaxies beyond this limit are in rest with respect to the inertial frame of the CMB.
The scatter in Figure 9b is significantly larger than in Figure 9a. This is because the distance errors of predict velocities with errors increasing with distances such as to overwhelm eventually the signal from streaming velocities. For this reason the apex diagrams should not be carried much beyond .
Aiming for a still better determination of the convergence length, the objects of Figure 9 in the range have been re-binned in intervals and are plotted in steps of in Figure 10. The nearer samples in panel a) and b) show already a marginal slope suggesting that the Local Supercluster begins to peter out at even smaller velocities (distances) than . Panel c) centered at support that conclusion at the level, while panel d) centered at shows a highly significant apex motion. Finally the more distant panels e)h) are fully consistent with the expected asymptotic apex motion of .
The conclusion is that the convergence distance is reached close to . The exact convergence distance depends presumably on direction, but for a corresponding test the large, yet still restricted sample is not adequate.
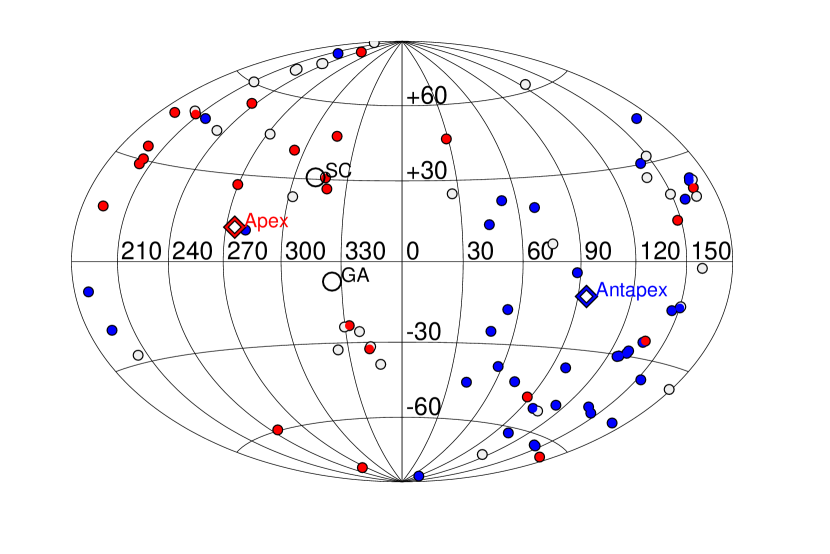
For visualization the 90 objects in Figure 9b (i.e. with ) are plotted in an Aitoff projection (Fig. 11). The association of the objects with positive and negative velocity residuals with their respective apices is striking. The eccentric position of the apices within their associated objects is due to the paucity of objects in the zone of avoidance. The lopsided distribution of the available objects about the apices is also the reason why we have not independently solved for the direction of the apex, but have taken the CMB dipole direction as given.
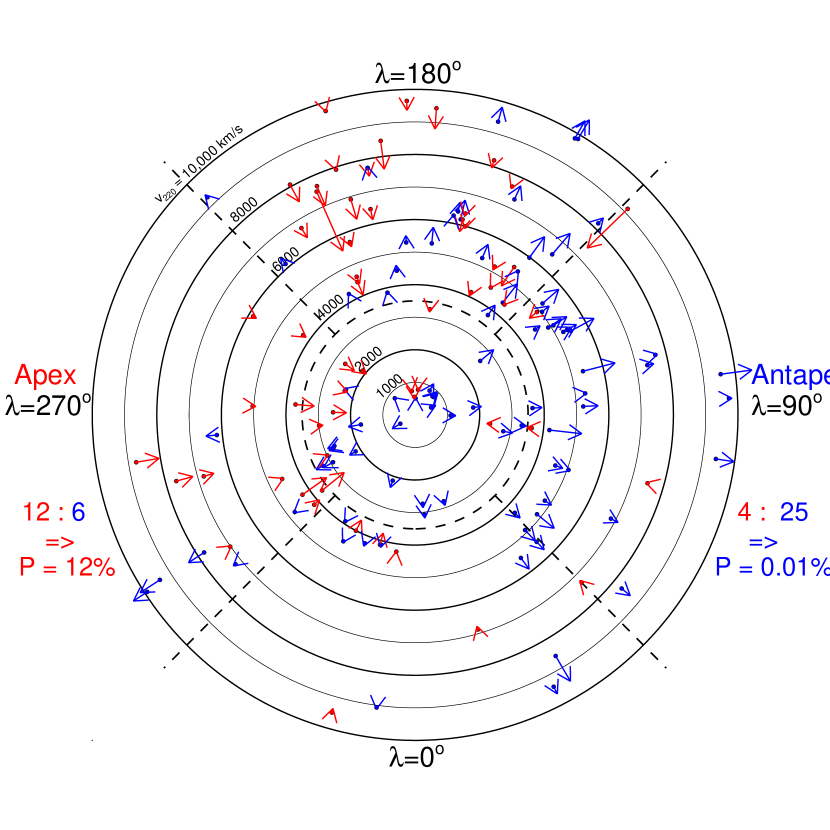
The flow pattern of the 144 sample objects with and is shown in Figure 12. Their distances and velocity residuals are projected on the “apex plane” which is tilted against the Galactic plane by and rotated such that the CMB apex has the new coordinates , . The objects within have small velocity residuals, whereas the more distant objects have larger velocity residuals on average. The distribution of the available objects beyond , although not forming a complete nor objectively selected sample, is far from random. Of the 18 objects in the sector about the apex direction 12 have negative and 6 have positive velocity residuals. The chance probability for this distribution is . Of the 29 objects in the corresponding sector about the antapex direction 25 have positive and 4 have negative velocity residuals. In this case the chance probability is only . The bulk motion of the Local Supercluster is hence reflected in Figure 12 at a high level of significance. Consistent with this is the nearly random distribution of the velocity residuals in the two perpendicular sectors about and .
5 RESULTS AND CONCLUSIONS
Exceptionally accurate relative distances are compiled from eight sources in § 2.1. They are based on SN Ia magnitudes and on mean 21cm line widths and the Fundamental Plane in case of clusters. They are normalized to an arbitrary value of of 62.3 without loss of generality. Accurate TRGB and Cepheid distances were added in § 2.2. The final Hubble diagram with 480 objects extends from 300 to and has a scatter of only (8% in linear distance) beyond ; the increase of the scatter at shorter distances, due to peculiar motions, is compensated by large-number statistics.
The expansion of space is as linear as can be measured after allowance is made for a Virgocentric flow model and for the CMB motion of the Local Supercluster. Over the range of 300 to the value of does not change systematically by more than . At poorly populated distances may locally vary by 7%. But the so-called Hubble Bubble suggesting a sudden decrease of by 6.5% – be it a local dip or a persistent feature beyond – at the particularly well occupied distance around is excluded by or more.
The question at which distance the cosmic value of can be found is answered by Figure 6: beyond (Mpc) and out to at least any systematic deviation from linear expansion is limited to a few percent. At the expansion field is well tied to the equally linear large-scale expansion field (e.g. Kessler et al., 2009). The cosmic value of can therefore be found quite locally if sufficient calibrators are available to compensate the locally important peculiar velocities. The available 78 TRGB distances outside yield a well determined value of (statistical error) in good agreement with local Cepheids and SNe Ia (Tammann et al., 2008a). Allowing for a error of the TRGB zero point, based on RR Lyr stars and other distance determinations, and for a generous variation of with distance of gives a compounded error of of (8%), including the statistical error. The discrepancy with values of (e.g. Riess et al., 2009) is not a subject of the present paper.
The Local Supercluster emerges as a comoving entity of radius , corresponding to a diameter of Mpc, with the Virgo cluster at its center and several additional clusters (UMa, Fornax, Eridanus) and a large number of groups which must induce a network of small peculiar motions not considered in this paper (see Klypin et al., 2003, for a map). Inside the Supercluster the expansion is decelerated about inversely to the distance from the Virgo cluster. The galaxies of the Supercluster are concentrated toward the supergalactic plane (de Vaucouleurs, 1956) which extends to at least (Lahav et al., 2000). It is to be noted that the CMB apex lies at supergalactic latitude , which shows that objects near to the plane (like the Great Attractor and the Shapley Concentration) can contribute only a fraction of the acceleration of the Local Supercluster.
The Supercluster’s reflex motion with respect to galaxies beyond amounts to in good agreement with the velocity of toward an apex in the zone of avoidance (, ) as inferred from the CMB dipole after correction for the local Virgocentric infall vector. The infall vector at the position of the LG amounts to and diminishes for larger Virgocentric velocities according to the mass profile of the Supercluster. The question as to the exact shape of the Local Supercluster is very complex as evidenced for instance by the near component of the Centaurus cluster (Lucey et al., 1991; Stein et al., 1997), and the Pegasus and Hydra clusters all three of which lie near to its outer boundary.
The Local Supercluster is the largest volume to our knowledge for which an unambiguous peculiar motion has been found. Claims for coherent streaming motions over still larger scales are either disproven or remain very doubtful in view of possible systematic errors of the applied distance indicators with large intrinsic scatter. In any case any large-scale streaming motion of which the Local Supercluster could partake is limited by the agreement between the absolute CMB dipole motion of and the observed bulk motion of with respect to galaxies beyond . The question as to the relation between volume size and corresponding peculiar velocity is decisive for the theory of structure evolution which predicts decreasing peculiar velocities with increasing structure size. CDM models with , predict quite generally that a bulk motion of lies in the upper, yet permissible range for a volume of radius (Dekel 2000, Fig. 1; Colless et al. 2001, Fig. 14).
The bulk motions of galaxy concentrations outside the Local Supercluster are still difficult to determine in view of the remaining distance errors. The one-dimensional bulk velocities in the inertial frame of the CMB of the 28 (super-) clusters and groups with contained in Table 1 are compiled in Table 6 (in order of RA). Columns (1)(3) give the name of the cluster, its adopted distance modulus from SNe Ia, D and/or fundamental plane distances, and the number of distance determinations, respectively. The observed mean cluster velocity, expressed as is in column (4). The expected velocity in column (5) is calculated for , , and as throughout in this paper. The bulk velocity and its error follow in column (6). The error is estimated by assuming here a distance error of 7.5% for one distance determination and of 5% for two or three distance determinations. The average (absolute) bulk velocity of the 28 aggregates is . However the signal of is smaller than the average error of , questioning whether any of the bulk velocities are significant. If one considers instead only the 11 clusters and groups with , for which the distance errors are less effective, one obtains an average bulk motion of , or in three dimensions. In the sample of 11 only the Hydra cluster has a bulk radial velocity with a significance of , i.e. toward the Local Supercluster. Peculiar velocities of large aggregates of some hundred appear to be compatible with the data. The one-dimensional bulk velocity of the Local Supercluster of , as seen from a random external observer, is therefore not exeptional.
It is unphysical to seek for a single attractor accelerating the Local Supercluster as has been proposed in the case of the Great Attractor (see § 2.3.1) or the Shapley Concentration (Mathewson et al., 1992; Saunders et al., 2000; Kocevski & Ebeling, 2006; Basilakos & Plionis, 2006), because they are 53 and 34 degrees away from the apex direction . It is clear that instead the acceleration must be caused by the integrated force exerted by all surrounding mass concentrations and voids. A lower distance limit of the dominant accelerators is set by the radius of the Local Supercluster of . A direct determination of the convergence depth is afforded by integrating the light of all-sky samples of galaxies up to the point where the light dipole – which is the same as the dipole of the gravitational pull if the mass-to-light ratio is assumed to be constant – agrees with the CMB dipole (see Yahil et al., 1980a; Davis & Huchra, 1982; Lahav, 1987; Lynden-Bell et al., 1989; Strauss et al., 1992; Maller et al., 2003). Particularly suited for this purpose is the relatively absorption-free m all-sky 2MASS Redshift Survey from which Erdoğdu et al. (2006a) have derived – by excluding a few nearby galaxies and integrating out to – an apex at , . This agrees well with the CMB apex at , as seen from the Local Group (see § 4).333In this case the dipole of the integrated light must be compared with the CMB apex as seen from the Local Group and not with the apex , i.e. corrected for Virgocentric infall, because the integration starts at small velocities and includes the Virgo cluster. The agreement is only marginally improved if the integration is carried out to . The conclusion is that most of the acceleration of the Local Supercluster comes from a distance of . A map of the dominant overdensities (in m) and voids within a shell centered at 4000 kms-1 is given by Erdoğdu et al. (2006b, their Fig. 4). The structures seen in this shell are probably the main players accelerating the Local Supercluster.
References
- Aaronson et al. (1982) Aaronson, M., et al. 1982, ApJS, 50, 241
- Aaronson et al. (1986) Aaronson, M., Bothun, G., Mould, J., Schommer, R. A., & Cornell, M. E. 1986, ApJ, 302, 536
- Basilakos & Plionis (2006) Basilakos, S., & Plionis, M. 2006, MNRAS, 373, 1112
- Bennett et al. (1996) Bennett, C. L., et al. 1996, ApJ, 464, L1
- Bondi (1960) Bondi, H. 1960, Cosmology (Cambridge: Cambridge Univ. Press)
- Bottinelli et al. (1987) Bottinelli, L., Gouguenheim, L., Fouqué, P., Paturel, G., & Teerikorpi, P. 1987, A&A, 181, 1
- Bottinelli et al. (1986) Bottinelli, L., Gouguenheim, L., Paturel, G., & Teerikorpi, P. 1986, A&A, 156, 157
- Bottinelli et al. (1988) Bottinelli, L., Gouguenheim, L., Paturel, G., & Teerikorpi, P. 1988, ApJ, 328, 4
- Bottinelli et al. (1991) Bottinelli, L., Gouguenheim, L., Paturel, G., & Teerikorpi, P. 1991, A&A, 252, 550
- Bowers & Deeming (1984) Bowers, R., & Deeming, T. 1984, Astrophysics II: Interstellar Matter and Galaxies (Boston: Jones & Bartlett)
- Burstein (1990) Burstein, D. 1990, Rep. Prog. Phys., 53, 421
- Carpenter (1938) Carpenter, E. F. 1938, ApJ, 88, 344
- Carroll et al. (1992) Carroll, S. M., Press, W. H., & Turner, E. L. 1992, ARA&A, 30, 499
- Carroll & Ostlie (1996) Carroll, B. W., & Ostlie, D. A. 1996, An Introduction to Modern Astrophysics (New York: Addison)
- Charlier (1908) Charlier, C. V. L. 1908, Ark. Mat. Astron. Fys. 4, 1
- Charlier (1922) Charlier, C. V. L. 1922, Ark. Mat. Astron. Fys. 16, 1; Medd. Lund. Obs. No. 98
- Ciardullo et al. (2002) Ciardullo, R., Feldmeier, J. J., Jacoby, G. H., Kuzio de Naray, R., Laychak, M. B., & Durrell, P. R. 2002, ApJ, 577, 31
- Colless et al. (2001) Colless, M., Saglia, R. P., Burstein, D., Davies, R. L., McMahan, R. K., & Wegner, G. 2001, MNRAS, 321, 277
- Conley et al. (2007) Conley, A., Carlberg, R. G., Guy, J., Howell, D. A., Jha, S., Riess, A. G., & Sullivan, M. 2007, ApJ, 664, 13
- Corey & Wilkinson (1976) Corey, B. E., & Wilkinson, D. T. 1976, BAAS, 8, 351
- Davis & Huchra (1982) Davis, M., & Huchra, J. 1976, ApJ, 254, 437
- Dale et al. (1999) Dale, D. A., Giovanelli, R., Haynes, M. P., Campusano, L. E., Hardy, E., & Borgani, S. 2000, ApJ, 510, L11
- de Freitas Pacheco (1986) de Freitas Pacheco, J. A. 1986, Rev. Mex. AA, 12, 74
- Dekel (2000) Dekel, A. 2000, in ASP Conf. Ser. 201, Cosmic Flows Workshop, ed. S. Courteau & J. Willick (San Francisco: ASP), 420
- de Vaucouleurs (1956) de Vaucouleurs, G. 1956, Vistas in Astronomy, 2, 1584
- de Vaucouleurs (1970) de Vaucouleurs, G. 1970, Science, 167, 1203
- de Vaucouleurs (1971) de Vaucouleurs, G. 1971, PASP, 83, 113
- Dressler (1984) Dressler, A. 1984, ApJ, 281, 512
- Dressler (1987) Dressler, A. 1987, Sci. Am., 257, 46
- Erdoğdu et al. (2006a) Erdoğdu, P., et al. 2006a, MNRAS, 368, 1515
- Erdoğdu et al. (2006b) Erdoğdu, P., et al. 2006b, MNRAS, 373, 45
- Faber & Burstein (1988) Faber, S. M., & Burstein, D. 1988, in Large-scale motions in the universe (Princeton: Princeton Univ. Press), 115
- Faber et al. (1988) Faber, S. M., Burstein, D., Davies, R. L., Dressler, A., Lynden-Bell, D., Terlevich, R., & Wegner, G. 1988, in IAU Symp. 130, Large Scale Structures of the Universe, ed. J. Audouze, M.-C. Pelletan, & S. Szalay (Dordrecht: Kluwer), 169
- Faber et al. (1989) Faber, S. M., Wegner, G., Burstein, D., Davies, R. L., Dressler, A., Lynden-Bell, D., & Terlevich, R. J. 1989, ApJS, 69, 763
- Fall & Jones (1976) Fall, S. M., & Jones, B. J. T. 1976, Nature, 262, 457
- Federspiel et al. (1994) Federspiel, M., Sandage, A., & Tammann, G. A. 1994, ApJ, 430, 29
- Feldmeier et al. (2007) Feldmeier, J. J., Jacoby, G. H., & Philips, M. M. 2007, ApJ, 657, 76
- Freedman et al. (2009) Freedman, W. L., et al. 2009, ApJ, 704, 1036
- Giovanelli et al. (1998) Giovanelli, R., Haynes, M. P., Salzer, J. J., Wegner, G., da Costa, L. N., & Freudling, W. 1998, AJ, 116, 2632
- Giovanelli et al. (1999) Giovanelli, R., Dale, D. A., Haynes, M. P., Hardy, E., & Campusano, L. E. 1999, ApJ, 525, 25
- Giraud (1990) Giraud, E. 1990, A&A, 231, 1
- Gunn (1988) Gunn, J. E. 1988, in ASP Conf. Ser. 4, The Extragalactic Distance Scale, ed. S. van den Bergh & C. J. Pritchet (San Francisco: ASP), 344
- Gunn & Oke (1975) Gunn, J. E., & Oke, J. B. 1975, ApJ, 195, 255
- Guy et al. (2005) Guy, J., Astier, P., Nobili, S., Regnault, N., & Pain, R. 2005, A&A, 443, 781
- Guy et al. (2007) Guy, J., et al. 2007, A&A, 466, 11
- Haggerty (1970) Haggerty, M. J. 1970, Physica, 50, 391
- Haggerty & Wertz (1971) Haggerty, M. J. 1971, MNRAS, 155, 495
- Harrison (1981) Harrison, E. R. 1981, 2000, Cosmology: The Science of the Universe (Cambridge: Cambridge Univ. Press)
- Harrison (1993) Harrison, E. R. 1993, ApJ, 403, 28
- Heckmann (1942) Heckmann, O. 1942, Theorien der Kosmologie (Berlin: Springer)
- Henry (1971) Henry, P. S. 1971, Nature, 231, 516
- Herrmann et al. (2008) Herrmann, K. A., Ciardullo, R., Feldmeier, J. J., & Vinciguerra, M. 2007, ApJ, 683, 630
- Hicken et al. (2009) Hicken, M., Wood-Vasey, W. M., Blondin, S., Challis, P., Jha, S., Kelly, P. L., Rest, A., & Kirshner, R. P. 2009, ApJ, 700, 1097
- Hinshaw et al. (2007) Hinshaw, G., et al. 2007, ApJS, 170, 288
- Hoffman et al. (1980) Hoffman, J. H., Olson, D. W., & Salpeter, E. E. 1980, ApJ, 242, 861
- Hoffman et al. (2001) Hoffman, Y., Eldar, A., Zaroubi, S., & Dekel, A. 2001, preprint (astro-ph/0102190)
- Hubble (1929) Hubble, E. 1929, Proc. Nat. Acad. Sci., 15, 168
- Hubble & Humason (1931) Hubble, E., & Humason, M. L. 1931, ApJ, 74, 43
- Humason et al. (1956) Humason, M. L., Mayall, N. U., & Sandage, A. R. 1956, AJ, 61, 97
- Jha et al. (2007) Jha, S., Riess, A. G., & Kirshner, R. P. 2007, ApJ, 659, 122
- Jerjen & Tammann (1993) Jerjen, H., & Tammann, G. A. 1993, A&A, 276, 1
- Jones et al. (2004) Jones, D. H., et al. 2004, MNRAS, 355, 747
- Jørgensen et al. (1996) Jørgensen, I., Franx, M., & Kjaergaard, P. 1996, MNRAS, 280, 167
- Kessler et al. (2009) Kessler, R., et al. 2009, ApJS, 185, 32
- Klypin et al. (2003) Klypin, A., Hoffman, Y., Kravtsov, A. V., & Gottlöber, S. 2003, ApJ, 596, 19
- Kocevski & Ebeling (2006) Kocevski, D. D., & Ebeling, H. 2006, ApJ, 645, 1043
- Komatsu et al. (2009) Komatsu, E., et al. 2009, ApJS, 180, 330
- Kraan-Korteweg (1986) Kraan-Korteweg, R. C. 1986, A&AS, 66, 255
- Lahav (1987) Lahav, O. 1987, MNRAS, 225, 213
- Lahav et al. (2000) Lahav, O., Santiago, B. X., Webster, A. M., Strauss, M. A., Davis, M., Dressler, A., & Huchra, J. P. 2000, MNRAS, 312, 166
- Lemaître (1927) Lemaître, G. 1927, Ann. Soc. Sci. Bruxelles A., 47, 49
- Lemaître (1931) Lemaître, G. 1931, MNRAS, 91, 483
- Lilje et al. (1986) Lilje, P. B., Yahil, A., Jones, B. J. T. 1986, ApJ, 307, 91
- Lucey et al. (1991) Lucey, J. R., Lahav, O., Lynden-Bell, D., Terlevich, R. J., & Melnick, J. 1991, in ASP Conf. Ser. 15, Large-Scale Structures and Peculiar Motions in the Universe, ed. D. W. Latham & L. N. da Costa (San Francisco: ASP), 31
- Lynden-Bell et al. (1988) Lynden-Bell, D., Faber, S. M., Burstein, D., Davies, R. L., Dressler, A., Terlevich, R. J., & Wegner, G. 1988, ApJ, 326, 19
- Lynden-Bell et al. (1989) Lynden-Bell, D., Lahav, O., & Burstein, D. 1989, MNRAS, 241, 325
- Maller et al. (2003) Maller, A. H., McIntosh, D. H., Katz, N., & Weinberg, M. D. 2003, ApJ, 598, 1
- Masters et al. (2006) Masters, K. L., Springob, C. M., Haynes, M. P., & Giovanelli, R. 2006, ApJ, 653, 861
- Masters (2008) Masters, K. L. 2008, ASP Conf. Ser. 395, Frontiers of Astrophysics: Celebration of NRAO 50th Anniversary Science Symposium, ed. A. H. Bridle, J. J. Condon, & G. C. Hunt (San Francisco: ASP), 137
- Mathewson et al. (1992) Mathewson, D. S., Ford, V. L., & Buchhorn, M. 1992, ApJS, 81, 413
- Mattig (1958) Mattig, W. 1958, Astron. Nachr., 284, 109
- Mattig (1959) Mattig, W. 1959, Astron. Nachr., 285, 1
- McVittie (1974) McVittie, G. C. 1974, QJRAS, 15, 246
- Milne (1935) Milne, A. E. 1935, Relativity, Gravitation and World Structure (Oxford: Clarendon)
- Narlikar (1983) Narlikar, J. V. 1983, 1993, 2002, An Introduction to Cosmology (Cambridge: Cambridge Univ. Press), Three Editions
- Paczynski & Piran (1990) Paczynski, B., & Piran, T. 1990, ApJ, 364, 341
- Peacock (1999) Peacock, J. A. 1999, Cosmological Physics (Cambridge: Cambridge Univ. Press)
- Peebles (1976) Peebles, P. J. E. 1976, ApJ, 205, 318
- Peebles (1980) Peebles, P. J. E. 1980, The Large-Scale Structure of the Universe (Princeton: Princeton Univ. Press)
- Peebles (1993) Peebles, P. J. E. 1993, Principles of Physical Cosmology (Princeton: Princeton Univ. Press)
- Reindl et al. (2005) Reindl, B., Tammann, G. A., Sandage, A., & Saha, A. 2005, ApJ, 624, 532
- Riess et al. (1995) Riess, A. G., Press, W. H., & Kirshner, R. P. 1995, ApJ, 445, L91
- Riess et al. (2009) Riess, A. G., et al. 2009, ApJ, 699, 53
- Robertson (1928) Robertson, H. P. 1928, Phil. Mag., 5, 835
- Robertson (1929) Robertson, H. P. 1929, Proc. Nat. Acad. Sci., 15, 822
- Robertson (1933) Robertson, H. P. 1933, Rev. Mod. Phys., 5, 62
- Robertson (1938) Robertson, H. P. 1938, Z. Astrophys., 15, 69
- Robertson (1955) Robertson, H. P. 1955, PASP, 67, 82
- Robertson & Noonan (1968) Robertson, H. P., & Noonan, T. W. 1968, Relativity and Cosmology (Philadelphia: Saunders)
- Sahni & Starobinsky (2000) Sahni, V., & Starobinsky, A. 2000, Int. J. Mod. Phys. D, 9, 373
- Sandage (1975) Sandage, A. 1975, in Galaxies and the Universe, Vol. 9 of Stars and Stellar Systems, ed. A. Sandage, M. Sandage, & J. Kristian (Chicago: Chicago Univ. Press), Chapter 19
- Sandage (1988) Sandage, A. 1988, ARA&A, 26, 561
- Sandage (1994) Sandage, A. 1994, ApJ, 430, 1
- Sandage (1995) Sandage, A. 1995, in The Deep Universe, Saas-Fee Advance Lecture Course 23, (Berlin: Springer), Chapters 5 and 10
- Sandage (1999) Sandage, A. 1999, ARA&A, 37, 445
- Sandage & Tammann (1975) Sandage, A., & Tammann, G. A. 1975, ApJ, 197, 265 (appendix on the bias proof against the Rubin-Ford effect)
- Sandage & Tammann (1984) Sandage, A., & Tammann, G. A. 1984, in Large-Scale Structure of the Universe, Cosmology and Fundamental Physics, ed. G. Setti & L. Van Hove (Garching: ESO), 127
- Sandage, Tammann, & Hardy (1972) Sandage, A., Tammann, G. A., & Hardy, E. 1972, ApJ, 172, 253
- Sandage et al. (2006) Sandage, A., Tammann, G. A., Saha, A., Reindl, B., Macchetto, F. D., & Panagia, N. 2006, ApJ, 653, 843
- Saunders et al. (2000) Saunders, W., et al. 2000, in ASP Conf. Ser. 218, Mapping the Hidden Universe: The Universe behind the Milky Way – The Universe in HI, ed. R. C. Kraan-Korteweg, P. A. Henning, & H. Andernach (San Francisco: ASP), 141
- Smith et al. (2004) Smith, R. J., et al. 2004, AJ, 128, 1558
- Smoot et al. (1977) Smoot, G. F., Gorenstein, M. V., & Muller, R. A. 1977, Phys. Rev. Lett., 39, 898
- Spergel et al. (2007) Spergel, D. N., et al. 2007, ApJS, 170, 377
- Springob et al. (2007) Springob, C. M., Masters, K. L., Haynes, M. P., Giovanelli, R., & Marinoni, C. 2007, ApJS, 172, 599
- Springob et al. (2009) Springob, C. M., Masters, K. L., Haynes, M. P., Giovanelli, R., & Marinoni, C. 2007, ApJS, 182, 474
- Springob et al. (2010) Springob, C. M., et al. 2010, BAAS, 41, 551
- Stein et al. (1997) Stein, P., Jerjen, H., & Federspiel, M. 1997, A&A, 327, 952
- Strauss et al. (1992) Strauss, M. A., Yahil, A., Davis, M., Huchra, J. P., & Fisher, K. 1992, ApJ, 397, 395
- Tammann (1993) Tammann, G. A. 1993, in IAU Symp. 155, Planetary nebulae, ed. R. Weinberger & A. Acker (Dordrecht: Kluwer), 515
- Tammann (1999) Tammann G. A. 1999, in Recent Developments in Theoretical and Experimental General Relativity, Gravitation, and Relativistic Field Theories, ed. T. Piran & R. Ruffini (Singapore: World Scientific), 243
- Tammann & Sandage (1985) Tammann, G. A., & Sandage, A. 1985, ApJ, 294, 81
- Tammann et al. (2008a) Tammann, G. A., Sandage, A., & Reindl, B. 2008a, ApJ, 679, 52
- Tammann et al. (2008b) Tammann, G. A., Sandage, A., & Reindl, B. 2008b, A&ARv, 15, 289
- Teerikorpi (1975a) Teerikorpi, P. 1975a, A&A, 45, 117
- Teerikorpi (1975b) Teerikorpi, P. 1975b, Observatory, 95, 105
- Teerikorpi (1984) Teerikorpi, P. 1984, A&A, 141, 407
- Teerikorpi (1987) Teerikorpi, P. 1987, A&A, 173, 39
- Theureau et al. (2007) Theureau, G., Hanski, M. O., Coudreau, N., Hallet, N., & Martin, J.-M. 2007, A&A, 465, 71
- Tonry & Davis (1981) Tonry, J. L., & Davis, M. 1981, ApJ, 246, 680
- Tonry et al. (2001) Tonry, J. L., Dressler, A., Blakeslee, J. P., Ajhar, E. A., Fletcher, A. B., Luppino, G. A., Metzger, M. R., & Moore, C. B. 2001, ApJ, 546, 681
- Walker (1936) Walker, A. G. 1936, Proc. London Math. Soc., 42, 90
- Wang et al. (2006) Wang, X., Wang, L., Pain, R., Zhou, X., & Li, Z. 2006, ApJ, 645, 488
- Watkins et al. (2009) Watkins, R., Feldman, H. A., Hudson, M. J. 2009, MNRAS, 392, 743
- Wertz (1970) Wertz, J. R. 1970, Ph.D. thesis, Univ. Texas at Austin, Pub. Dept. Astr. Ser II, Vol. 3 No. 4
- Wiltshire (2008) Wiltshire, D. L. 2008, Int. J. Mod. Phys. D., 17, 641
- Wood-Vasey et al. (2008) Wood-Vasey, W. M., et al. 2008, ApJ, 689, 377
- Yahil (1985) Yahil, A. 1985, in The Virgo Cluster of Galaxies, ed. O.-G. Richter & B. Binggeli (Garching: ESO), 359
- Yahil et al. (1980a) Yahil, A., Sandage, A., & Tammann, G. A. 1980a, ApJ, 242, 448
- Yahil et al. (1980b) Yahil, A., Sandage, A., & Tammann, G. A. 1980b, in Physical Cosmology, ed. E. Balian, J. Audouze, & D. N. Schramm (Amsterdam: North-Holland), 127
- Yahil et al. (1977) Yahil, A., Tammann, G. A., & Sandage, A. 1977, ApJ, 217, 903
- Zehavi et al. (1998) Zehavi, I., Riess, A. G., Kirshner, R. P., & Dekel, A. 1998, ApJ, 503, 483
- Zwicky (1962) Zwicky, F. 1962, in IAU Symp. 15, Problems of Extragalactic Research, ed. G. C. McVittie (New York: Macmillan), 347
| Galaxy | SNe | cluster | GLON | GLAT | Apex | Source | |||||
|---|---|---|---|---|---|---|---|---|---|---|---|
| (1) | (2) | (3) | (4) | (5) | (6) | (7) | (8) | (9) | (10) | (11) | (12) |
| UGC 14 | 2006sr | 108.87 | -38.36 | 7237 | 7352 | 7069 | 35.33 | 151 | 230 | 5 | |
| UGC 40 | 2003it | 110.66 | -34.33 | 7531 | 7664 | 7362 | 35.47 | 153 | 76 | 5 | |
| UGC 52 | 2002hw | 104.56 | -52.64 | 5257 | 5309 | 5103 | 34.66 | 138 | 53 | 5 | |
| Anon 0010-49 | 1992au | 319.12 | -65.88 | 18287 | 18061 | 18267 | 37.43 | 84 | -173 | 1,3 | |
| UGC 139 | 1998dk | 102.85 | -62.16 | 3963 | 3981 | 3826 | 33.86 | 129 | 330 | 1,3 | |
| NGC 105 | 1997cw | 113.09 | -49.48 | 5290 | 5369 | 5140 | 34.09 | 139 | 1314 | 1,3 | |
| Anon 0036+11 | 1996bl | 116.99 | -51.30 | 10793 | 10830 | 10651 | 36.16 | 137 | 476 | 1,2,3 | |
| NGC 191A | 2006ej | 113.14 | -71.65 | 6131 | 6079 | 6021 | 35.00 | 119 | -54 | 5 | |
| A2806 | A2806 | 306.16 | -60.90 | 8304 | 8075 | 8310 | 35.47 | 77 | 487 | 6 | |
| MCG -02-02-86 | 2003ic | A0085 | 115.24 | -72.03 | 16690 | 16616 | 16583 | 36.86 | 118 | 2455 | 5 |
| NGC 232 | 2006et | 93.67 | -85.93 | 6647 | 6528 | 6570 | 35.04 | 106 | 283 | 5 | |
| MCG +06-02-17 | 2006mo | 121.85 | -26.53 | 11093 | 11245 | 10941 | 36.41 | 150 | -339 | 5 | |
| 2MASX J0056-01 | 2006gt | 125.75 | -64.47 | 13422 | 13382 | 13309 | 36.74 | 123 | -43 | 4b | |
| Anon 0056-01 | 2006nz | 125.82 | -64.07 | 11468 | 11431 | 11355 | 36.51 | 123 | -682 | 5 | |
| UGC 607 | 1999ef | 125.71 | -50.08 | 11733 | 11764 | 11602 | 36.74 | 134 | -1660 | 1,3 | |
| UGC 646 | 1998ef | 125.88 | -30.57 | 5319 | 5473 | 5176 | 34.37 | 146 | 867 | 1,3 | |
| NGC 382 | 2000dk | N383Gr | 126.84 | -30.35 | 5229 | 5380 | 5088 | 34.56 | 145 | 357 | 1,2,3 |
| NGC 383 Gr | N383Gr | 126.84 | -30.34 | 5098 | 5250 | 4957 | 34.52 | 145 | 319 | 6 | |
| A2877 | A2877 | 293.13 | -70.88 | 7405 | 7194 | 7396 | 35.46 | 84 | -359 | 6 | |
| Anon 0116+01 | 2005ir | 136.24 | -61.42 | 22886 | 22842 | 22782 | 38.12 | 122 | -1840 | 4b,5 | |
| ESO 352-57 | 1992bo | 261.87 | -80.35 | 5549 | 5380 | 5518 | 34.87 | 92 | -402 | 1,2,3 | |
| NGC 507 Gr | N507Gr | 130.64 | -29.13 | 4934 | 5089 | 4802 | 34.35 | 142 | 525 | 6 | |
| NGC 0523 | 2001en | N507Gr | 130.91 | -28.32 | 4758 | 4919 | 4627 | 34.27 | 142 | 518 | 5 |
| A0194 | A0194 | 142.06 | -63.10 | 5396 | 5370 | 5302 | 34.60 | 119 | 256 | 6,7 | |
| MCG -01-04-44 | 1998dm | 145.97 | -67.40 | 1959 | 1940 | 33.21 | 115 | -773 | 1,3 | ||
| Anon | 2005hj | 142.55 | -62.76 | 17388 | 17336 | 17294 | 37.35 | 119 | -265 | 4b,5 | |
| 2MASX J0127+19 | 2005hf | A0195 | 134.47 | -42.95 | 12924 | 12980 | 12804 | 36.64 | 134 | 141 | 5 |
| IC 126 | 1993ae | 144.62 | -63.23 | 5712 | 5682 | 5621 | 34.70 | 118 | 330 | 1,3 | |
| UGC 1087 | 1999dk | 137.35 | -47.47 | 4485 | 4548 | 4372 | 34.22 | 130 | 246 | 1,2,3 | |
| NGC 632 | 1998es | 143.19 | -55.18 | 3168 | 3204 | 33.29 | 123 | 390 | 1,2,3 | ||
| UGC 1162 | 2001eh | 132.24 | -20.37 | 11103 | 11269 | 10976 | 36.18 | 143 | 821 | 5 | |
| Anon 0145-56 | 1992br | 288.01 | -59.43 | 26382 | 26119 | 26411 | 38.23 | 72 | 226 | 1,2,3 | |
| NGC 673 | 1996bo | 144.46 | -48.96 | 5182 | 5224 | 5084 | 34.24 | 125 | 883 | 1,2,3 | |
| UGC 1333 | 2006ob | 153.30 | -59.00 | 17759 | 17708 | 17680 | 37.33 | 116 | 261 | 5 | |
| A0262 | A0262 | 136.59 | -25.09 | 4887 | 5048 | 4770 | 34.44 | 138 | 293 | 6 | |
| MCG +00-06-03 | 2005hc | 155.87 | -58.84 | 13771 | 13719 | 13696 | 36.85 | 115 | -380 | 4b,5 | |
| 2MASX J0158+36 | 2006td | 137.68 | -24.60 | 4761 | 4919 | 4647 | 34.65 | 137 | -313 | 5 | |
| NGC 0809 | 2006ef | 169.46 | -64.80 | 5361 | 5288 | 5306 | 34.87 | 107 | -494 | 5 | |
| MCG +06-06-12 | 2002hu | 141.44 | -22.27 | 8994: | 9132: | 8891: | 36.28 | 134 | -1796: | 2 | |
| Anon 0227+28 | 2005eu | 147.48 | -30.06 | 10463 | 10558 | 10373 | 35.89 | 128 | 1387 | 4a | |
| UGC 1993 | 1999gp | 143.25 | -19.51 | 8018 | 8172 | 7922 | 35.57 | 133 | 234 | 1,2,3,4a | |
| NGC 976 | 1999dq | 152.84 | -35.87 | 4295 | 4387 | 4218 | 33.79 | 123 | 851 | 1,2,3 | |
| IC 1844 | 1995ak | 169.66 | -48.98 | 6811 | 6785 | 6767 | 35.04 | 109 | 540 | 1,2,3 | |
| UGC 2320 | 2003iv | 162.50 | -40.73 | 10285 | 10293 | 10230 | 36.29 | 114 | -684 | 5 | |
| CGCG 539-121 | 2005ls | 145.75 | -14.64 | 6331 | 6508 | 6245 | 34.82 | 130 | 856 | 5 | |
| UGC 2384 | 2006os | A0397 | 161.38 | -37.47 | 9836 | 9864 | 9780 | 35.86 | 116 | 817 | 5 |
| A0397 | A0397 | 161.91 | -37.24 | 9803 | 9830 | 9749 | 35.87 | 115 | 742 | 6 | |
| A0400 | A0400 | 170.24 | -44.93 | 7315 | 7299 | 7276 | 35.19 | 108 | 615 | 6 | |
| ESO 300-09 | 1992bc | 245.70 | -59.64 | 5996 | 5791 | 6036 | 35.03 | 75 | -426 | 1,2,3 | |
| MCG -01-09-06 | 2005eq | 187.64 | -51.74 | 8687 | 8598 | 8677 | 35.78 | 97 | -129 | 4a,b | |
| NGC 1259 | 2008L | A0426 | 150.24 | -13.62 | 5816 | 5988 | 5745 | 34.63 | 126 | 803 | 5 |
| NGC 1275 | 2005mz | A0426 | 150.58 | -13.26 | 5264 | 5435 | 5194 | 34.72 | 125 | 34 | 5 |
| NGC 1316 | 1981D | Fornax | 240.16 | -56.69 | 1760 | 1371 | 31.23 | 74 | 1,3 | ||
| NGC 1316 | 1980N | Fornax | 240.16 | -56.69 | 1760 | 1371 | 31.71 | 74 | 1,3 | ||
| Anon 0329-37 | 1992bs | 240.03 | -55.34 | 18887 | 18659 | 18938 | 37.68 | 73 | -1699 | 1,2,3 | |
| NGC 1380 | 1992A | Fornax | 235.93 | -54.06 | 1877 | 1371 | 31.82 | 74 | -64 | 1,2,3 | |
| Anon 0336-18 | 1992bp | 208.83 | -51.09 | 23684 | 23525 | 23713 | 37.79 | 85 | 2160 | 1,2,3 | |
| Anon 0335-33 | 1990Y | 232.64 | -53.85 | 11702 | 11496 | 11753 | 36.38 | 75 | 68 | 1,3 | |
| UGC 2829 | 2006kf | 178.55 | -35.71 | 6386 | 6378 | 6378 | 35.12 | 102 | -98 | 5 | |
| ESO 156-08 | 1992bk | A3158 | 265.05 | -48.93 | 17598 | 17333 | 17675 | 37.27 | 61 | 343 | 1,2,3 |
| NGC 1448 | 2001el | 251.52 | -51.39 | 1168 | 1015 | 31.73 | 66 | -362 | 1,2,3 | ||
| Grm13 | Grm13 | 266.04 | -43.47 | 929 | 754 | 31.74 | 56 | -629 | 7 | ||
| A0496 | A0496 | 209.57 | -36.48 | 9863 | 9736 | 9928 | 36.03 | 78 | -31 | 6 | |
| UGC 3108 | 2006lf | 159.92 | -1.93 | 3959 | 4150 | 3930 | 34.21 | 115 | -132 | 4a | |
| NGC 1699 | 2001ep | 203.60 | -27.55 | 3901 | 3850 | 3971 | 33.95 | 79 | 46 | 5 | |
| Anon 0459-58 | 1992bh | 267.85 | -37.33 | 13491 | 13220 | 13602 | 36.88 | 50 | -1069 | 1,2,3 | |
| UGC 3218 | 2006le | 147.89 | 12.18 | 5226 | 5479 | 5176 | 35.03 | 122 | -738 | 4a | |
| NGC 1819 | 2005el | 196.17 | -19.40 | 4470 | 4466 | 4535 | 34.21 | 83 | 183 | 4a,b | |
| A0539 | A0539 | 195.70 | -17.72 | 8514 | 8486 | 8580 | 35.95 | 83 | -936 | 7 | |
| UGC 3329 | 1999ek | 189.40 | -8.23 | 5253 | 5304 | 5314 | 34.59 | 87 | 213 | 1,2,3,4a | |
| PGC 17787 | 1993ac | 149.72 | 17.21 | 14690 | 14923 | 14652 | 37.00 | 118 | -149 | 1,2,3 | |
| CGCG 308-09 | 2006N | 149.44 | 19.97 | 4280 | 4561 | 4245 | 34.36 | 117 | -24 | 4a | |
| A3381 | A3381 | 240.29 | -22.70 | 10763 | 10561 | 10907 | 36.32 | 48 | -565 | 7 | |
| UGC 3432 | 1996bv | 157.34 | 17.97 | 4998 | 5247 | 4984 | 34.44 | 111 | 491 | 1,2,3 | |
| 2MASX J0627-35 | 1999ao | 243.83 | -20.02 | 16189 | 15974 | 16342 | 37.21 | 44 | -570 | 5 | |
| CGCG 233-023 | 2002kf | 165.59 | 18.25 | 5786 | 5999 | 5799 | 34.98 | 104 | -79 | 5 | |
| ESO 427-06 | 2004S | 240.79 | -14.79 | 2806 | 2672 | 33.47 | 43 | -383 | 2 | ||
| NGC 2258 | 1997E | 140.22 | 25.82 | 4059 | 4374 | 4007 | 34.26 | 122 | -7 | 1,2,3 | |
| UGC 3576 | 1998ec | 166.30 | 20.71 | 5966 | 6180 | 5984 | 35.16 | 102 | -415 | 1,3 | |
| UGC 3634 | 2005na | 201.40 | 8.61 | 7891 | 7923 | 8005 | 35.57 | 72 | -16 | 4a,b | |
| NGC 2320 | 2000B | 166.36 | 22.79 | 5944 | 6169 | 5964 | 34.76 | 102 | 669 | 1,3 | |
| A0569 | A0569 | 168.57 | 22.81 | 6026 | 6237 | 6053 | 35.03 | 100 | 20 | 6 | |
| UGC 3725 | 2007au | A0569 | 167.38 | 23.53 | 6171 | 6390 | 6195 | 34.98 | 101 | 312 | 5 |
| NGC 2268 | 1982B | 129.24 | 27.55 | 2222 | 2610 | 32.48 | 128 | 668 | 1 | ||
| UGC 3770 | 2000fa | 194.17 | 15.48 | 6378 | 6469 | 6477 | 35.23 | 78 | -338 | 1,2,3 | |
| UGC 3787 | 2003ch | 207.22 | 10.26 | 7495 | 7504 | 7626 | 35.97 | 66 | -2002 | 5 | |
| UGC 3845 | 1997do | 171.00 | 25.27 | 3034 | 3279 | 33.69 | 97 | -99 | 1,2,3 | ||
| Anon 0741-62 | 1992bg | 274.61 | -18.35 | 10793 | 10537 | 10947 | 36.28 | 30 | -391 | 1,2,3 | |
| MCG +08-14-43 | 2007R | 174.35 | 28.16 | 9258 | 9443 | 9307 | 36.12 | 93 | -727 | 5 | |
| NGC 2441 | 1995E | 141.99 | 30.26 | 3470 | 3804 | 3430 | 33.66 | 118 | 472 | 1,2,3 | |
| UGC 4133 | 2006qo | 161.38 | 31.68 | 9130 | 9368 | 9145 | 35.80 | 103 | 561 | 5 | |
| UGC 4195 | 2000ce | 149.10 | 32.00 | 4888 | 5180 | 4869 | 34.69 | 112 | -148 | 1,2,3,4a | |
| CGCG 207-42 | 2006te | 178.98 | 32.08 | 9471 | 9648 | 9536 | 36.08 | 88 | -341 | 5 | |
| A0634 | A0634 | 159.40 | 33.64 | 7945 | 8192 | 7957 | 35.72 | 104 | -303 | 6 | |
| UGC 4322 | 2002he | 153.60 | 33.98 | 7364 | 7631 | 7360 | 35.51 | 108 | -95 | 5 | |
| Cancer | Cancer | 202.55 | 28.69 | 4497 | 4613 | 4623 | 34.49 | 69 | -252 | 6 | |
| NGC 4414 | 1974G | 174.54 | 83.18 | 716 | 788 | 31.47 | 79 | -433 | 1,2 | ||
| UGC 4414 | 2005mc | 202.50 | 30.23 | 7561 | 7656 | 7687 | 35.69 | 69 | -724 | 5 | |
| NGC 2595 | 1999aa | Cancer | 202.73 | 30.31 | 4330 | 4452 | 4457 | 34.52 | 69 | -479 | 1,2,3 |
| UGC 4455 | 2007bd | 226.07 | 21.52 | 9299 | 9277 | 9474 | 35.89 | 47 | 107 | 5 | |
| NGC 2623 | 1999gd | 198.84 | 33.97 | 5549 | 5682 | 5666 | 34.90 | 72 | -179 | 1,2,3 | |
| MCG +03-22-20 | 2004gs | 207.96 | 31.32 | 7988 | 8065 | 8126 | 35.78 | 64 | -662 | 4b | |
| UGC 4614 | 2005ms | 186.90 | 38.49 | 7556 | 7727 | 7644 | 35.60 | 81 | -319 | 5 | |
| MCG -01-23-08 | 2002hd | 234.77 | 23.16 | 10493 | 10449 | 10680 | 35.93 | 40 | 1112 | 5 | |
| CGCG 180-22 | 1999X | 186.59 | 39.59 | 7546 | 7726 | 7634 | 35.49 | 81 | 70 | 1,3 | |
| MCG +08-17-43 | 2001G | 168.32 | 42.31 | 5028 | 5292 | 5072 | 34.37 | 94 | 686 | 5 | |
| A0779 | A0779 | 191.07 | 44.41 | 6742 | 6913 | 6840 | 35.52 | 77 | -848 | 6 | |
| NGC 2935 | 1996Z | 253.59 | 22.57 | 2271 | 2280 | 32.76 | 23 | 72 | 1,2,3 | ||
| NGC 2930 | 2005M | 206.89 | 46.22 | 6599 | 6733 | 6728 | 35.35 | 66 | -454 | 4b | |
| UGC 5129 | 2001fe | 203.70 | 46.88 | 4059 | 4240 | 4182 | 34.17 | 68 | 35 | 5 | |
| NGC 2962 | 1995D | 230.00 | 39.67 | 1966 | 2120 | 32.85 | 48 | -180 | 1,2,3 | ||
| NGC 2986 | 1999gh | 255.04 | 23.72 | 2302 | 2300 | 32.94 | 22 | -97 | 1,2,3 | ||
| UGC 5234 | 2003W | 217.68 | 45.93 | 6017 | 6132 | 6164 | 34.89 | 59 | 297 | 5 | |
| NGC 3021 | 1995al | 192.18 | 50.84 | 1541 | 1841 | 32.71 | 76 | -317 | 1,2,3 | ||
| UGC 5378 | 2007S | 234.37 | 43.38 | 4161 | 4246 | 4332 | 34.26 | 47 | -135 | 5 | |
| UGC 5542 | 2001ie | 150.36 | 47.78 | 9215 | 9490 | 9223 | 35.89 | 103 | 319 | 5 | |
| Anon 1003-35 | 1993ag | 268.44 | 15.93 | 14700 | 14542 | 14898 | 37.03 | 7 | -732 | 1,2,3 | |
| Anon 1009-26 | 1992J | 263.55 | 23.54 | 13491 | 13375 | 13691 | 36.62 | 16 | 651 | 1,3 | |
| CGCG 266-31 | 2002bf | 156.46 | 50.08 | 7254 | 7521 | 7278 | 35.60 | 98 | -525 | 3 | |
| NGC 3147 | 1997bq | 136.29 | 39.46 | 2820 | 3188 | 33.45 | 116 | 161 | 1,2,3 | ||
| NGC 3190 | 2002bo | 213.04 | 54.85 | 1271 | 1573 | 32.20 | 64 | -135 | 1,2,3,4a | ||
| MCG +03-27-38 | 2004L | 223.79 | 54.79 | 9686 | 9790 | 9829 | 36.08 | 58 | -199 | 5 | |
| UGC 5691 | 1991S | 214.07 | 57.42 | 16489 | 16610 | 16617 | 37.28 | 64 | -455 | 1,3 | |
| AS636 | Antlia | 272.95 | 19.19 | 2608 | 2541 | 33.40 | 8 | -418 | 6 | ||
| Anon 1034-34 | 1993B | 273.33 | 20.46 | 20686 | 20538 | 20881 | 37.75 | 9 | -456 | 1,2,3 | |
| NGC 3294 | 1992G | 184.62 | -59.84 | 1586 | 1542 | 32.70 | 100 | -606 | 3 | ||
| A1060 | Hydra | 269.63 | 26.51 | 3777 | 3717 | 3973 | 34.23 | 15 | -604 | 6,7 | |
| MCG +11-13-36 | 2006ar | 142.76 | 46.62 | 6757 | 7054 | 6747 | 35.46 | 107 | -499 | 5 | |
| Anon 1039+05 | 2006al | A1066 | 241.92 | 51.69 | 20341 | 20380 | 20505 | 37.72 | 48 | -339 | 5 |
| NGC 3327 | 2001N | 211.35 | 60.29 | 6303 | 6471 | 6424 | 35.11 | 67 | 24 | 5 | |
| NGC 3332 | 2005ki | 236.83 | 54.27 | 5758 | 5858 | 5914 | 34.96 | 52 | -165 | 4b,5 | |
| AS639 | AS639 | 280.54 | 10.91 | 6326 | 6171 | 6512 | 34.89 | 6 | 337 | 7 | |
| NGC 3368 | 1998bu | 234.44 | 57.01 | 897 | 719 | 30.45 | 55 | -45 | 1,2,3,4a | ||
| NGC 3370 | 1994ae | 225.35 | 59.67 | 1279 | 1603 | 32.63 | 60 | -477 | 1,2,3 | ||
| UGC 6015 | 2006cf | 165.96 | 60.09 | 12457 | 12690 | 12509 | 36.55 | 89 | 357 | 5 | |
| Anon 1101-06 | 1999aw | 260.24 | 47.45 | 11992 | 11994 | 12168 | 36.59 | 38 | -560 | 1,2,3 | |
| 2MASX J1109+28 | 2006ak | 203.15 | 67.48 | 11422 | 11595 | 11523 | 36.42 | 72 | -41 | 5 | |
| NGC 3557 Gr | N3557Gr | 281.58 | 21.09 | 3056 | 2990 | 33.51 | 11 | -121 | 6 | ||
| UGC 6211 | 2001ah | 149.13 | 56.52 | 17315 | 17573 | 17334 | 37.21 | 98 | 1028 | 5 | |
| UGC 6332 | 2007bc | 224.67 | 68.06 | 6227 | 6394 | 6346 | 35.13 | 65 | -111 | 5 | |
| NGC 3627 | 1989B | 241.96 | 64.42 | 727 | 431 | 30.35 | 57 | -299 | 1,2,3 | ||
| UGC 6363 | 2004bg | 223.72 | 68.62 | 6306 | 6477 | 6423 | 35.10 | 65 | 60 | 5 | |
| NGC 3663 | 2006ax | 271.83 | 45.23 | 5018 | 5041 | 5194 | 34.62 | 34 | -120 | 4a,b | |
| HOLM 254B | 2004as | 220.68 | 70.12 | 9300 | 9457 | 9412 | 36.13 | 67 | -759 | 5 | |
| A1314 | A1314 | 151.83 | 63.57 | 10043 | 10302 | 10076 | 36.05 | 93 | 446 | 6 | |
| ESO 439-18 | 2001ba | 285.38 | 28.03 | 8861 | 8759 | 9041 | 35.97 | 19 | -748 | 2,3,4a | |
| EROS J1139-08 | 1999bp | 274.68 | 50.04 | 23084 | 23075 | 23250 | 38.06 | 38 | -970 | 5 | |
| A1367 | A1367 | 234.80 | 73.03 | 6595 | 6765 | 6707 | 35.17 | 65 | 140 | 6 | |
| NGC 3873 | 2007ci | A1367 | 235.50 | 73.26 | 5434 | 5618 | 5546 | 34.78 | 66 | 68 | 5 |
| NGC 3978 | 2003cq | 134.85 | 55.31 | 9978 | 10270 | 9971 | 36.07 | 105 | 326 | 5 | |
| NGC 3982 | 1998aq | 138.83 | 60.27 | 1109 | 1517 | 32.07 | 100 | -92 | 1,2,3 | ||
| NGC 3987 | 2001V | 218.95 | 77.72 | 4502 | 4752 | 4596 | 34.18 | 72 | 527 | 1,2,3 | |
| NGC 4172 | 2006az | 133.89 | 60.11 | 9274 | 9563 | 9276 | 35.91 | 102 | 309 | 5 | |
| UGC 7357 | 2006cp | 243.90 | 81.31 | 6682 | 6873 | 6773 | 35.31 | 71 | -185 | 4a | |
| ESO 573-14 | 2000bh | 293.74 | 40.34 | 6838 | 6812 | 6997 | 35.35 | 33 | -375 | 2,3,4a | |
| NGC 4321 | 2006X | Virgo | 271.14 | 76.90 | 1571 | 1152 | 31.42 | 65 | -42 | 4a | |
| NGC 4419 | 1984A | Virgo | 276.45 | 76.64 | -261 | 1152 | 31.20 | 65 | 1 | ||
| NGC 4493 | 1994M | 291.69 | 63.04 | 6943 | 7034 | 7072 | 35.39 | 53 | -284 | 1,2,3 | |
| NGC 4495 | 1994S | 187.34 | 85.14 | 4550 | 4804 | 4619 | 34.47 | 78 | -17 | 1,2,3 | |
| NGC 4496A | 1960F | VirW | 290.56 | 66.33 | 1730 | 1168 | 30.81 | 56 | 266 | 1 | |
| NGC 4501 | 1999cl | Virgo | 282.33 | 76.51 | 2281 | 1152 | 31.33 | 65 | 4a | ||
| NGC 4520 | 2000bk | 295.26 | 55.23 | 7628 | 7671 | 7767 | 35.70 | 46 | -747 | 1,3,4a | |
| NGC 4526 | 1994D | Virgo | 290.16 | 70.14 | 448 | 1152 | 31.36 | 59 | 1,2,3 | ||
| NGC 4536 | 1981B | VirW | 292.95 | 64.73 | 1808 | 1407 | 31.26 | 54 | 1,2,3 | ||
| NGC 4619 | 2006ac | 136.98 | 81.80 | 6927 | 7174 | 6976 | 35.31 | 84 | 116 | 4a | |
| Cen30 | Cen30 | 300.97 | 22.15 | 3041 | 2991 | 33.44 | 27 | -22 | 6 | ||
| IC 3690 | 1992P | 295.62 | 73.11 | 7615 | 7751 | 7720 | 35.71 | 63 | -705 | 1,2,3 | |
| NGC 4639 | 1990N | Virgo | 294.29 | 75.99 | 1018 | 1152 | 32.16 | 65 | 1,2,3 | ||
| NGC 4675 | 1997Y | 124.77 | 62.37 | 4757 | 5083 | 4753 | 34.60 | 102 | -32 | 1,2,3 | |
| UGC 7934 | 2006S | 131.43 | 81.95 | 9624 | 9856 | 9671 | 36.15 | 85 | -453 | 5 | |
| 2MASX J1246+12 | 2004gu | 298.25 | 74.78 | 13748 | 13875 | 13848 | 36.78 | 64 | 209 | 4b | |
| NGC 4680 | 1997bp | 301.16 | 51.22 | 2492 | 2675 | 32.92 | 45 | 299 | 1,2,3 | ||
| NGC 4679 | 2001cz | 302.11 | 23.29 | 4643 | 4563 | 4794 | 34.37 | 29 | -43 | 2,3,4a | |
| NGC 4704 | 1998ab | 124.87 | 75.20 | 8134 | 8407 | 8162 | 35.37 | 91 | 1154 | 1,2,3 | |
| NGC 4753 | 1983G | 303.42 | 61.67 | 1239 | 1264 | 31.45 | 54 | 53 | 1 | ||
| MGC -01-33-34 | 2006D | 303.40 | 53.09 | 2556 | 2736 | 33.06 | 47 | 203 | 4a | ||
| 2MASX J1259+28 | 2006cj | 68.06 | 87.86 | 20241 | 20433 | 20297 | 37.96 | 80 | -2583 | 5 | |
| A1656 | Coma | 58.08 | 87.96 | 6925 | 7152 | 6982 | 35.37 | 80 | -100 | 6,7 | |
| IC 4042A | 2006bz | Coma | 55.57 | 87.78 | 8366 | 8583 | 8423 | 35.73 | 80 | 50 | 5 |
| UGC 8162 | 2007F | 118.24 | 66.40 | 7072 | 7367 | 7072 | 35.44 | 100 | -118 | 5 | |
| 2MASX J1305+28 | 2006cg | 61.91 | 86.59 | 8413 | 8645 | 8466 | 35.26 | 81 | 1745 | 5 | |
| IC 4182 | 1937C | 107.70 | 79.09 | 321 | 298 | 28.51 | 89 | -15 | 1,2 | ||
| MCG +06-29-43 | 2002G | 96.96 | 82.19 | 10114 | 10347 | 10152 | 36.21 | 86 | -243 | 5 | |
| ESO 508 Gr | E508 Gr | 307.98 | 39.08 | 3196 | 3252 | 33.41 | 40 | 279 | 6 | ||
| NGC 5018 | 2002dj | 309.90 | 43.06 | 2816 | 2928 | 33.05 | 44 | 407 | 5 | ||
| NGC 5061 | 1996X | 310.25 | 35.66 | 2065 | 2157 | 32.45 | 40 | 242 | 1,2,3 | ||
| PGC 46640 | 1994T | 318.02 | 59.84 | 10390 | 10465 | 10493 | 36.20 | 58 | -78 | 1,2,3 | |
| IC 4232 | 1991U | 311.82 | 36.21 | 9426 | 9389 | 9554 | 35.74 | 41 | 818 | 1,3 | |
| ESO 508-67 | 1992ag | 312.49 | 38.39 | 7795 | 7783 | 7921 | 35.33 | 43 | 661 | 1,2,3 | |
| IC 4239 | 2006cq | 62.88 | 81.84 | 14491 | 14707 | 14528 | 36.98 | 85 | -231 | 5 | |
| ESO 508-75 | 2007cg | 312.72 | 37.57 | 9952 | 9919 | 10078 | 35.93 | 43 | 582 | 5 | |
| MCG -02-34-61 | 2007ca | 316.95 | 46.69 | 4217 | 4264 | 4331 | 34.73 | 50 | -1162 | 5 | |
| Anon 1331-33 | 1993O | 312.42 | 28.92 | 15589 | 15502 | 15717 | 37.18 | 39 | -824 | 1,2,3 | |
| ESO 383-32 | 2000ca | 313.20 | 27.83 | 7080 | 7013 | 7206 | 35.31 | 39 | -45 | 2,3,4a | |
| NGC 5253 | 1972E | 314.86 | 30.11 | 407 | 171 | 27.94 | 42 | -69 | 1,2,3 | ||
| NGC 5283 | 2005dv | 115.81 | 48.76 | 3119 | 3489 | 33.93 | 117 | -281 | 5 | ||
| NGC 5308 | 1996bk | 111.25 | 54.88 | 2041 | 2459 | 32.62 | 112 | 389 | 1,2,3 | ||
| A3574 | A3574 | 317.46 | 30.94 | 4797 | 4775 | 4913 | 34.43 | 44 | 41 | 6,7 | |
| NGC 5304 | 2005al | A3574 | 317.59 | 30.62 | 3718 | 3699 | 3833 | 34.39 | 44 | -949 | 4b |
| MCG +08-25-47 | 1996C | 99.62 | 65.04 | 8094 | 8384 | 8077 | 36.05 | 103 | -1472 | 1,2,3 | |
| ESO 445-66 | 1993H | 318.22 | 30.33 | 7257 | 7211 | 7371 | 35.33 | 44 | 89 | 1,2,3 | |
| AS753 | AS753 | 319.63 | 26.55 | 4197 | 4167 | 4306 | 34.27 | 45 | -234 | 7 | |
| NGC 5468 | 1999cp | 334.87 | 52.70 | 2842 | 3010 | 33.46 | 63 | -32 | 2,3,4a | ||
| NGC 5468 | 2002cr | 334.87 | 52.70 | 2842 | 3006 | 33.58 | 63 | -207 | 5 | ||
| MCG +05-34-33 | 2002bz | 36.89 | 69.23 | 11138 | 11357 | 11146 | 36.47 | 90 | -542 | 5 | |
| IC 4423 | 2001ay | 35.97 | 68.82 | 9067 | 9290 | 9075 | 36.09 | 90 | -744 | 2,3 | |
| Anon 1433+03 | 2006bw | 353.79 | 56.19 | 8994 | 9123 | 9036 | 35.87 | 74 | 35 | 5 | |
| UGC 9391 | 2003du | 101.18 | 53.21 | 1914 | 2306 | 33.24 | 115 | -445 | 2,3,4a | ||
| UGC 9612 | 2007O | 77.66 | 59.25 | 10856 | 11144 | 10813 | 36.16 | 108 | 789 | 5 | |
| Anon | 2005ag | 7.85 | 55.50 | 23807 | 23945 | 23822 | 37.94 | 82 | 1128 | 4b | |
| UGC 9640 | 2008af | 20.11 | 58.62 | 10045 | 10236 | 10046 | 35.99 | 88 | 643 | 5 | |
| MCG -01-39-03 | 2005cf | 354.81 | 39.85 | 1937 | 2136 | 32.38 | 75 | 282 | 4 | ||
| UGC 10030 | 2002ck | 6.55 | 39.30 | 8953 | 9068 | 8946 | 35.85 | 84 | 61 | 5 | |
| MCG +11-19-25 | 2000cf | 99.88 | 42.17 | 10920 | 11241 | 10831 | 36.42 | 126 | -395 | 1,2,3 | |
| MCG +03-41-03 | 2007ap | 28.86 | 46.04 | 4742 | 4964 | 4701 | 34.77 | 98 | -561 | 5 | |
| CGCG 108-13 | 2006bt | 33.70 | 47.24 | 9640 | 9850 | 9593 | 36.03 | 100 | 83 | 5 | |
| IC 1151 | 1991M | 30.36 | 45.90 | 2169 | 2436 | 33.64 | 99 | -865 | 3 | ||
| NGC 6038 | 1999cc | 59.67 | 48.75 | 9392 | 9665 | 9320 | 36.01 | 112 | -15 | 1,2,3 | |
| NGC 6063 | 1999ac | 19.89 | 39.95 | 2848 | 3077 | 33.38 | 94 | 145 | 1,2,3 | ||
| UGC 10244 | 2006cc | 68.18 | 47.10 | 9752 | 10037 | 9670 | 36.31 | 117 | -1038 | 5 | |
| ESO 584-07 | 2007ai | 353.04 | 21.09 | 9492 | 9500 | 9499 | 36.00 | 75 | -137 | 5 | |
| NGC 6104 | 2002de | 57.37 | 45.91 | 8429 | 8702 | 8350 | 35.74 | 113 | 131 | 5 | |
| A2199 | A2199 | 62.70 | 43.70 | 9039 | 9322 | 8949 | 35.76 | 117 | 673 | 6 | |
| UGC 10483 | 2001az | 108.95 | 34.29 | 12200 | 12520 | 12100 | 36.58 | 132 | 21 | 5 | |
| PGC 59076 | 1994Q | A2199 | 64.39 | 39.68 | 8863 | 9148 | 8760 | 35.87 | 121 | 59 | 1,3 |
| UGC 10704 | 2007ae | 111.49 | 31.71 | 19303 | 19615 | 19201 | 37.33 | 134 | 2168 | 5 | |
| UGC 10738 | 2001cp | 26.50 | 24.95 | 6716 | 6874 | 6634 | 35.29 | 104 | -120 | 5 | |
| UGC 10743 | 2002er | 28.67 | 25.83 | 2569 | 2796 | 33.15 | 106 | 157 | 1,2,3 | ||
| MCG +03-44-03 | 1990O | 37.65 | 28.37 | 9193 | 9389 | 9095 | 35.87 | 112 | 301 | 1,2,3 | |
| NGC 6365A | 2003U | 91.47 | 34.06 | 8496 | 8823 | 8377 | 35.64 | 134 | 630 | 5 | |
| NGC 6462 | 2005ao | 90.99 | 31.49 | 11514 | 11828 | 11388 | 36.52 | 137 | -340 | 4a | |
| UGC 11064 | 2000cn | 53.45 | 23.32 | 7043 | 7285 | 6908 | 35.41 | 127 | -99 | 1,2,3 | |
| MCG +04-42-22 | 2001bf | 52.16 | 21.97 | 4647 | 4911 | 4511 | 34.26 | 126 | 530 | 5 | |
| UGC 11149 | 1998dx | 77.68 | 26.67 | 16256 | 16546 | 16113 | 37.02 | 138 | 1339 | 1,2,3 | |
| NGC 6627 | 1998V | 43.94 | 13.34 | 5272 | 5480 | 5132 | 34.56 | 124 | 458 | 1,2,3 | |
| MCG +05-43-16 | 2007co | 57.59 | 18.82 | 8083 | 8329 | 7933 | 35.57 | 132 | 391 | 5 | |
| NGC 6685 | 2006bq | 68.85 | 19.09 | 6567 | 6851 | 6409 | 35.15 | 140 | 286 | 5 | |
| IC 4758 | 2001cn | PavoII | 329.65 | -24.05 | 4647 | 4475 | 4676 | 34.28 | 65 | 54 | 2,3,4a |
| AS805 | PavoII | 332.25 | -23.59 | 4167 | 4002 | 4189 | 34.28 | 67 | -419 | 6 | |
| 2MASX J1911+77 | 2003hu | 109.56 | 25.44 | 22484 | 22790 | 22364 | 37.61 | 140 | 3050 | 5 | |
| IC 4830 | 2001bt | 337.32 | -25.87 | 4388 | 4240 | 4392 | 34.13 | 72 | 111 | 2,3,4a | |
| MCG +07-41-01 | 2002do | 75.61 | 6.13 | 4761 | 5041 | 4578 | 34.54 | 154 | 65 | 5 | |
| PGC 63925 | 1990T | 341.50 | -31.52 | 11992 | 11809 | 11977 | 36.63 | 77 | -972 | 1,3 | |
| IC 4919 | 1991ag | Grm15 | 342.55 | -31.64 | 4264 | 4124 | 4246 | 34.07 | 78 | 106 | 1,2,3 |
| Grm15 | Grm15 | 341.85 | -32.45 | 4286 | 4134 | 4269 | 34.36 | 78 | -451 | 7 | |
| PavoI | PavoI | 324.10 | -32.58 | 4107 | 3916 | 4138 | 33.98 | 65 | 60 | 6 | |
| NGC 6928 | 2004eo | 54.16 | -17.26 | 4707 | 4855 | 4521 | 34.15 | 141 | 688 | 4a,b | |
| NGC 6951 | 2000E | 100.90 | 14.85 | 1424 | 1814 | 31.96 | 153 | 284 | 1,2,3 | ||
| ESO 234-69 | 1992al | 347.34 | -38.49 | 4381 | 4242 | 4343 | 34.19 | 84 | -2 | 1,2,3 | |
| NGC 6962 | 2002ha | 47.41 | -25.37 | 4211 | 4311 | 4035 | 34.10 | 134 | 238 | 5 | |
| NGC 6986 | 2002el | 28.77 | -35.67 | 8612 | 8591 | 8473 | 35.46 | 116 | 1038 | 2 | |
| 2MASX J2120+44 | 2001fh | 88.22 | -3.81 | 3894 | 4185 | 3702 | 33.55 | 170 | 1016 | 5 | |
| Anon 2123-00 | 2006oa | 51.74 | -33.74 | 17988 | 18027 | 17810 | 37.35 | 135 | 425 | 5 | |
| Anon 2128-61 | 1992ae | 332.70 | -41.99 | 22484 | 22260 | 22479 | 37.76 | 76 | 1174 | 1,2,3 | |
| Anon 2135-62 | 1990af | 330.82 | -42.24 | 15080 | 14856 | 15079 | 36.90 | 75 | 440 | 1,2,3 | |
| NGC 7131 | 1998co | 41.52 | -44.94 | 5418 | 5419 | 5264 | 34.55 | 124 | 419 | 3 | |
| UGC 11816 | 2004ey | 57.47 | -38.27 | 4733 | 4804 | 4553 | 34.33 | 138 | 282 | 4b | |
| Anon 2155-01 | 2006on | 57.18 | -40.55 | 20985 | 21009 | 20808 | 37.68 | 136 | 651 | 5 | |
| MDL59 | MDL59 | 14.95 | 24.39 | 2567 | 2740 | 33.12 | 94 | 137 | 6 | ||
| IC 5179 | 1999ee | 6.50 | -55.93 | 3422 | 3325 | 33.57 | 101 | 127 | 1,2,3,4a | ||
| UGC 12071 | 2006gr | 90.75 | 38.36 | 10372 | 10689 | 10265 | 36.39 | 130 | -792 | 4a | |
| NGC 7311 | 2005kc | 72.34 | -43.41 | 4533 | 4612 | 4351 | 34.23 | 143 | 291 | 4b,5 | |
| UGC 12133 | 1998eg | 76.48 | -42.06 | 7423 | 7497 | 7238 | 35.46 | 146 | -56 | 1,2,3 | |
| NGC 7329 | 2006bh | 320.97 | -45.79 | 3252 | 3058 | 33.63 | 71 | -228 | 4b | ||
| Anon J2241-00 | 2006py | 68.44 | -48.79 | 17358 | 17372 | 17186 | 37.14 | 137 | 1333 | 4b | |
| UGC 12158 | 2004ef | 85.92 | -33.43 | 9289 | 9413 | 9096 | 35.80 | 157 | 606 | 4b | |
| IC 5270 | 1993L | 5.94 | -64.39 | 1983 | 1915 | 32.03 | 101 | 335 | 1,3 | ||
| NGC 7448 | 1997dt | 87.57 | -39.12 | 2194 | 2338 | 32.99 | 152 | -115 | 1,3 | ||
| Anon 2304-37 | 1992aq | 1.78 | -65.31 | 30279 | 30107 | 30202 | 38.60 | 100 | -285 | 1,2,3 | |
| MCG +05-54-41 | 2006en | 98.23 | -27.74 | 9575 | 9733 | 9387 | 36.00 | 164 | 97 | 5 | |
| NGC 7541 | 1998dh | 82.84 | -50.65 | 2689 | 2776 | 32.94 | 140 | 378 | 1,2,3 | ||
| ESO 291-11 | 1992bl | 344.15 | -63.93 | 12891 | 12701 | 12839 | 36.64 | 92 | -138 | 1,2,3 | |
| Pegasus | Pegasus | 87.78 | -48.38 | 3554 | 3633 | 3381 | 33.96 | 143 | -188 | 6 | |
| NGC 7634 | 1972J | Pegasus | 88.69 | -47.93 | 3225 | 3317 | 33.53 | 144 | 177 | 1 | |
| NGC 7678 | 2002dp | 98.88 | -36.55 | 3489 | 3642 | 3308 | 33.65 | 155 | 325 | 5 | |
| A2634 | A2634 | 103.45 | -33.06 | 9409 | 9546 | 9230 | 35.72 | 157 | 1051 | 6 | |
| Anon 2340+26 | 1997dg | A2634 | 103.62 | -33.98 | 10193 | 10321 | 10014 | 36.22 | 156 | -317 | 1,2,3 |
| A4038 | A4038 | 25.19 | -75.84 | 8994 | 8864 | 8904 | 35.82 | 106 | -22 | 6 | |
| ESO 471-27 | 1993ah | A4038 | 25.87 | -76.77 | 8803 | 8674 | 8714 | 35.70 | 106 | 256 | 1,3 |
| NGC 7780 | 2001da | 99.20 | -52.06 | 5155 | 5214 | 4995 | 34.37 | 140 | 608 | 5 | |
| ESO 538-13 | 2005iq | 64.83 | -75.21 | 10206 | 10110 | 10097 | 36.15 | 114 | -199 | 4a,b |
| WAN-REI | JHA-REI | WOO-REI | WAN-JHA | WAN-WOO | JHA-WOO | FRE-WOO | SNe-cl. | |
|---|---|---|---|---|---|---|---|---|
| (1) | (2) | (3) | (4) | (5) | (6) | (7) | (8) | |
| : | 0.09 | 0.14 | 0.16 | 0.12 | 0.20 | 0.20 | 0.14 | 0.18 |
| N: | 81 | 101 | 7 | 88 | 15 | 15 | 6 | 14 |
| Sample | N | slope | error | |
|---|---|---|---|---|
| (1) | (2) | (3) | (4) | (5) |
| Reindl | 62 | 0.188 | 0.004 | 0.16 |
| Wang | 55 | 0.190 | 0.003 | 0.13 |
| Jha | 72 | 0.183 | 0.003 | 0.18 |
| Wood-Vasey/Freedman | 45 | 0.189 | 0.005 | 0.16 |
| Hicken | 88 | 0.194 | 0.004 | 0.16 |
| Masters | 27 | 0.208 | 0.007 | 0.14 |
| Jørgensen | 10 | 0.179 | 0.014 | 0.18 |
| all | 218 | 0.193 | 0.002 | 0.15 |
| (1) | (2) | (3) | (4) | (5) | (6) | (7) | (8) | ||
|---|---|---|---|---|---|---|---|---|---|
| Author(s) | Method | convergence | |
|---|---|---|---|
| () | |||
| Aaronson et al. 1986 | clusters (21cm) | 10 | |
| Lilje et al. 1986 | 21cm | field galaxies | |
| Jerjen & Tammann 1993 | clusters | 15 | |
| Federspiel et al. 1994 | line widths | field galaxies | |
| Riess et al. 1995 | SNe Ia | 13 | |
| Giovanelli et al. 1998 | clusters (21cm) | 24 | |
| Dale et al. 1999 | clusters (21cm) | 52 | - |
| Hoffman et al. 2001 | various | field galaxies | |
| Watkins et al. 2009 | various | field galaxies | |
| present paper | SNe Ia, clusters | 170 |
| cluster | |||||
|---|---|---|---|---|---|
| (1) | (2) | (3) | (4) | (5) | (6) |
| A2806 | 35.47 | 1 | 8310 | 7588 | |
| N383Gr | 34.54 | 2 | 4957 | 4977 | |
| A2877 | 35.46 | 1 | 7396 | 7554 | |
| N507Gr | 34.31 | 2 | 4802 | 4482 | |
| A0194 | 34.60 | 2 | 5302 | 5115 | |
| A0262 | 34.44 | 1 | 4770 | 4756 | |
| A0397 | 35.87 | 2 | 9749 | 9089 | |
| A0400 | 35.19 | 1 | 7276 | 6685 | |
| A0426 | 34.68 | 2 | 5745 | 5304 | |
| A0496 | 36.03 | 1 | 9928 | 9767 | |
| A0539 | 35.95 | 1 | 8580 | 9422 | |
| A0569 | 34.92 | 3 | 6053 | 5915 | |
| A0634 | 35.72 | 1 | 7957 | 8495 | |
| Cancer | 34.51 | 2 | 4623 | 4910 | |
| A0779 | 35.52 | 1 | 6840 | 7761 | |
| Hydra | 34.23 | 2 | 3973 | 4322 | |
| AS639 | 34.89 | 1 | 6512 | 5835 | |
| A1367 | 34.98 | 2 | 6707 | 6078 | |
| Coma | 35.49 | 3 | 6982 | 7657 | |
| A3574 | 34.42 | 3 | 4913 | 4713 | |
| AS753 | 34.27 | 1 | 4306 | 4401 | |
| A2199 | 35.81 | 2 | 8949 | 8847 | |
| PavoII | 34.28 | 2 | 4189 | 4422 | |
| Grm15 | 34.22 | 2 | 4269 | 4302 | |
| PavoI | 33.98 | 1 | 4138 | 3857 | |
| Pegasus | 33.75 | 2 | 3381 | 3472 | |
| A2634 | 35.97 | 2 | 9230 | 9507 | |
| A4038 | 35.76 | 2 | 8904 | 8649 |